Concept Maps
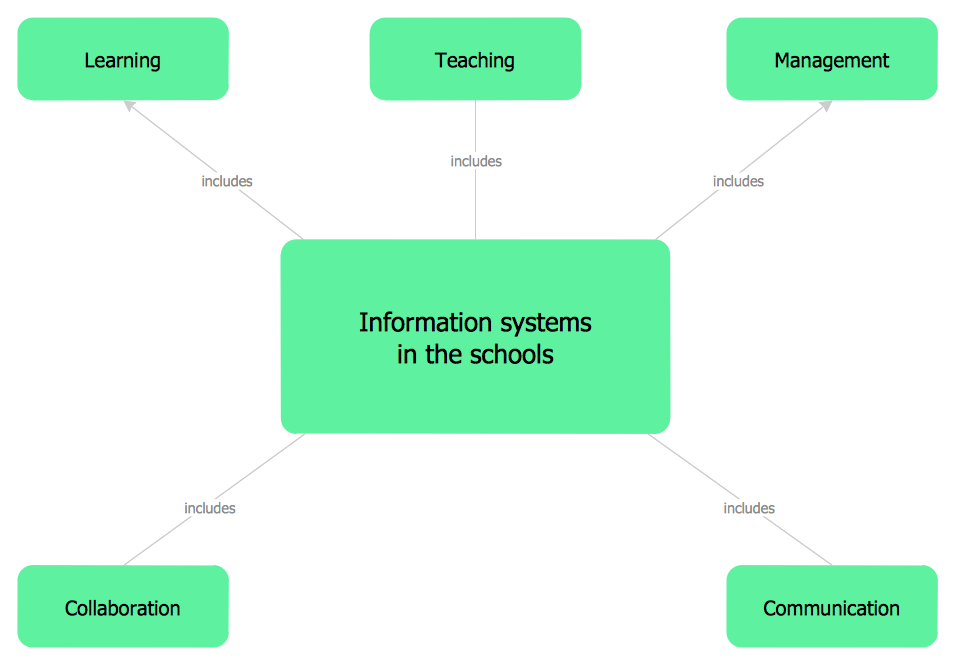
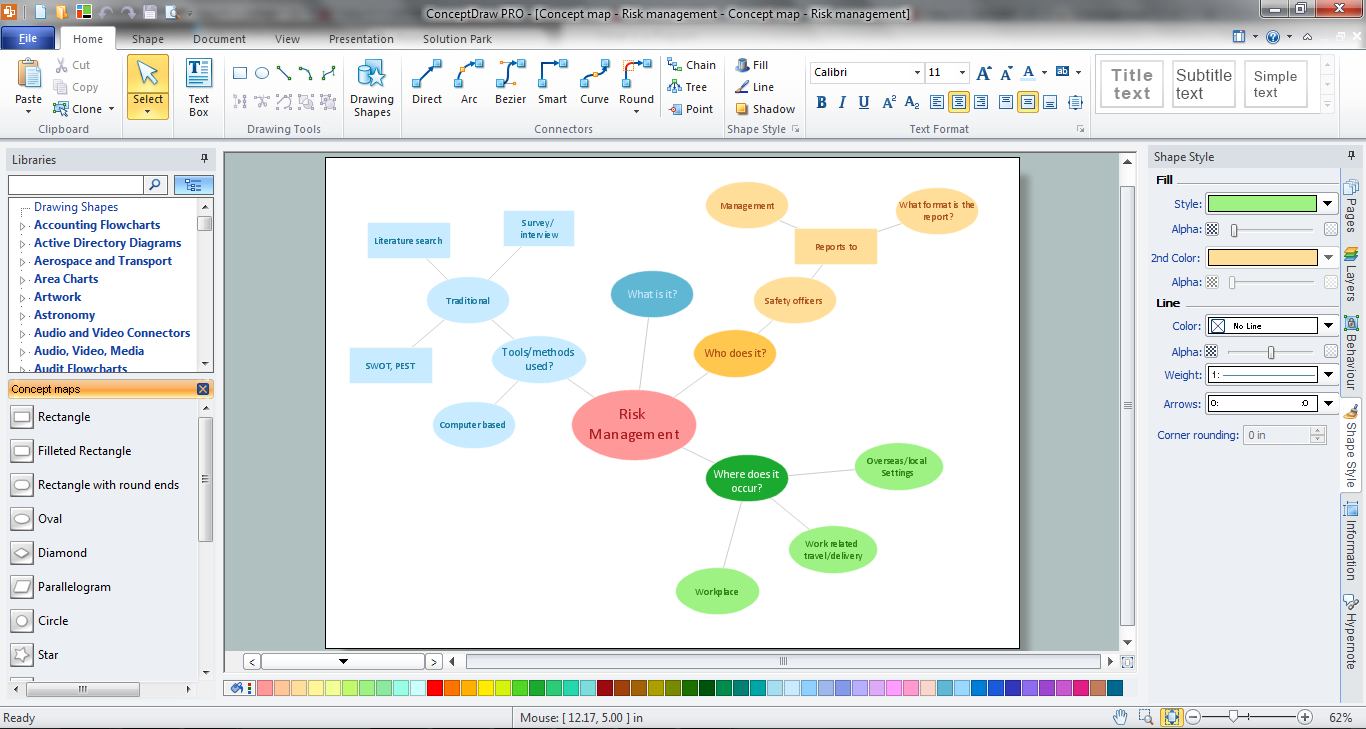
As concept map consists from conception-blocks and links between them, you can use ConceptDraw library objects and add to a document as much objects as you need. ConceptDraw tools let you to edit, group, move objects, change their appearance and add text signs and raster or vector pictures.ConceptDraw PRO diagramming and vector drawing software extended with Concept Maps Solution from the "What is a Diagram" Area is effective tool for creating professional looking Concept Maps.
HelpDesk
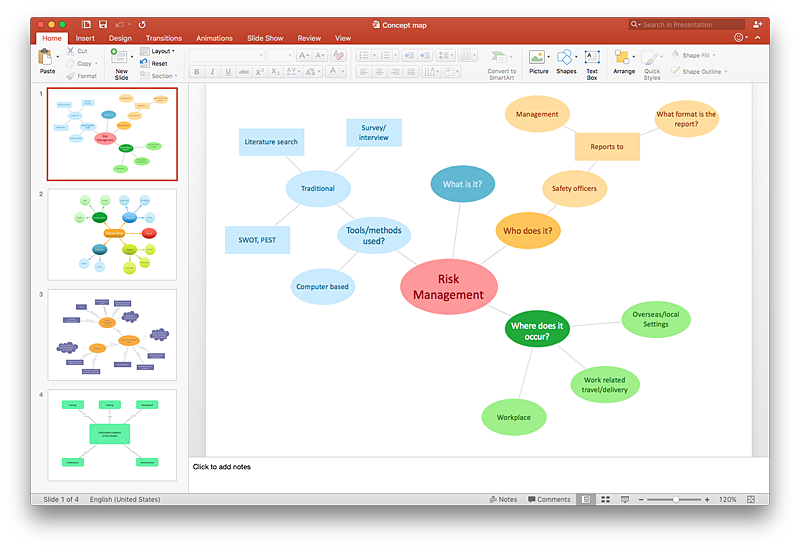
How to Add a Concept Map to a PowerPoint Presentation Using ConceptDraw PRO
Concept maps visually present the relationships among a set of a logically connected items. ConceptDraw PRO allows you to draw concept maps using the Concept Map solution. The PowerPoint presentation of key concept points can be very informative and helpful.HelpDesk
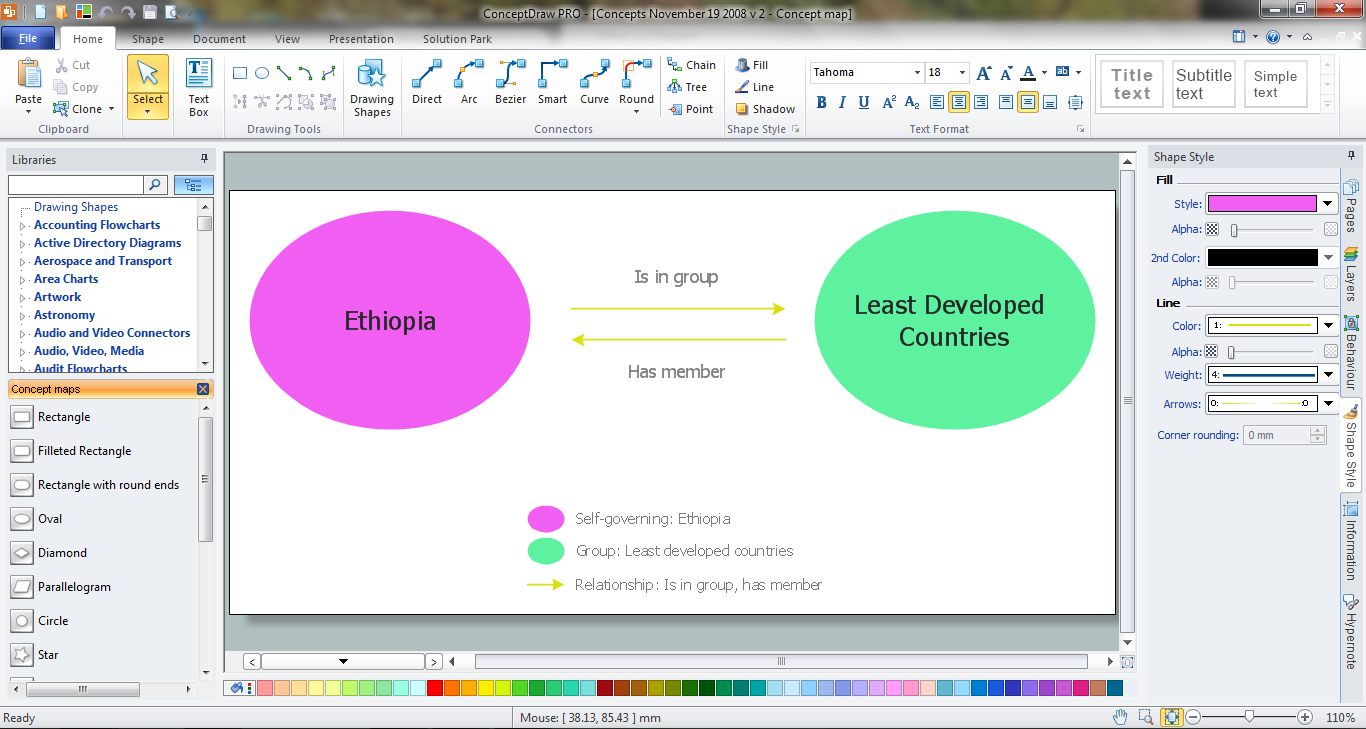
How to Create a Concept Map in ConceptDraw PRO
Graphical technique of knowledge representation in a form of structured networks of concepts (ideas) is called concept mapping. Concept network consists of shapes that represent concepts and connectors representing relationships between concepts. The difference between mind maps and concept maps is that a mind map has only one object depicting a main idea , while a concept map may have several. Concept mapping is used to structure ideas, to communicate complex system of knowledge, to help learning process, etc. ConceptDraw PRO allows you to draw concept maps using the Concept Map solution.Concept Map Maker
ConceptDraw PRO diagramming and vector drawing software extended with Concept Maps Solution from the "What is a Diagram" Area is a powerful Concept Map Maker.
 Value Stream Mapping
Value stream mapping solution extends ConceptDraw PRO software with templates, samples and vector stencils for drawing the Value Stream Maps (VSM) in lean manufacturing practice.
Concept Mapping
Being usually a very complex process that requires a lot of skills, patience, time, and artistic abilities, the concept mapping process now is incredibly easy thanks to the Concept Maps Solution from the "What is a Diagram" Area of ConceptDraw Solution Park.
 Concept Maps
The technique of concept mapping was developed as a constructive way of representing knowledge in science and increasing the meaningfulness of learning. Now, the creation of a concept map is extremely helpful when used in education as learning and teaching techniques that assist memorization. Concept maps are also used for idea generation in brainstorming sessions, and for detailing the structure of complex ideas.
How To Make a Concept Map
How to make a Concept Map fast and easy? ConceptDraw PRO diagramming and vector drawing software extended with Concept Maps Solution from the "What is a Diagram" Area is the best choice for those who want design professional looking Concept Map in minutes.What Is a Concept Map
What is a Concept Map and what software is effective for its design? A concept map or conceptual diagram is a diagram that depicts suggested relationships between concepts. As for effective software - we suggest you to pay attention for the ConceptDraw PRO diagramming and vector drawing software. Extended with Concept Maps Solution from the "What is a Diagram" Area it is a real godsend for you.Concept Map
A concept map is a way of representing relationships between ideas, images, or words.How to draw a Concept Map quick, easy and effective? ConceptDraw PRO offers the unique Concept Maps Solution from the "What is a Diagram" Area that will help you!
Simple Diagramming
Create flowcharts, org charts, floor plans, business diagrams and more with ConceptDraw PRO.
The Best Flowchart Software Available
ConceptDraw gives the ability to draw Flowchart documents. Flowcharts solutionis a powerful tool that extends ConceptDraw application for drawing business flowcharts.ConceptDraw PRO vector diagramming and business graphics software enhanced with with templates, green and interactive flowchart makers, samples and stencil libraries from ConceptDraw Solution Park which all focused to help with drawing flowcharts, block diagrams, bar charts, histograms, pie charts, divided bar diagrams, line graphs, area charts, scatter plots, circular arrows diagrams, Venn diagrams, bubble diagrams, concept maps, and others.

HelpDesk
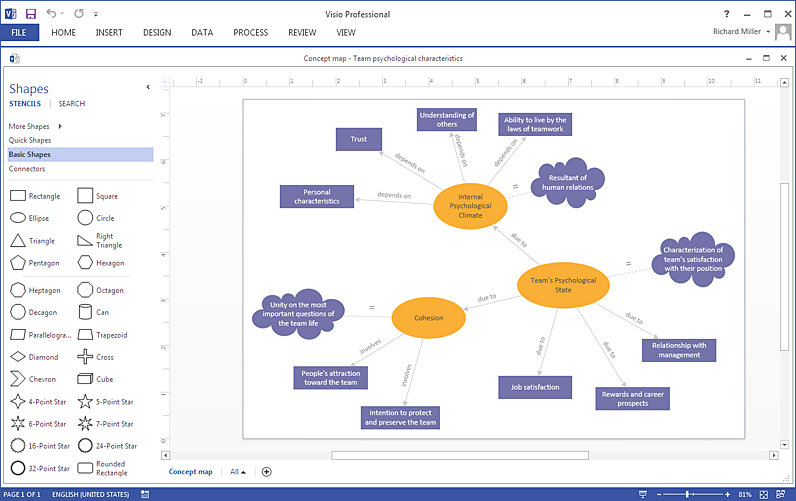
How To Create a Concept Map in Visio Using ConceptDraw PRO
ConceptDraw PRO allows you to easily create concept maps and then make a MS Visio file from your diagrams in a few simple steps.HelpDesk
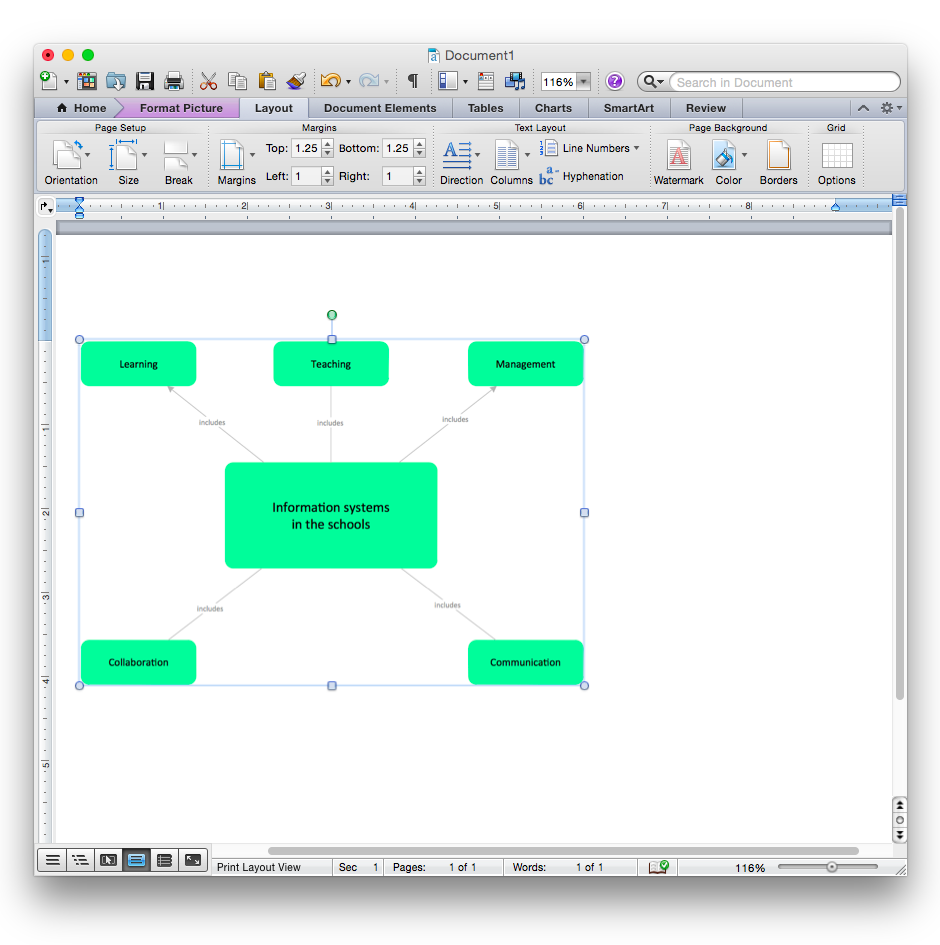
How to Add a Concept Map to a MS Word Document Using ConceptDraw PRO
ConceptDraw PRO allows you to easily create concept maps and then insert them into a MS Word document.
 Quality Mind Map
This solution extends ConceptDraw MINDMAP software with Quality Management Mind Maps (Presentations, Meeting Agendas, Problem to be solved).
 Enterprise Architecture Diagrams
Enterprise Architecture Diagrams solution extends ConceptDraw PRO software with templates, samples and library of vector stencils for drawing the diagrams of enterprise architecture models.
 Cisco Network Diagrams
Cisco Network Diagrams solution extends ConceptDraw PRO software with samples, templates and libraries of vector stencils for drawing the Cisco computer network diagrams.
Influence Diagram Software
Influence diagram (ID) is a graphical and mathematical representation of the decision. Influence diagrams are widely used in the decision analysis and in the game theory. They are the alternative to the decision tree. The influence diagram gives to analyst the high-level conceptual view that it can use to build the detailed quantitative model.This sample shows the Influence diagram. It is a directed acyclic graph with three types of nodes: Decision node is drawn as a rectangle, Uncertainty node is drawn as an oval, Value node is drawn as an octagon. The nodes are connected with arcs.
- Internet marketing - Concept map | Marketing Diagrams | Concept ...
- Concept Maps
- Internet marketing - Concept map | Flowchart Marketing Process ...
- Venn Diagram Concept Map
- Concept Maps | Venn Diagrams | Venn Diagram Examples for ...
- Concept Maps | Marketing Diagrams | ConceptDraw Solution Park ...
- Risk management - Concept map | The Best Flowchart Software ...
- Concept Maps | Value Stream Mapping | Concept maps with ...
- Pyramid Concept Map
- Concept Map Pyramid
- Biology | Concept Maps | Value Stream Mapping | Sample Concept ...
- Risk management - Concept map | How To Make a Concept Map ...
- Nursing Concept Map Template Mac
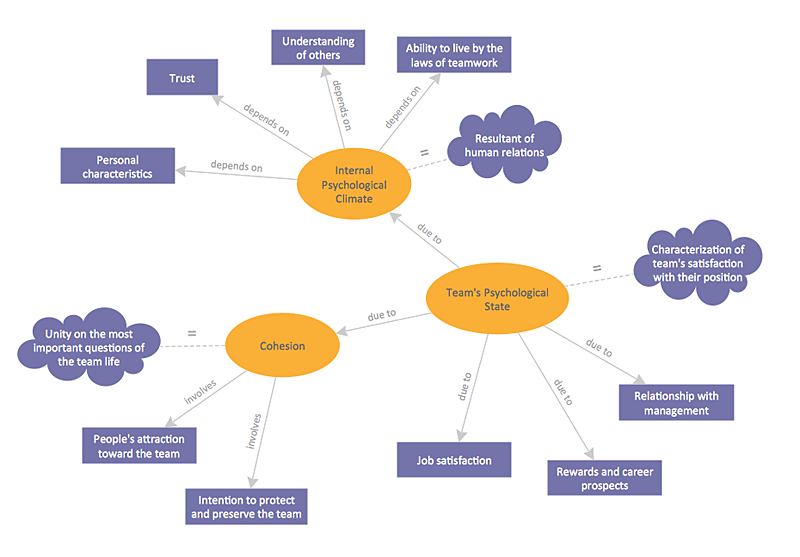
- Concept map - Team psychological characteristics | Block Diagrams ...
- Sample Web Concept Map
- Simple Diagramming | ConceptDraw Solution Park | Business ...
- Internet marketing - Concept map | Concept Maps | What Is a ...
- Concept Maps | What Is a Concept Map | ConceptDraw Solution ...
- Psychology Concept Map Examples
- Concept Maps | Value Stream Mapping | Concept maps with ...

