 Accounting Flowcharts
Accounting Flowcharts solution extends ConceptDraw DIAGRAM software with templates, samples and library of vector stencils for drawing the accounting flow charts.
 Flowcharts
The Flowcharts solution for ConceptDraw DIAGRAM is a comprehensive set of examples and samples in several varied color themes for professionals that need to represent graphically a process. Solution value is added by the basic flow chart template and shapes' libraries of flowchart notation. ConceptDraw DIAGRAM flow chart creator lets one depict the processes of any complexity and length, as well as design the Flowchart either vertically or horizontally.
 Social Media Response
This solution extends ConceptDraw DIAGRAM and ConceptDraw MINDMAP with the ability to draw interactive flow charts with action mind map templates, to help create an effective response to applicable social media mentions.
HelpDesk
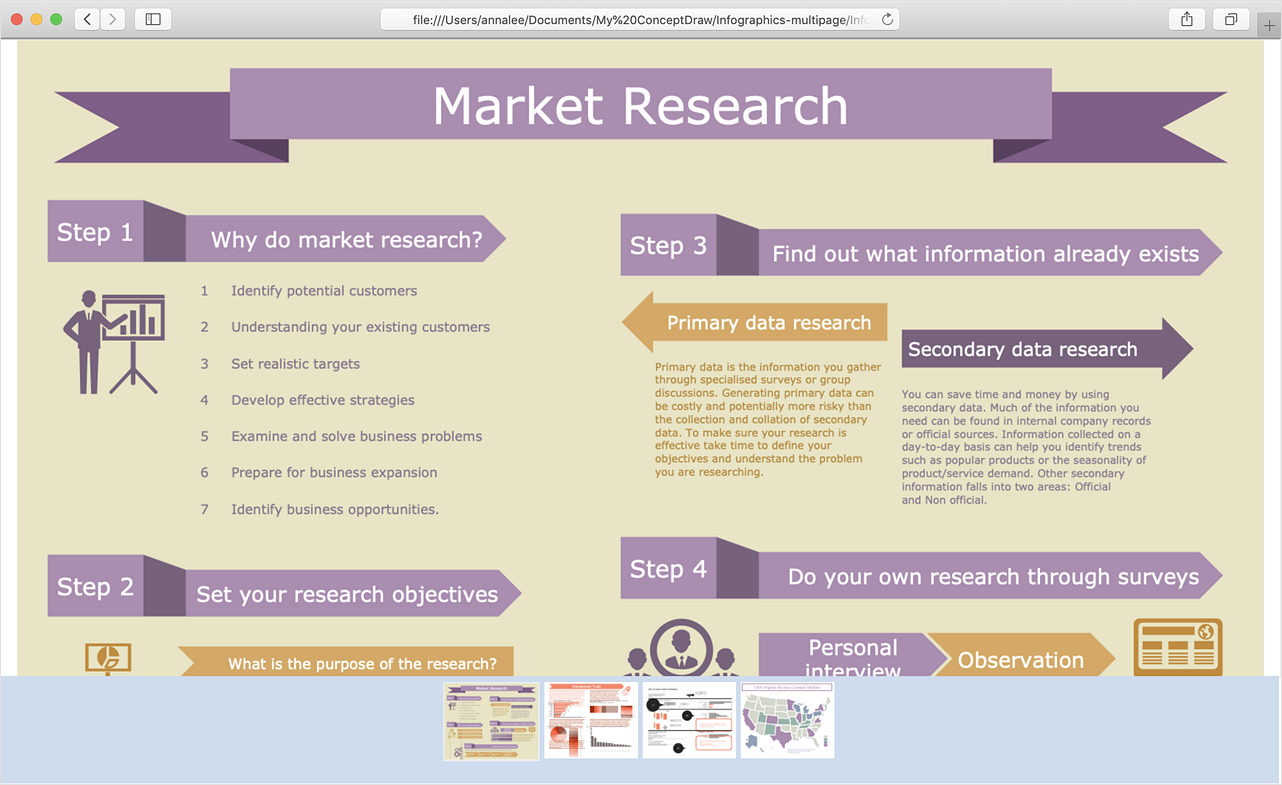
How to Make a Web Page from Infographics
Create your own original marketing illustrations and infographics, presentation slides, website, and blog pages using ConceptDraw DIAGRAM.Business diagrams & Org Charts with ConceptDraw DIAGRAM
The business diagrams are in great demand, they describe the business processes, business tasks and activities which are executed to achieve specific organizational and business goals, increase productivity, reduce costs and errors. They let research and better understand the business processes. ConceptDraw DIAGRAM is a powerful professional cross-platform business graphics and business flowcharting tool which contains hundreds of built-in collections of task-specific vector stencils and templates. They will help you to visualize and structure information, create various Business flowcharts, maps and diagrams with minimal efforts, and add them to your documents and presentations to make them successful. Among them are Data flow diagrams, Organization charts, Business process workflow diagrams, Audit flowcharts, Cause and Effect diagrams, IDEF business process diagrams, Cross-functional flowcharts, PERT charts, Timeline diagrams, Calendars, Marketing diagrams, Pyramids, Target diagrams, Venn diagrams, Comparison charts, Analysis charts, Dashboards, and many more. Being a cross-platform application, ConceptDraw DIAGRAM is very secure, handy, free of bloatware and one of the best alternatives to Visio for Mac users.
 Cross-Functional Flowcharts
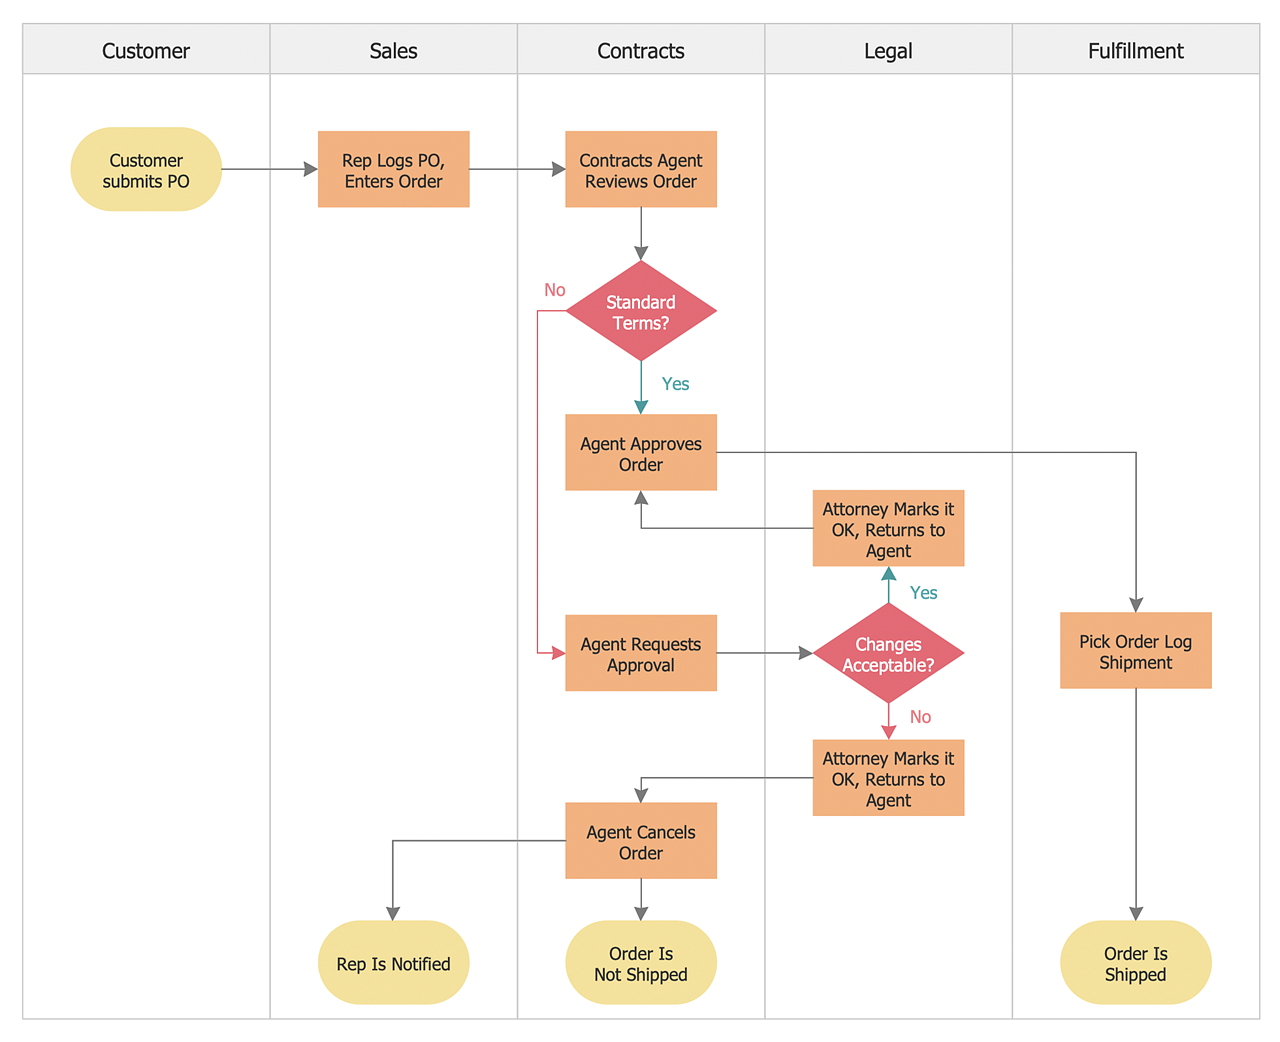
Cross-functional flowcharts are powerful and useful tool for visualizing and analyzing complex business processes which requires involvement of multiple people, teams or even departments. They let clearly represent a sequence of the process steps, the order of operations, relationships between processes and responsible functional units (such as departments or positions).
 Accounting Flowcharts
Accounting Flowcharts solution extends ConceptDraw DIAGRAM software with templates, samples and library of vector stencils for drawing the accounting flow charts.
HelpDesk
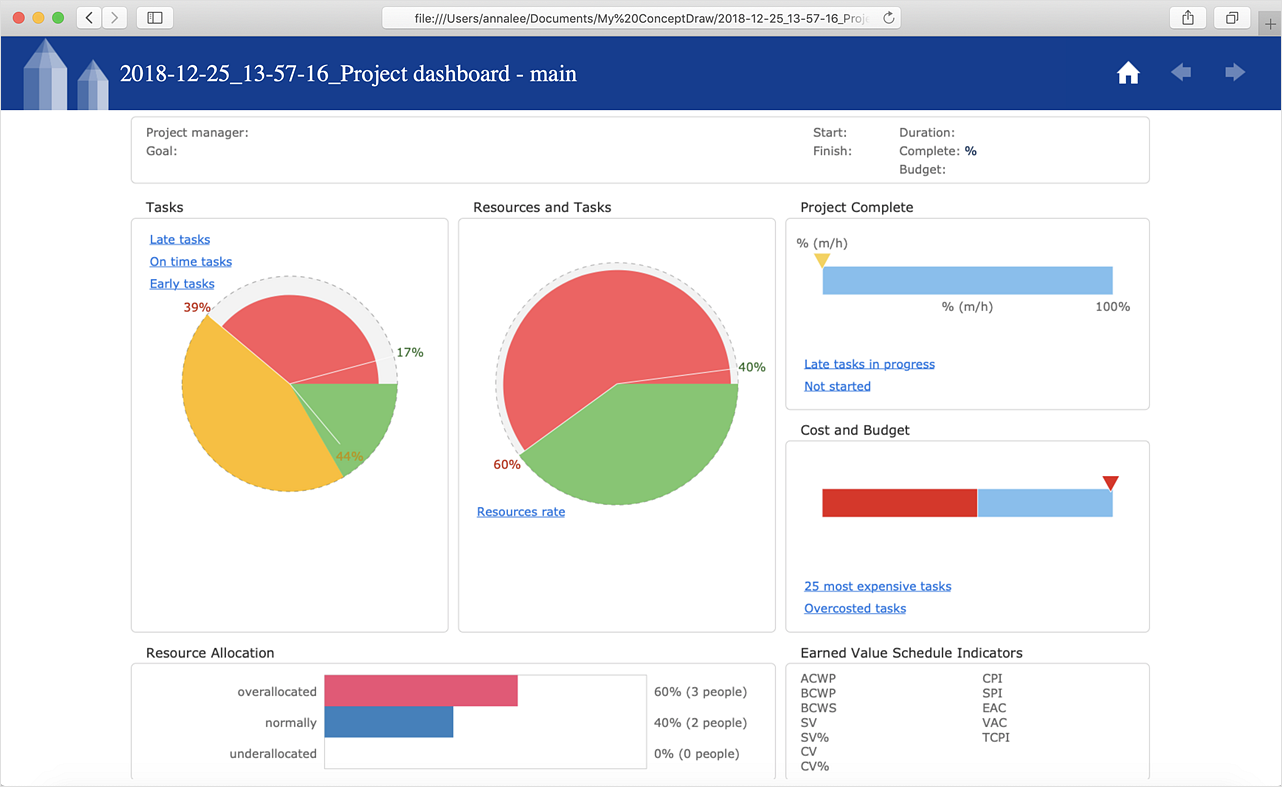
How to Publish Project Reports to a Web Site
Reporting is an important part of project management. Every project manager is regularly asked how the project is progressing. ConceptDraw Office offers different ways in which to provide a project status.HelpDesk
How to Create a Cross-Functional Flowchart
Cross-functional flowcharts are used to visualize cross-functional processes. A cross-functional process is a process that involves multiple divisions, each of which makes its part of the entire company workflow. For example product development, lead management, client orders processing – and other critical processes. All of them are important both for business and customers, but the workflow and responsibilities distribution within these processes are divided between multiple departments and services. Cross-functional processes cannot be depicted with simple workflow diagrams, because of the specific interactions between company departments. ConceptDraw DIAGRAM has released a specialized solution to create cross-functional diagrams. Cross-Functional Flowcharts solution includes a special set of templates and libraries to depict the cross-functional processes.HelpDesk
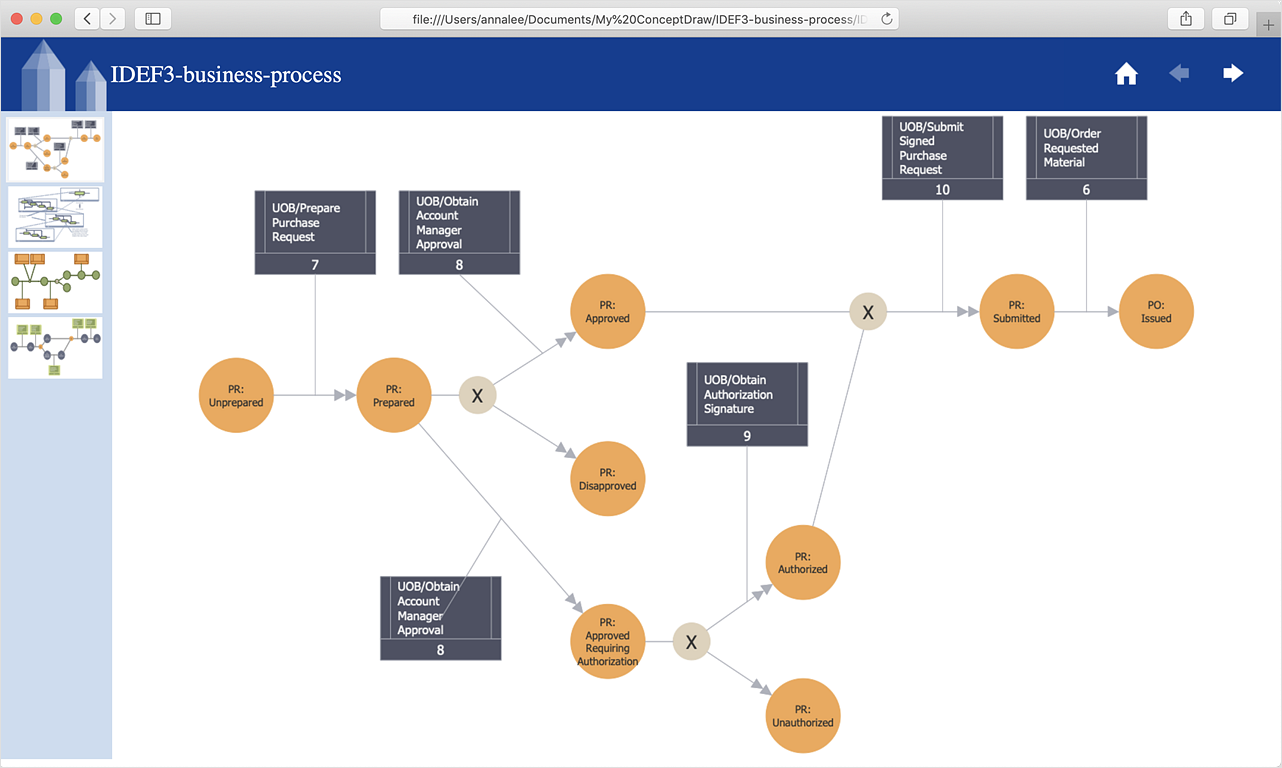
How to Save a Diagram as a Web Page
Using ConceptDraw DIAGRAM , you can save diagrams as a Web pages. ConceptDraw DIAGRAM adds the HTML tags that are needed to display your diagrams in a Web browser, so all you have to do is design their appearance.
 Event-driven Process Chain Diagrams
Event-Driven Process Chain Diagrams solution extends ConceptDraw DIAGRAM functionality with event driven process chain templates, samples of EPC engineering and modeling the business processes, and a vector shape library for drawing the EPC diagrams and EPC flowcharts of any complexity. It is one of EPC IT solutions that assist the marketing experts, business specialists, engineers, educators and researchers in resources planning and improving the business processes using the EPC flowchart or EPC diagram. Use the EPC solutions tools to construct the chain of events and functions, to illustrate the structure of a business process control flow, to describe people and tasks for execution the business processes, to identify the inefficient businesses processes and measures required to make them efficient.
- Website Design Flowchart Example
- Flowchart | Example Process Flow | Best Program to Create a ...
- Flowchart | Example Process Flow | Website launch - Flowchart ...
- Sample Flowchart For Website
- Example Website Flowchart
- Flowchart | Example Process Flow | Accounting Flowcharts | Website ...
- Web Design Flowchart Template
- Flowchart Examples Website Development Project
- Website Wireframe | AWS Architecture Diagrams | ConceptDraw ...
- Amazon Web Services Diagrams - diagramming tool for architecture ...
- Example Flowchart Website Proces
- Example Process Flow | Contoh Flowchart | Website Wireframe ...
- Business diagrams & Org Charts with ConceptDraw PRO | Pyramid ...
- Example of DFD for Online Store (Data Flow Diagram ). DFD ...
- Data Flow Diagram With Easy Business Example
- Flowchart Of A Website Examples
- Process Flowchart | Flow process chart | Flow chart Example ...
- Flowchart | Website launch - Flowchart | Best Program to Create a ...
- Website launch - Flowchart | Flowchart | Accounting Flowcharts ...


