Physics Diagrams

Physics Symbols

The vector stencils library "Laboratory equipment" contains 31 clipart icons of chemical laboratory equipment and labware for drawing part assembly and mounting schemes of glassware apparatus in chemical experiment diagrams and illustrations.
"Laboratory glassware refers to a variety of equipment, traditionally made of glass, used for scientific experiments and other work in science, especially in chemistry and biology laboratories. ...
Glass use in laboratory applications is not as commonplace as it once was because of cheaper, less breakable, plasticware; however, certain applications still require glassware because glass is relatively inert, transparent, heat-resistant, and easy to customize. The type of glass used is dependent on the application. Borosilicate glass, which is commonly used in reagent bottles, can withstand thermal stress. Quartz glass, which is common in cuvettes, can withstand high temperatures and is transparent in certain parts of the electromagnetic spectrum. Darkened brown or amber (actinic) glass, which is common in dark storage bottles, can block ultraviolet and infrared radiation. Heavy-wall glass, which is common in glass pressure reactors, can withstand pressurized applications." [Laboratory glassware. Wikipedia]
The chemical symbols example "Design elements - Laboratory equipment" was created using the ConceptDraw PRO software extended with the Chemistry solution from the Science and Education area of ConceptDraw Solution Park.
Labware
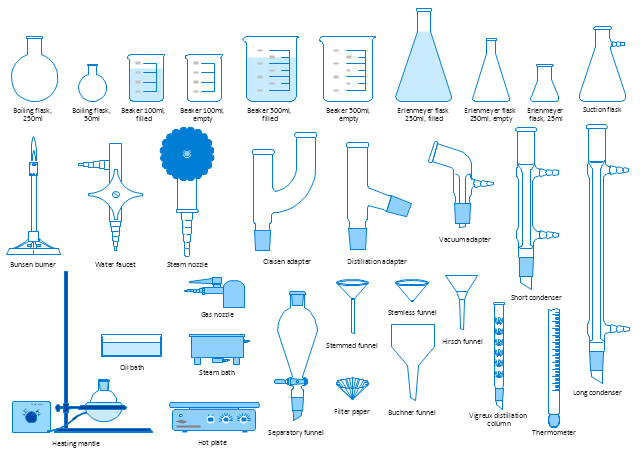
The vector stencils library "Laboratory equipment" contains 31 clipart icons of chemical laboratory equipment and labware.
Use these shapes for drawing part assembly and mounting schemes of glassware apparatus in chemical experiment diagrams and illustrations in the ConceptDraw PRO diagramming and vector drawing software extended with the Chemistry solution from the Science and Education area of ConceptDraw Solution Park.
Use these shapes for drawing part assembly and mounting schemes of glassware apparatus in chemical experiment diagrams and illustrations in the ConceptDraw PRO diagramming and vector drawing software extended with the Chemistry solution from the Science and Education area of ConceptDraw Solution Park.
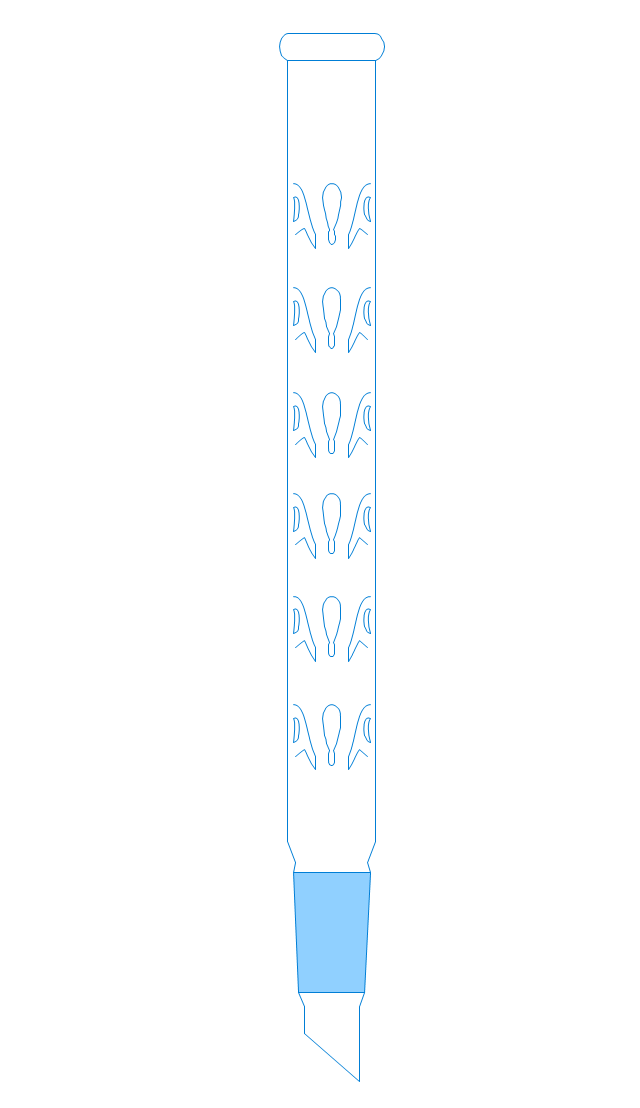
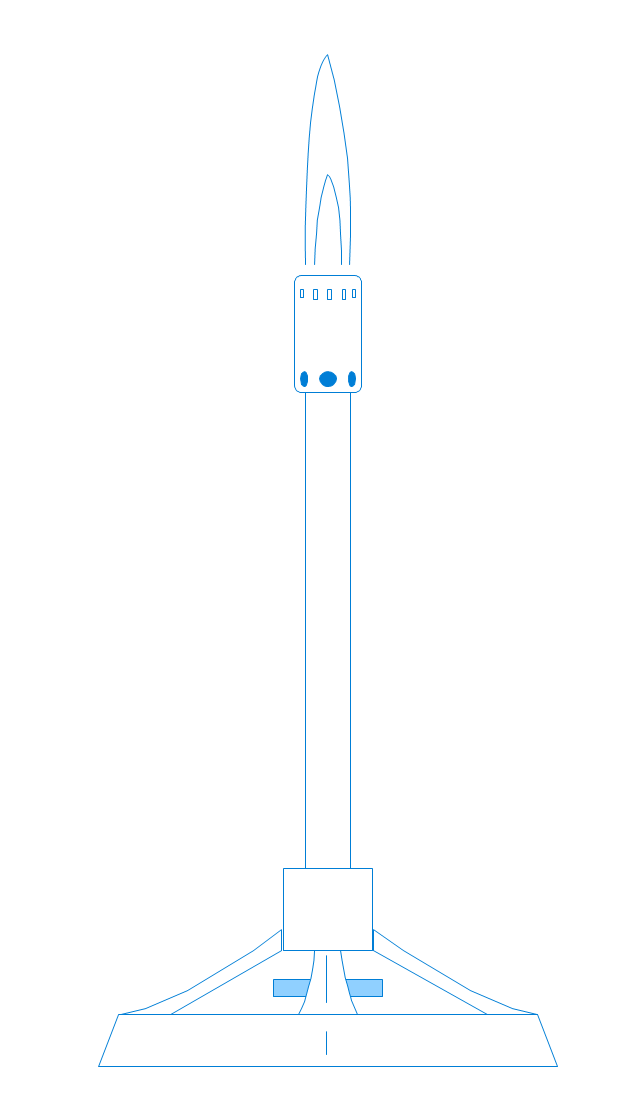
Vigreux distillation column
Hirsch funnel
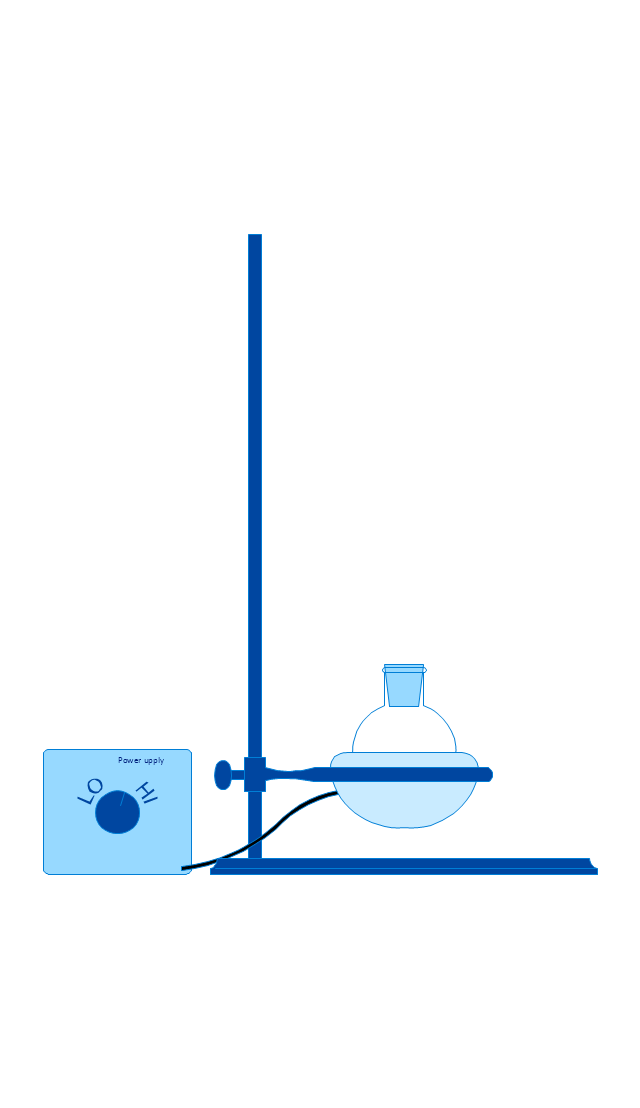
Oil bath

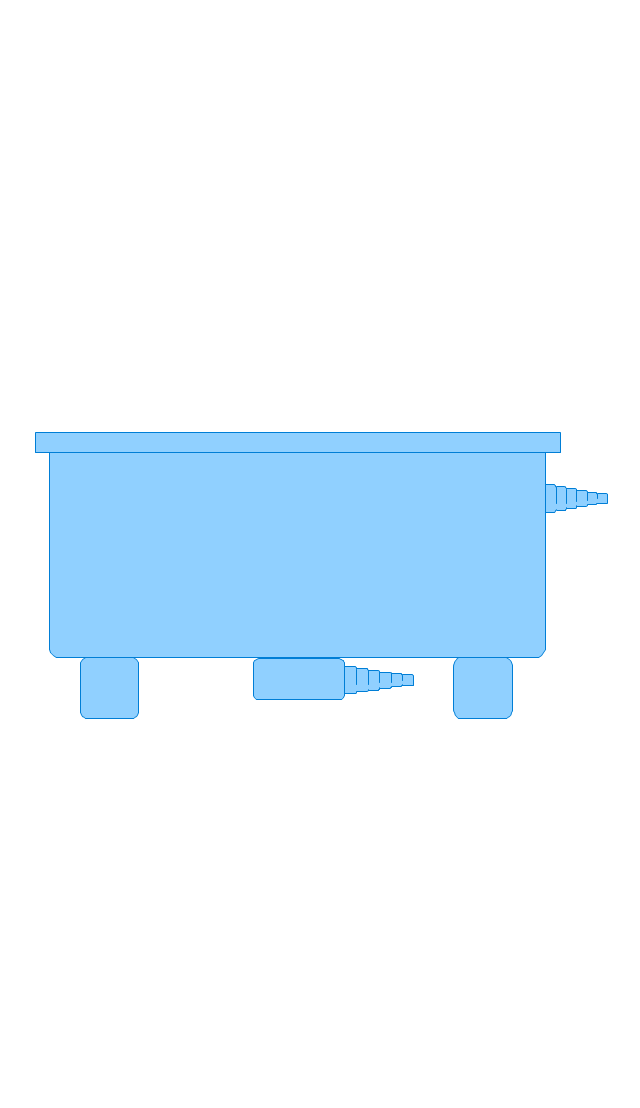
Steam bath
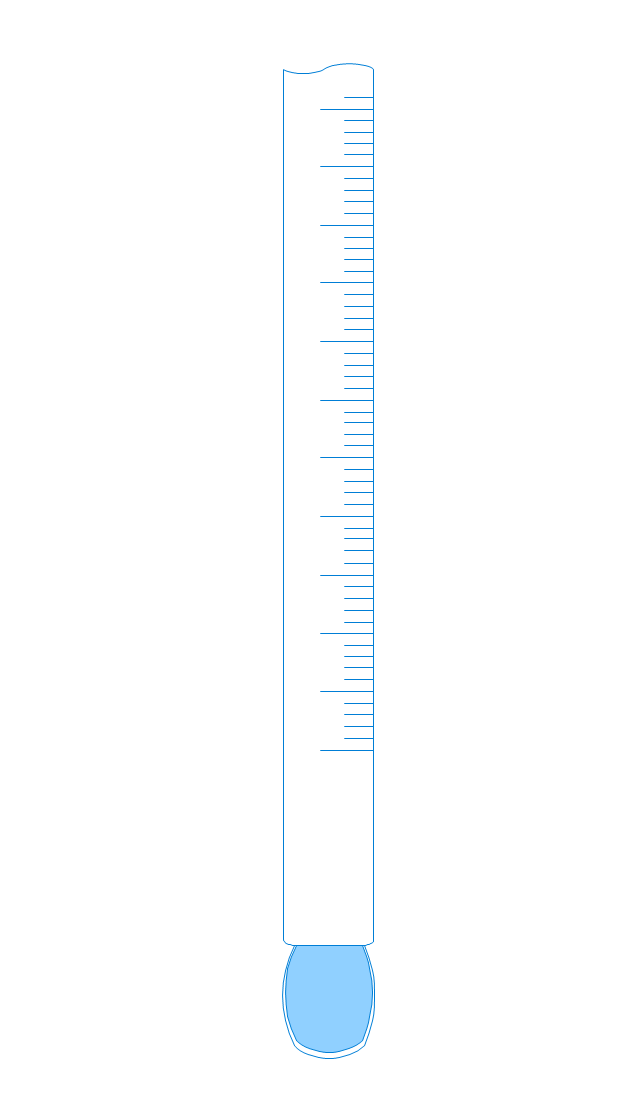
Thermometer
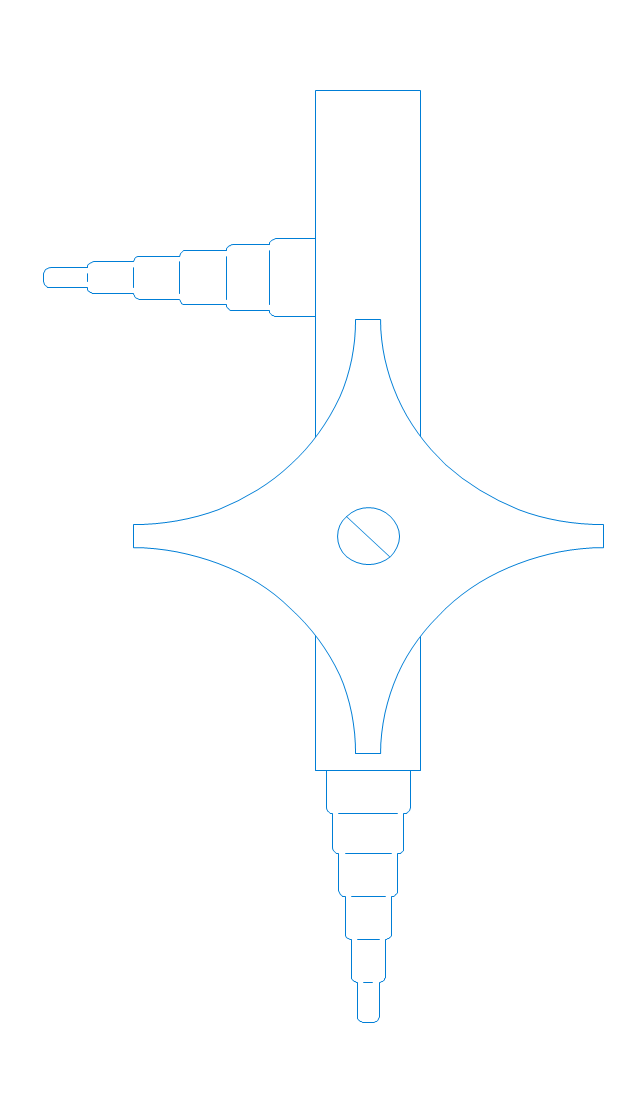
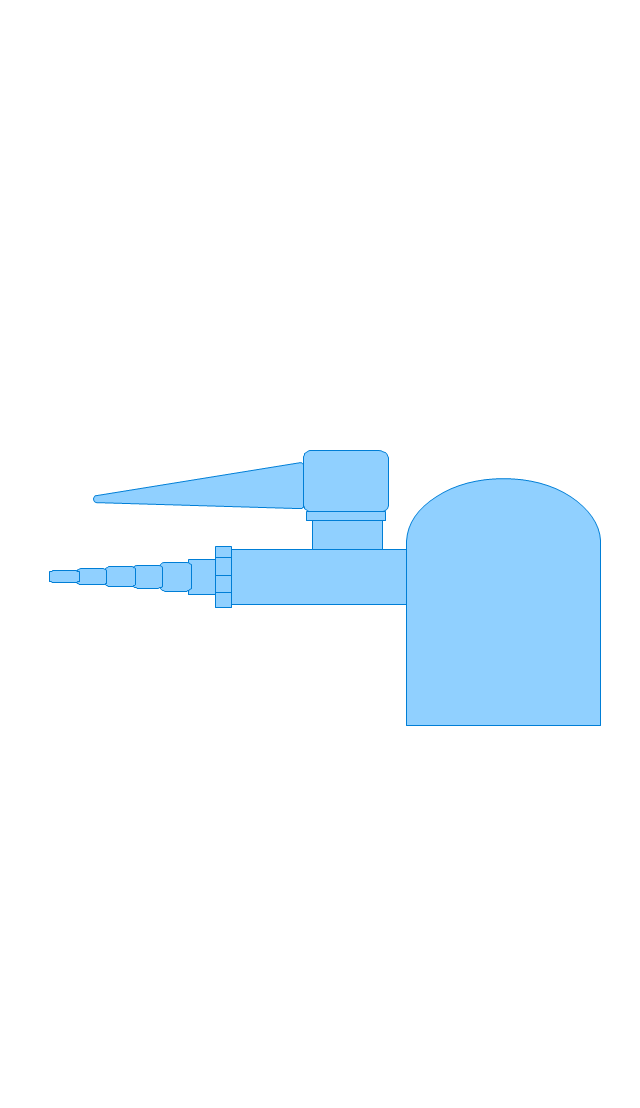
Tap (valve)
--laboratory-equipment---vector-stencils-library.png--diagram-flowchart-example.png)
Vacuum adaptor
Liebig condenser (long)
-laboratory-equipment---vector-stencils-library.png--diagram-flowchart-example.png)
Liebig condenser (short)
-laboratory-equipment---vector-stencils-library.png--diagram-flowchart-example.png)
Water faucet
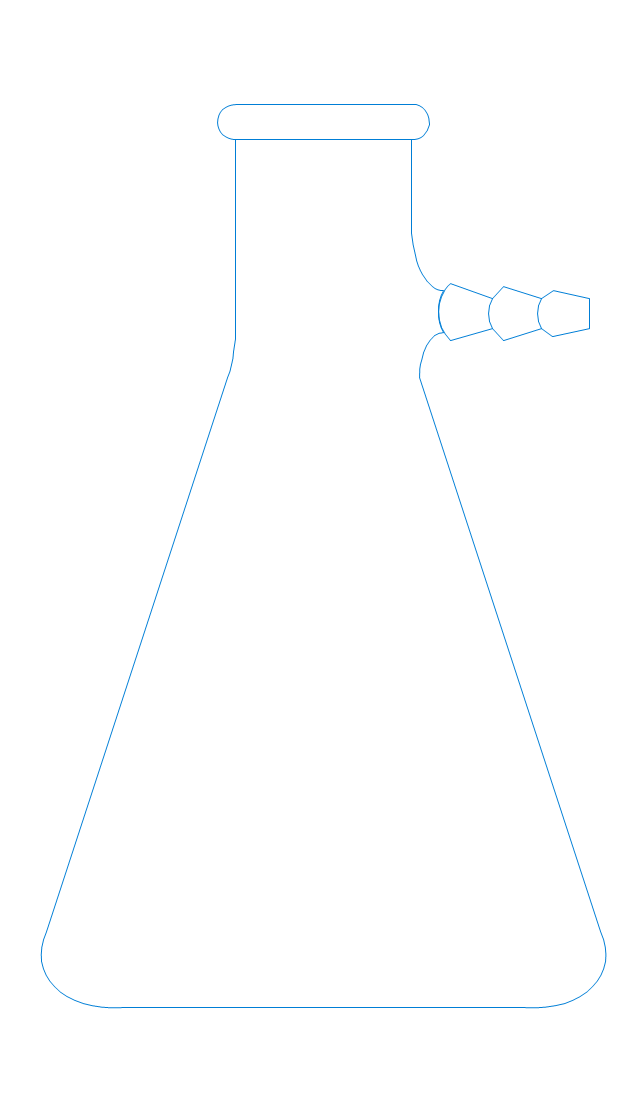
Büchner flask
Stemless funnel
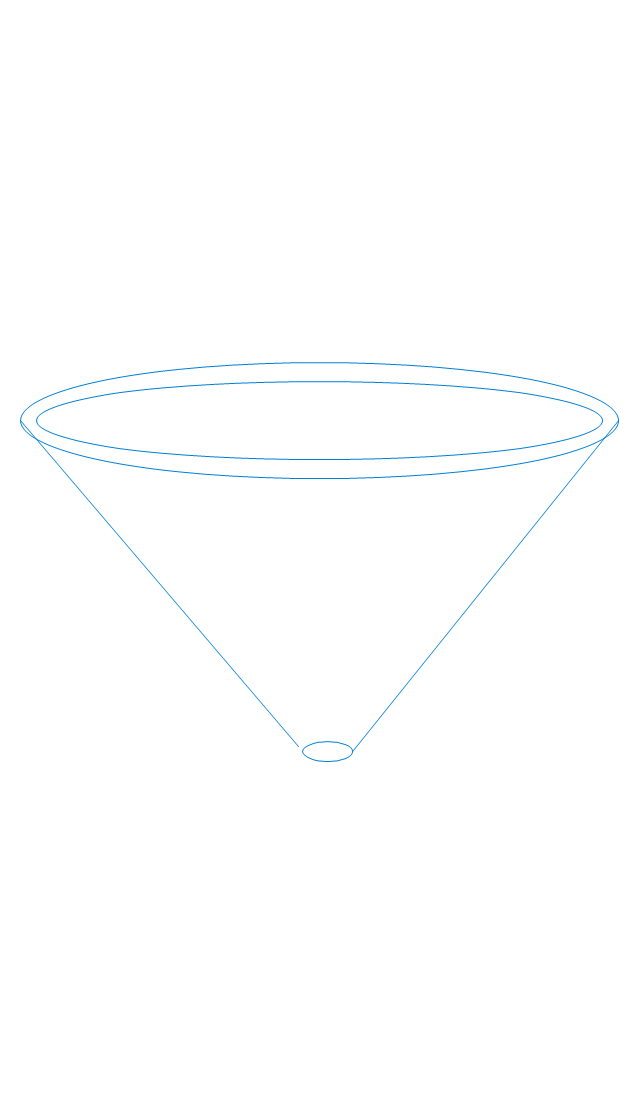
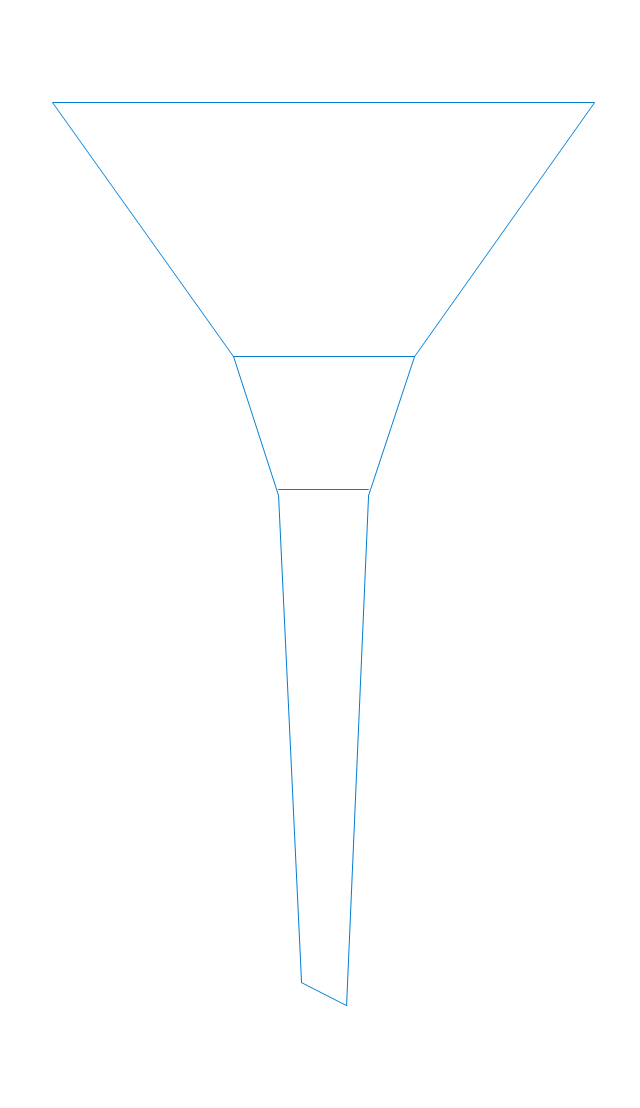
Stemmed funnel

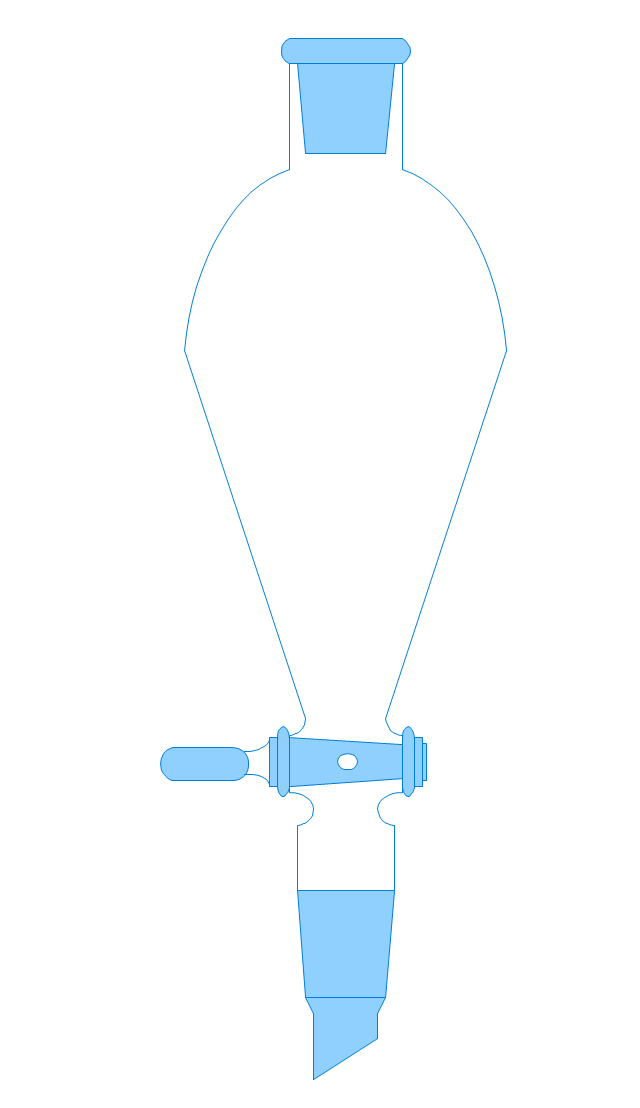
Separatory funnel
Heating mantle
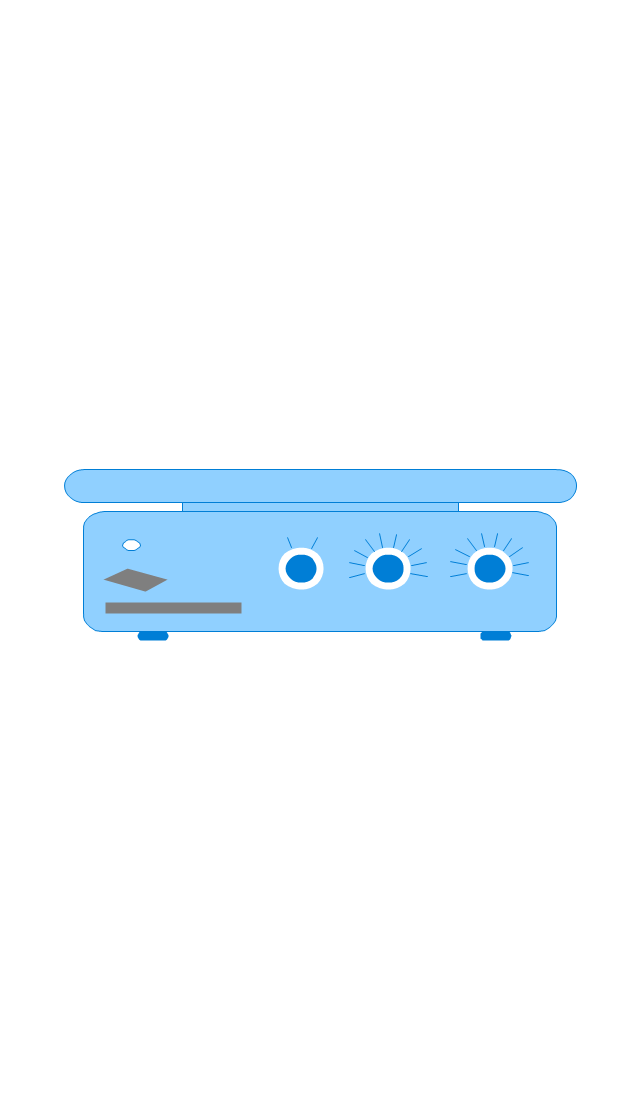
Hot plate
Gas tap
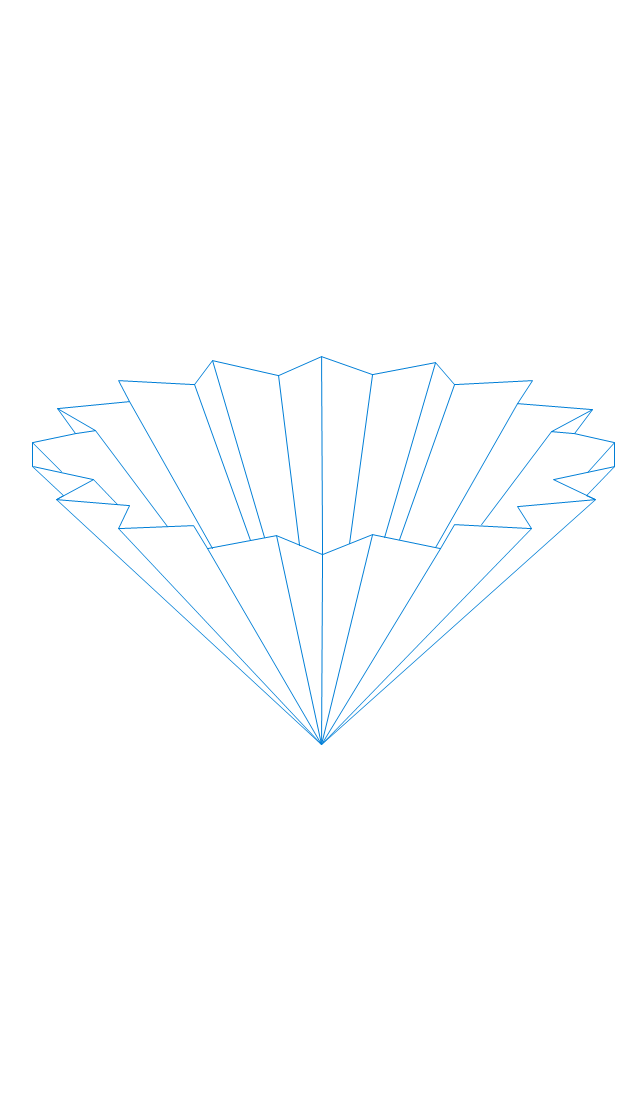
Folded filter paper
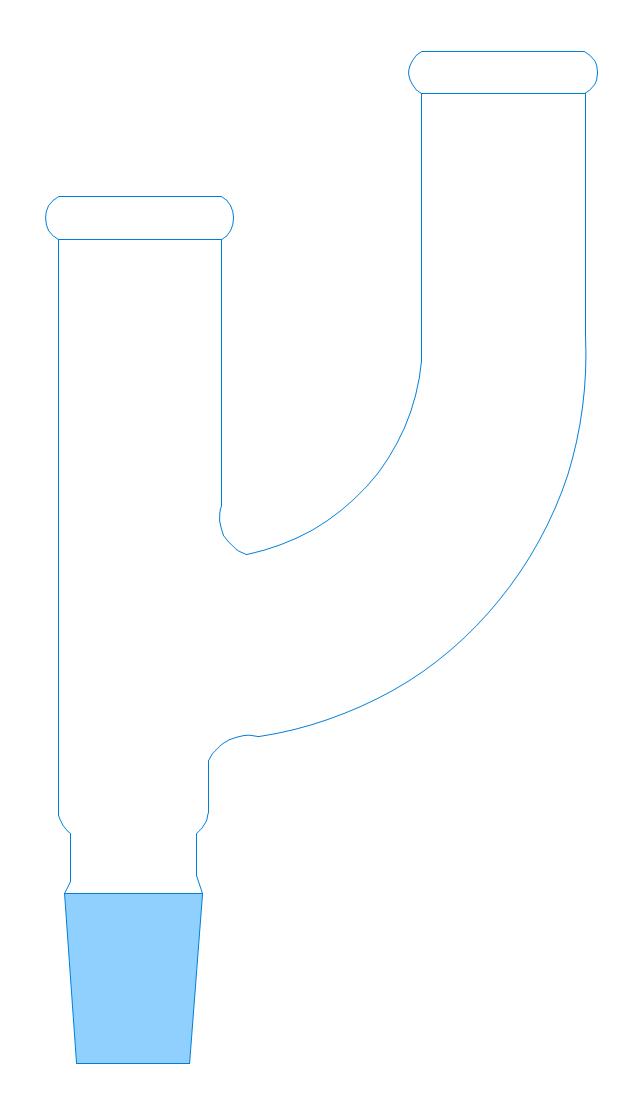
Y-Adaptor
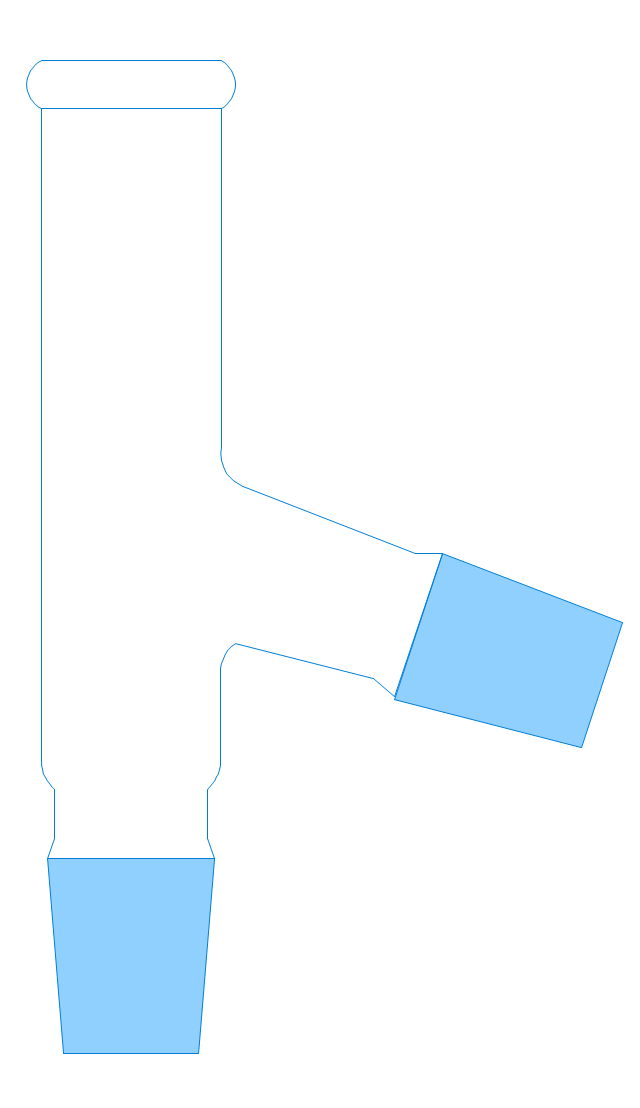
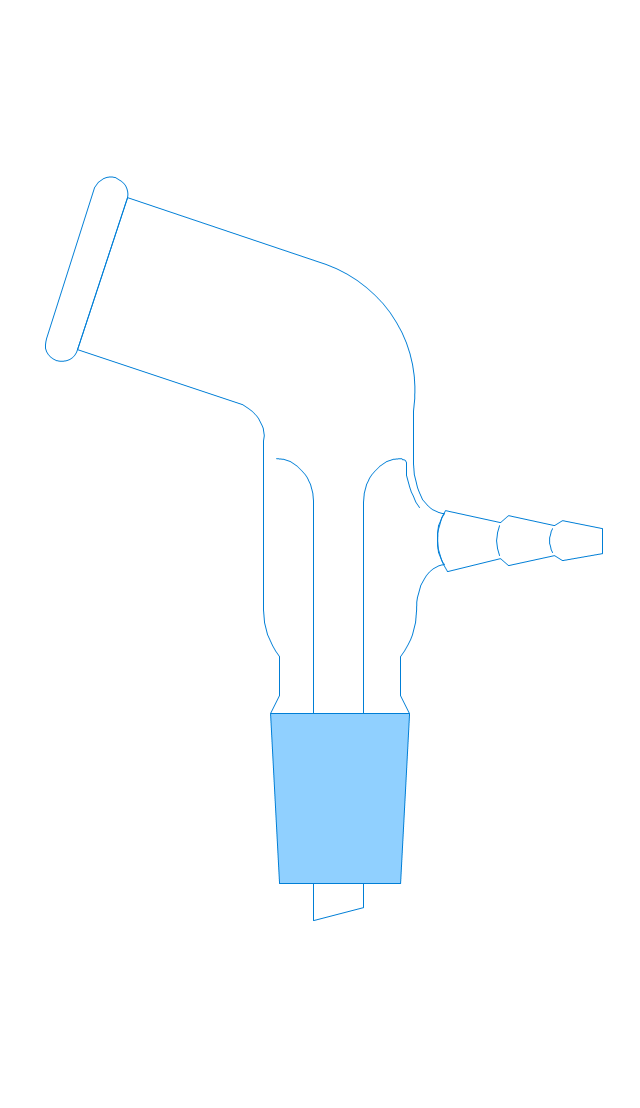
Claisen adapter
Bunsen burner
Büchner funnel

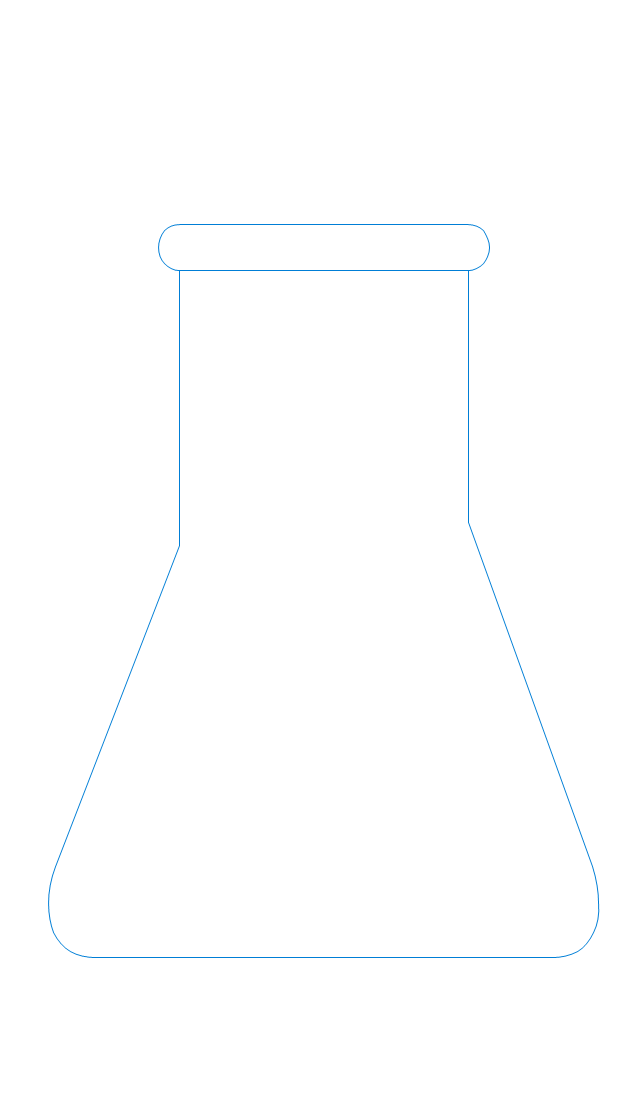
Erlenmeyer flask, 25ml
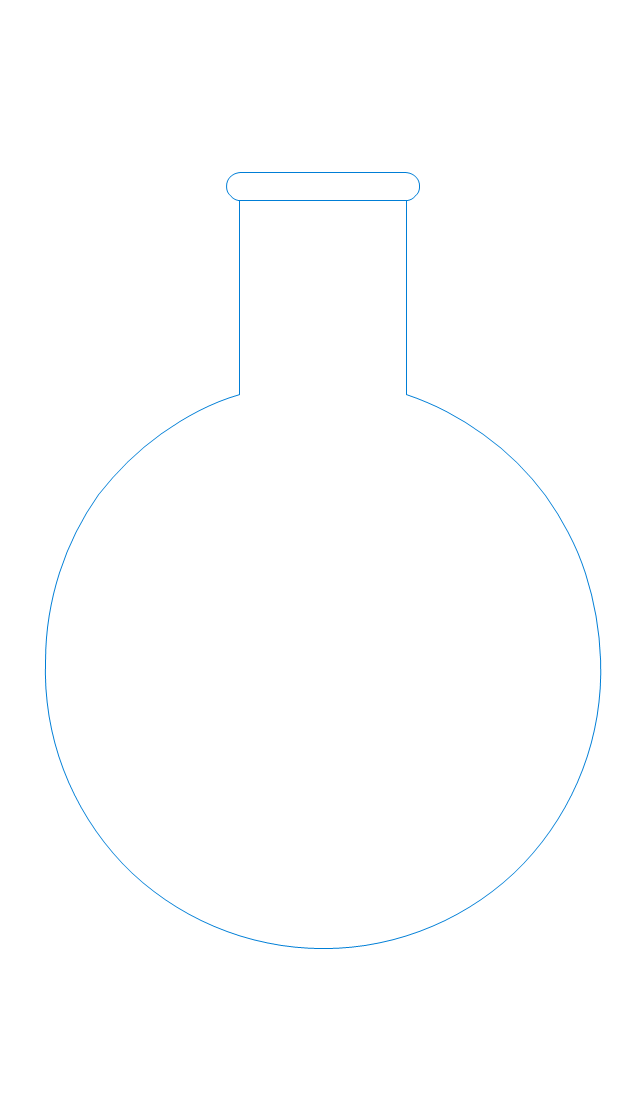
Round-bottom flask, 50ml
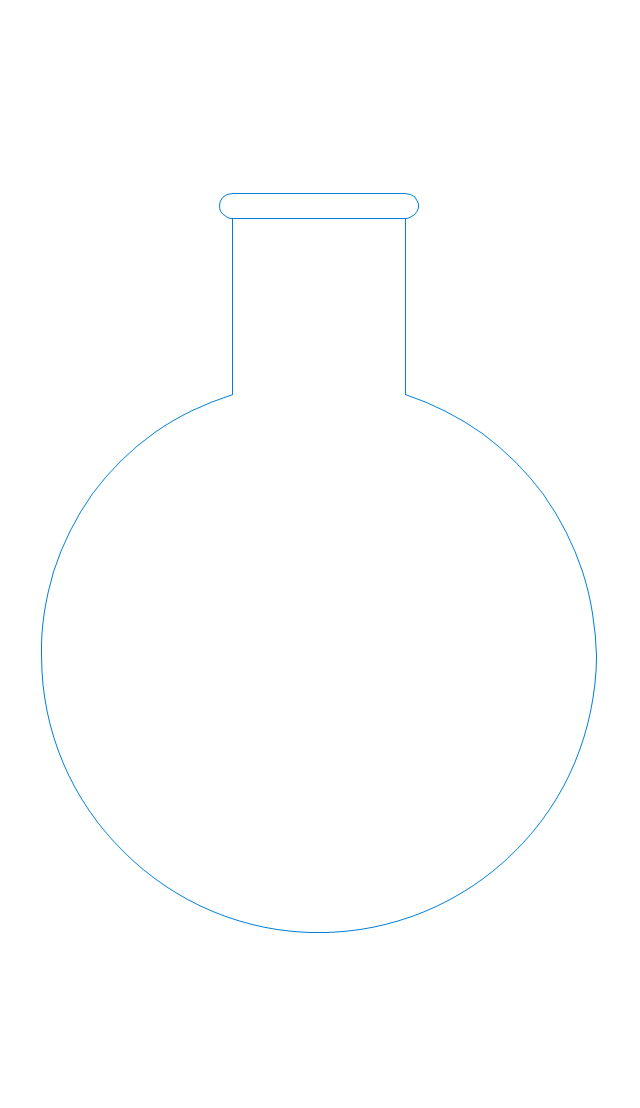
Round-bottom flask, 250ml
Beaker 100ml, filled
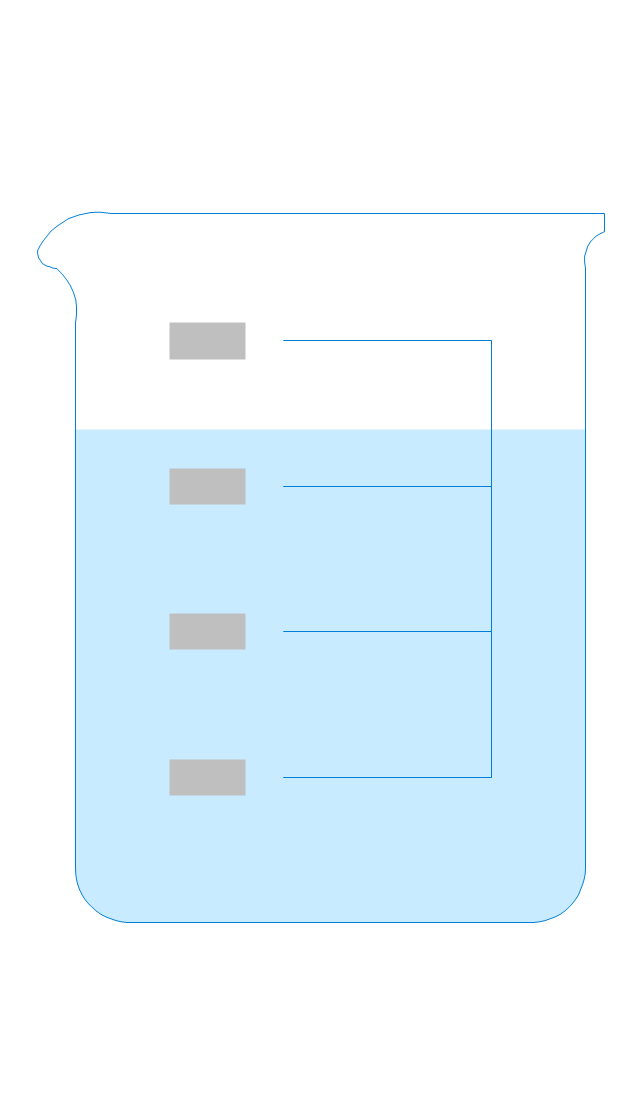
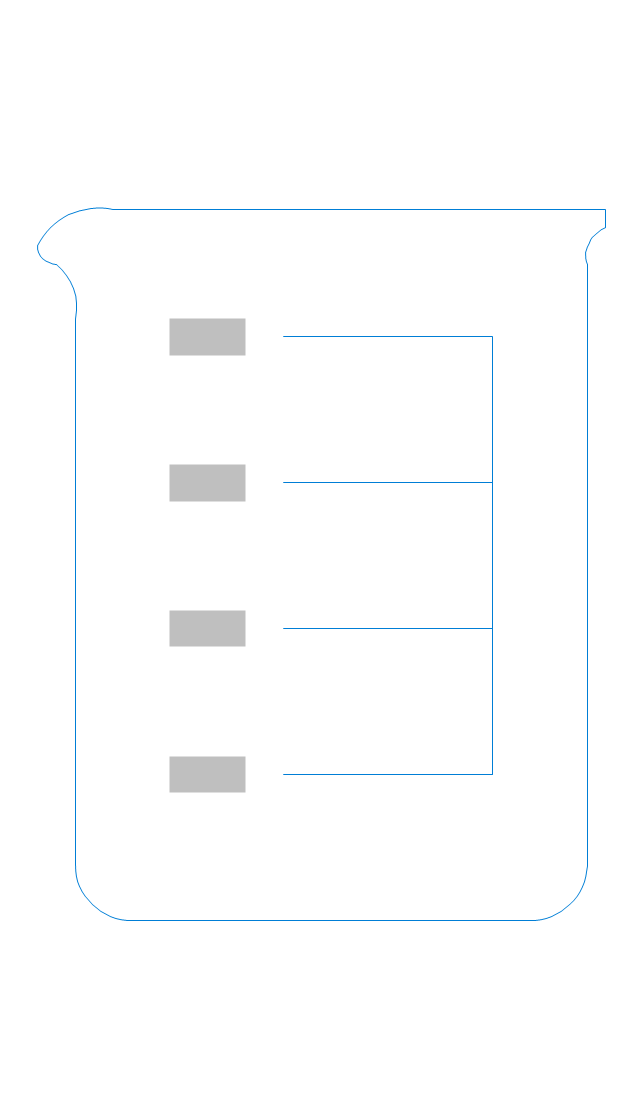
Beaker 100ml, empty
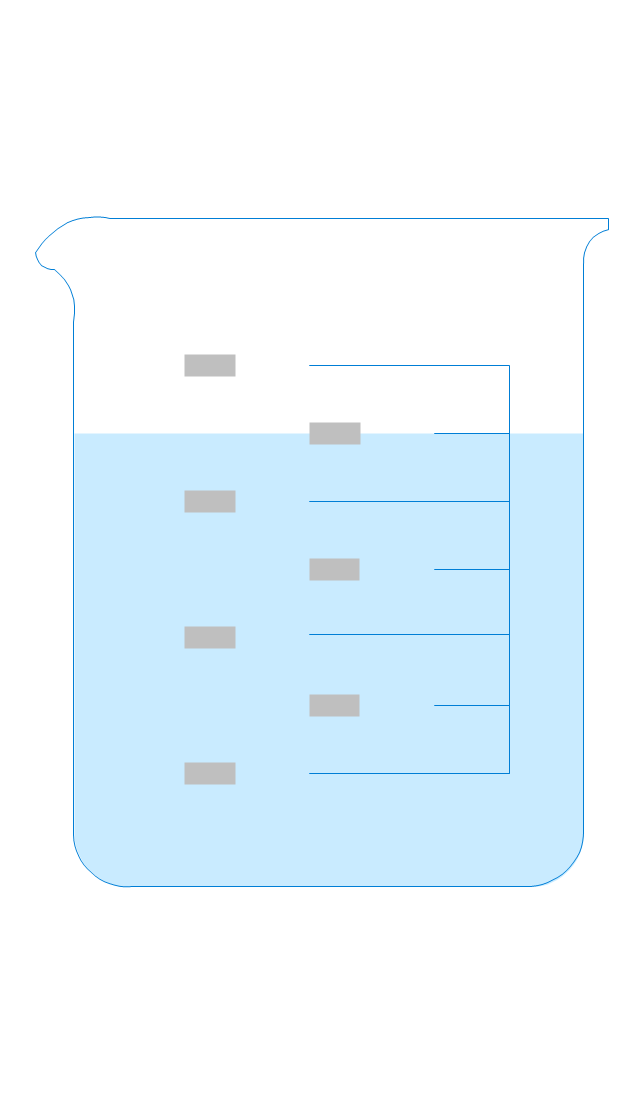
Beaker 500ml, filled
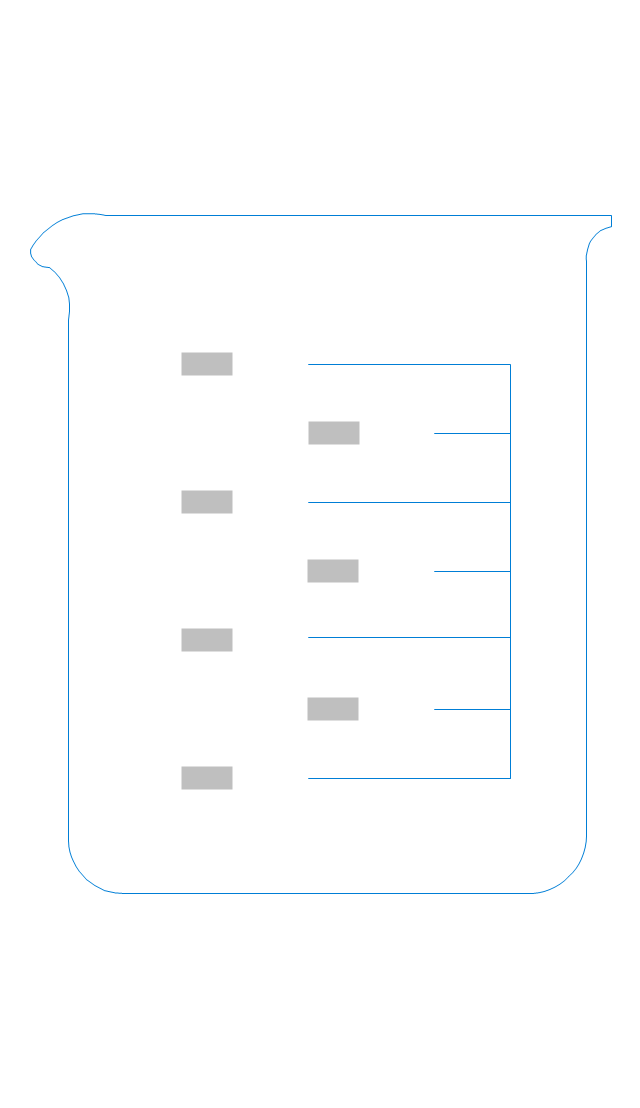
Beaker 500ml, empty
Erlenmeyer flask 250ml, filled
Erlenmeyer flask 250ml, empty
 Event-driven Process Chain Diagrams
Event-driven Process Chain (EPC) Diagram is a type of flowchart widely used for modeling in business engineering and reengineering, business process improvement, and analysis. EPC method was developed within the Architecture of Integrated Information Systems (ARIS) framework.
 Physics
Physics solution extends ConceptDraw PRO software with templates, samples and libraries of vector stencils for drawing the physical illustrations, diagrams and charts.
 Stakeholder Onion Diagrams
The Stakeholder Onion Diagram is often used as a way to view the relationships of stakeholders to a project goal. A basic Onion Diagram contains a rich information. It shows significance of stakeholders that will have has influence to the success achieve
 Line Graphs
How to draw a Line Graph with ease? The Line Graphs solution extends the capabilities of ConceptDraw PRO v10 with professionally designed templates, samples, and a library of vector stencils for drawing perfect Line Graphs.
 Landscape & Garden
The Landscape and Gardens solution for ConceptDraw PRO v10 is the ideal drawing tool when creating landscape plans. Any gardener wondering how to design a garden can find the most effective way with Landscape and Gardens solution.
 Business Intelligence Dashboard
Business Intelligence Dashboard solution extends the ConceptDraw PRO v11 functionality with exclusive tools, numerous ready-to-use vector objects, samples and quick-start templates for creation professional Business Intelligence Dashboards, Business Intelligence Graphics, Business Intelligence Charts and Maps of different kinds. Design easy the BI dashboard, BI model or Dynamic chart in ConceptDraw PRO to monitor the company's work, to track the indicators corresponding your company's data, to display and analyze key performance indicators, to evaluate the trends and regularities of the processes occurring at the company.
 Histograms
How to make a Histogram? Making a Histogram is an incredibly easy process when it is done with ConceptDraw PRO. The Histograms Solution enhances ConceptDraw PRO v10 functionality with extensive drawing tools, numerous samples, and examples; also a quick-start template and library of ready vector stencils for visualization the data and professional drawing Histograms.
- How To Make A Schematic Diagram For A Chemistry Experiment
- Schematic Diagram Chemistry Experiment
- Apparatus Diagrams For Chemical Experiment
- Chemistry Experiments Diagram Symbols
- Chemistry Experiment Technical Illustration
- Physics Diagrams | Event-driven Process Chain Diagrams | How To ...
- Star Network Topology | Physics Diagrams | Schematic Diagram Of ...
- Schematic Diagram Of A Chemistry Lab
- Schematic Diagram Of Lab Apparatus
- Chemistry Experiment Diagram Symbols
- Chemistry Drawings | Physics Diagrams | Chemistry Drawing ...
- How to Draw a Chemical Process Flow Diagram
- Chemistry Lab Experiment And Uses With Diagram
- How to Draw a Chemical Process Flow Diagram
- Schematic Diagram Symbol For Chemistry
- Diagrams Of Chemical Apparatus
- Chemical Circuit Diagram
- Diagram Of All Laboratory Apparatus
- Process Flowchart | Mathematical Diagrams | Chemistry Equation ...
- Schematic Diagram In Chemistry