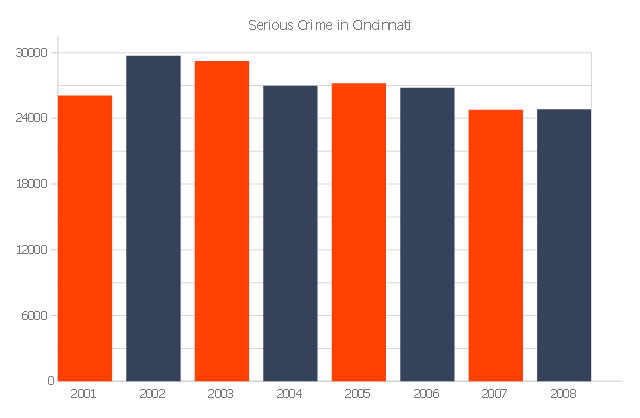
The vertical bar graph sample shows the serious crime number in Cincinnati from 2001 to 2008. It was designed on the base of the Commons Wikimedia file: Cincinnati-Part-1-Crimes.jpg.
[commons.wikimedia.org/ wiki/ File:Cincinnati-Part-1-Crimes.jpg]
"Before the riot of 2001, Cincinnati's overall crime rate was dropping dramatically and had reached its lowest point since 1992. After the riot violent crime increased. Reflecting national trends, crime rates in Cincinnati have dropped in all categories from 2006 to 2010." [Crime in Cincinnati. Wikipedia]
The column chart example "Serious crime in Cincinnati" was created using the ConceptDraw PRO diagramming and vector drawing software extended with the Bar Graphs solution from the Graphs and Charts area of ConceptDraw Solution Park.
Column Chart Examples
Column chart examples from ConceptDraw collection can help you find the best visual depiction for you data. You can easily modify column chart examples according to data you want to visualize.How to Create a Column Chart
The question how to create a column chart have a simple answer. Use ConceptDraw tips to find out how to create a column chart depicts your data the best way.Column Chart Template
Column chart templates from ConceptDraw collection can help you find the best visual depiction for you data. You can easily modify column chart templates according to data you want to visualize.Chart Examples
Easy charting software comes with beautiful chart templates and examples. This makes it easy to create professional charts without prior experience.Chart Templates
Easy charting software comes with beautiful chart templates and examples. This makes it easy to create professional charts without prior experience.Vertical Cross Functional Flowchart
ConceptDraw PRO is a powerful tool that helps you create professional looking cross-functional flowcharts with the well-designed objects. ConceptDraw PRO - Drawing Software for Vertical Cross Functional Flowchart. ConceptDraw allows you to focus on work, not the drawing process. ConceptDraw Arrows10 Technology allows to draw connectors with smart behavior that gives flexibility to you during work process.
 Bar Graphs
The Bar Graphs solution enhances ConceptDraw PRO v10 functionality with templates, numerous professional-looking samples, and a library of vector stencils for drawing different types of Bar Graphs, such as Simple Bar Graph, Double Bar Graph, Divided Bar Graph, Horizontal Bar Graph, Vertical Bar Graph, and Column Bar Chart.
Business Structure
Each business is created, exists and develops according to its type of business structure. Creating new business or developing existing, you may need a powerful software for representing its business structure. In this case ConceptDraw PRO diagramming and vector drawing software extended with 25 Typical Orgcharts solution from the Management area is exactly what you need.How to Create a Bar Chart
The answer how to create a bar chart can be found in ConceptDraw software. The simple tips guide you through the software to quickly learn how to create a bar chart.Network Security
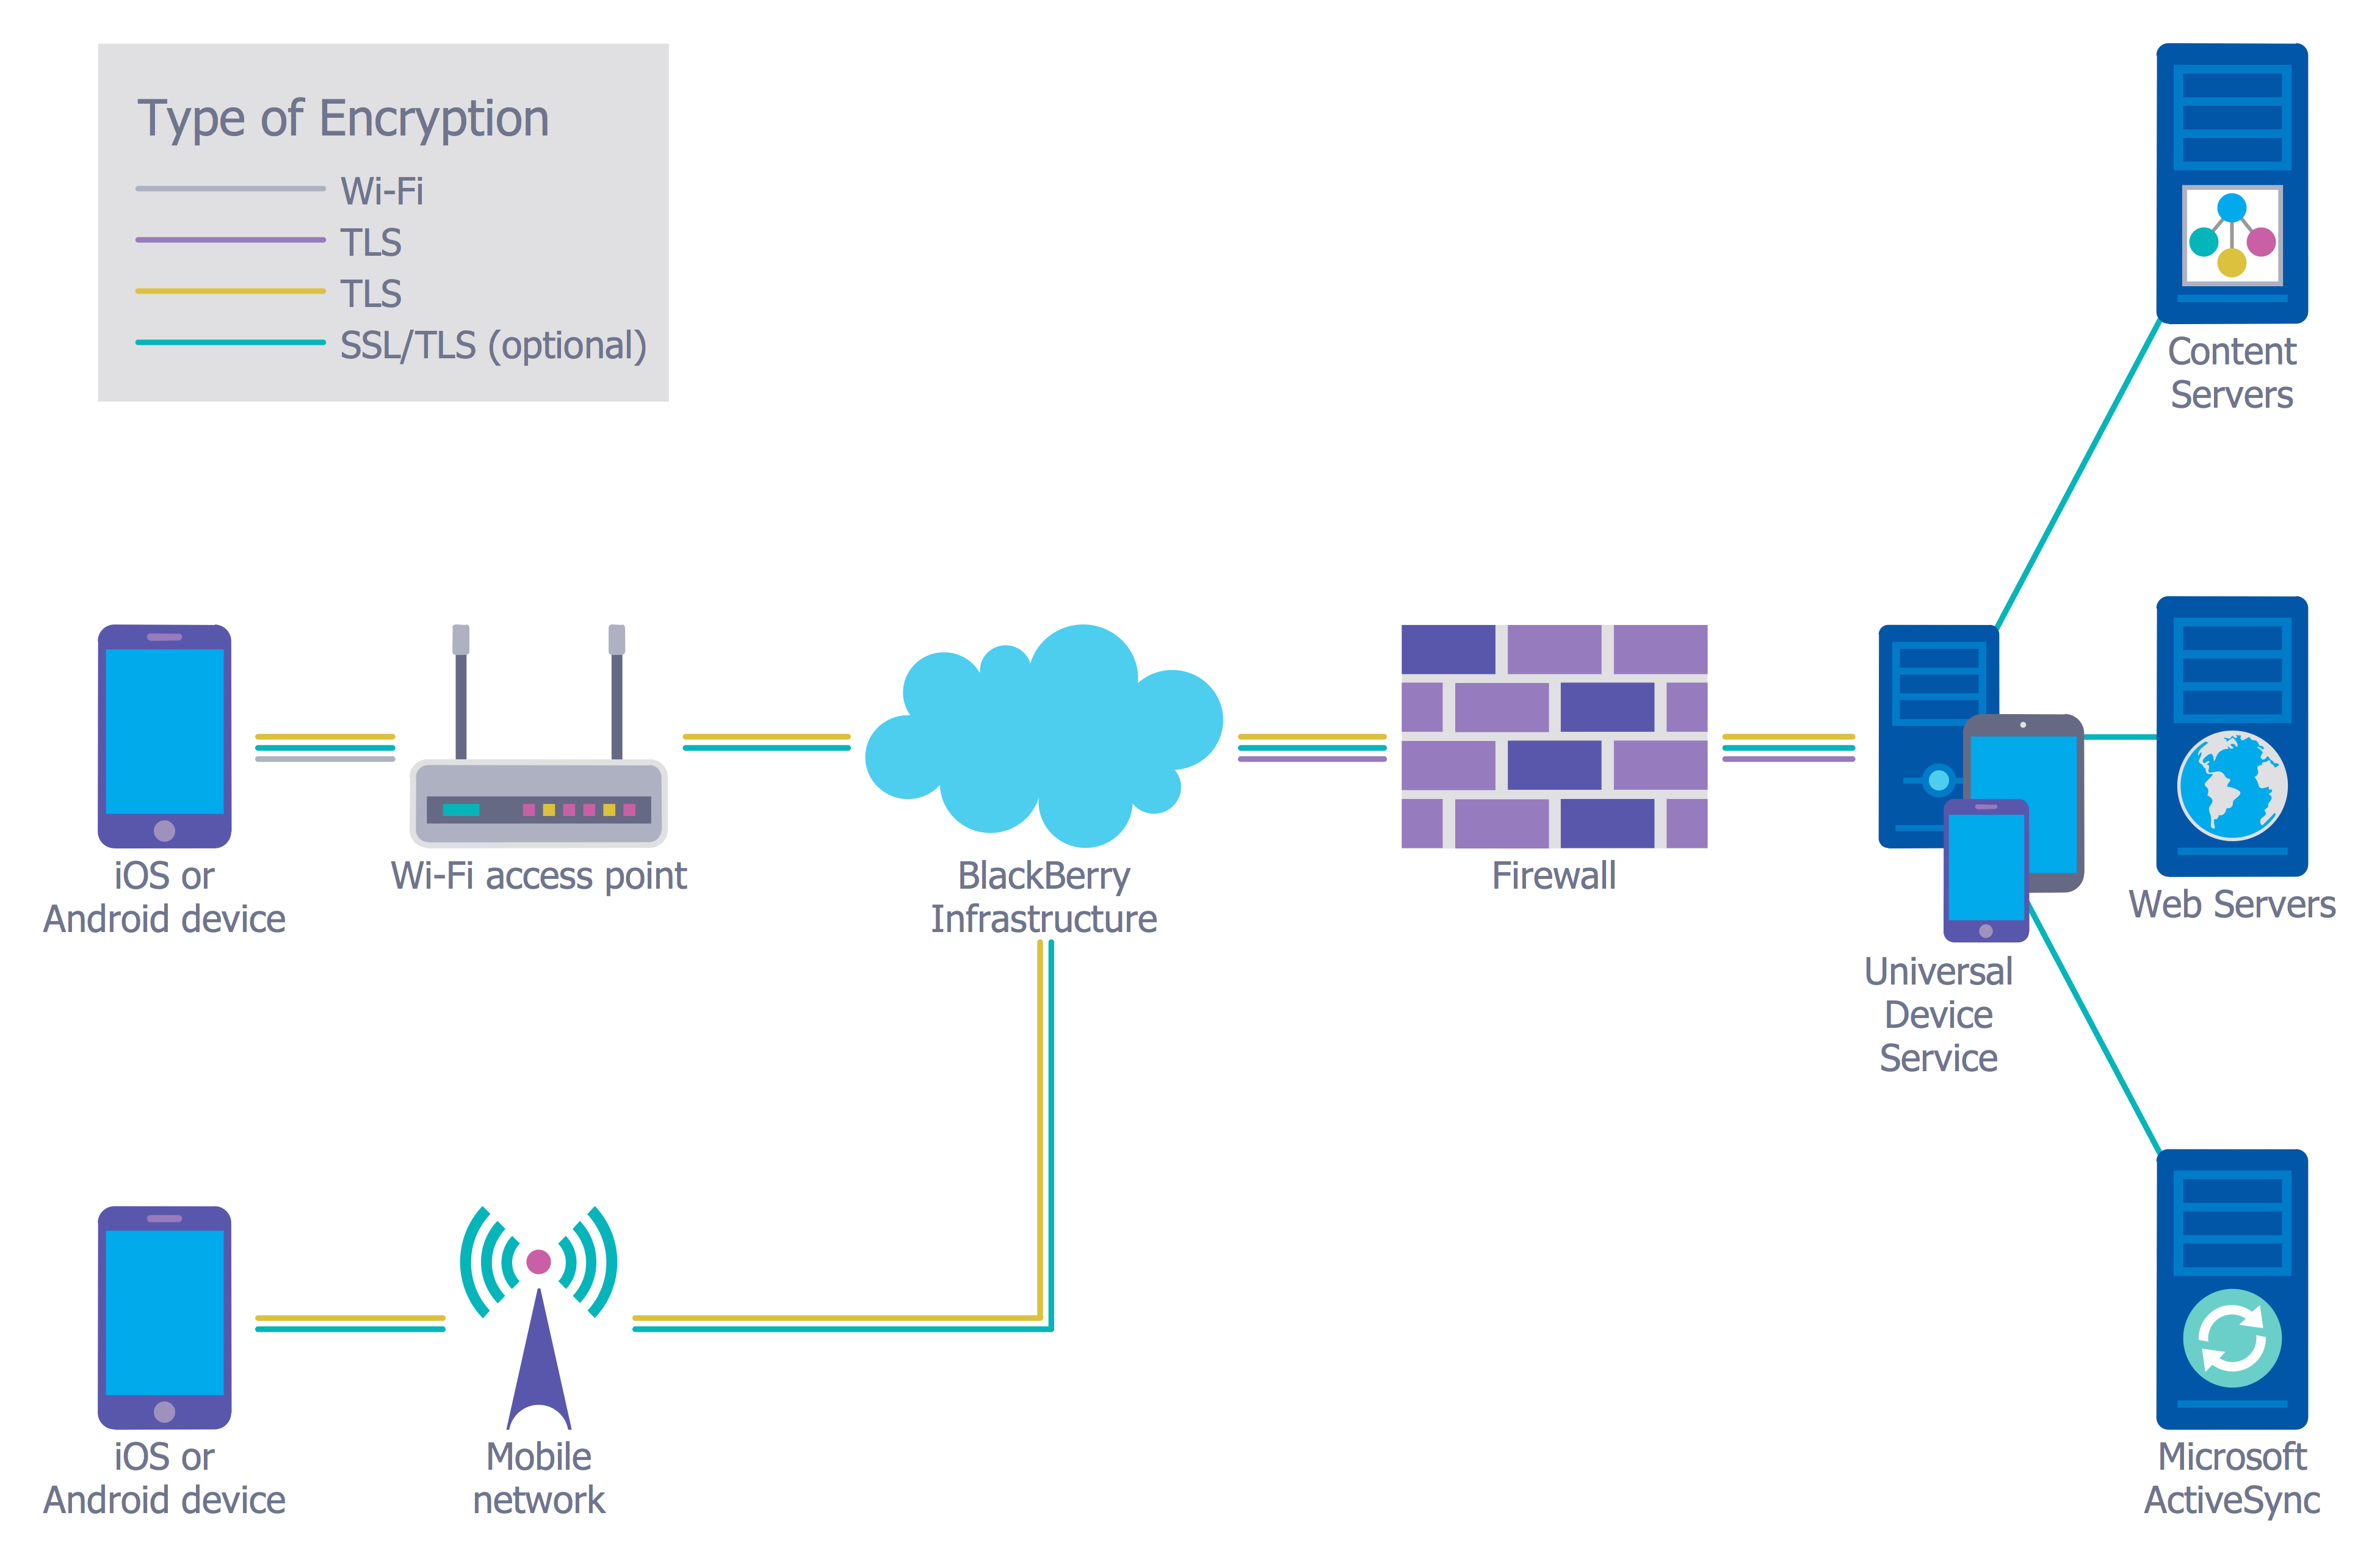
The Internet is a giant computer network which connects computers all over the world. It is integral part of human society and business. But the serious question for network engineers, designers, lawmakers and enforcers is the need for protect the Internet networks from the Internet crimes, hacking and attacks. There are quite a number of hardware, software and physical methods of protection against them. The samples you see on this page were created in ConceptDraw PRO using the tools of Network Security Diagrams Solution for ConceptDraw PRO software. They show protection networks with Firewalls and other network security devices.Network Diagram Software ISG Network Diagram
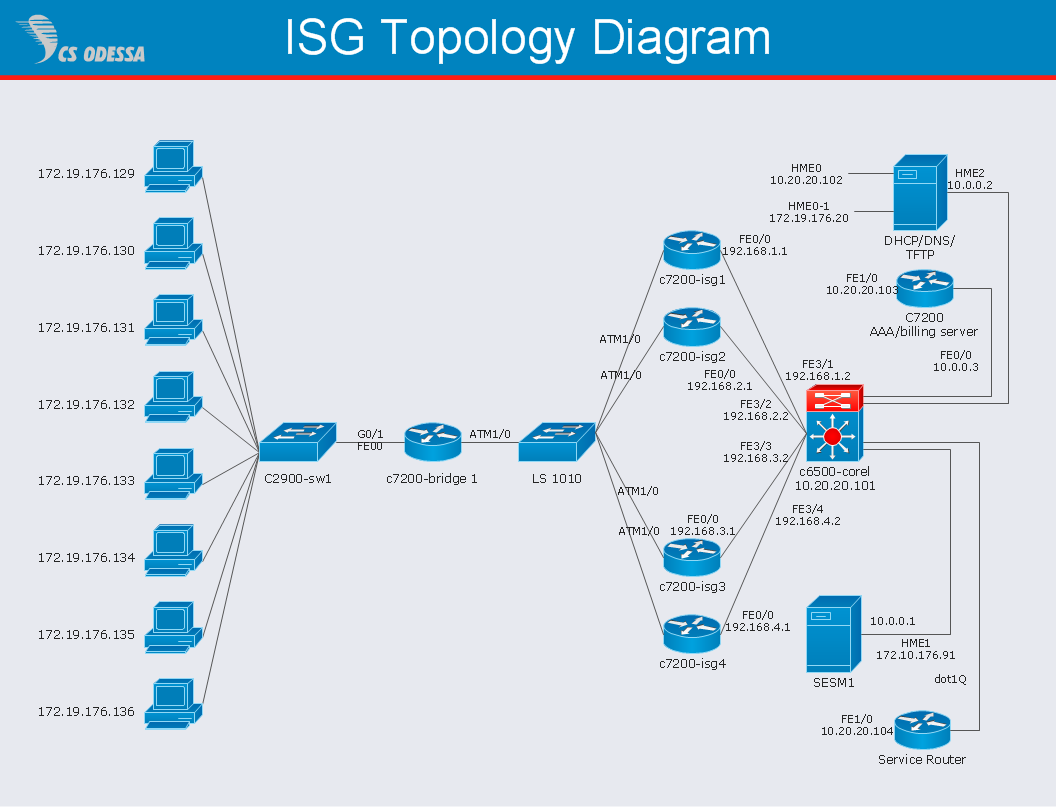
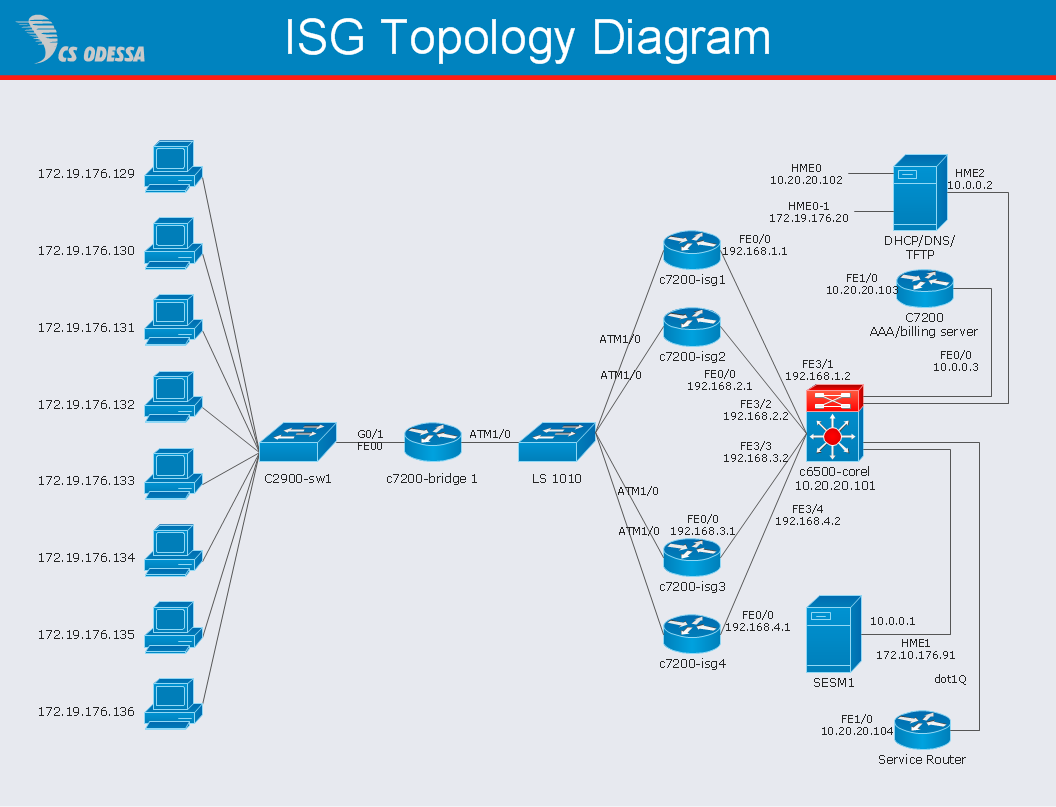
Drawing ISG Network Diagram using ConceptDraw PRO stencils
This example was drawn on the base of the floor plan from the website of the School of Criminal Justice at Rutgers University. [crimeprevention.rutgers.edu/ crime/ emp_ theft/ warehouses/ quiz2.htm]
"Preventing Theft from Warehouses.
The biggest threat to warehouses is collusion between two dishonest people - one inside the warehouse who is employed by you, and another person outside. Your warehouse is vulnerable in different ways at each step of the handling of merchandise. Below, we've broken this process down into three major steps: receiving, storage, and shipping." [crimeprevention.rutgers.edu/ crime/ emp_ theft/ warehouses/ warehouses.htm]
"Storage.
The trucks have been unloaded and everything put away on the shelves in the warehouse. Now your merchandise is even more vulnerable to thieves than before.
There are two main elements of a good security plan:
1) Keep people out of areas where they don't belong...
2) Keep track of what goods are supposed to be in your warehouse" [crimeprevention.rutgers.edu/ crime/ emp_ theft/ warehouses/ storage/ storage.htm]
The floor plan example "Warehouse security quiz" was created using the ConceptDraw PRO diagramming and vector drawing software extended with the Plant Layout Plans solution from the Building Plans area of ConceptDraw Solution Park.
Chen ERD Diagram
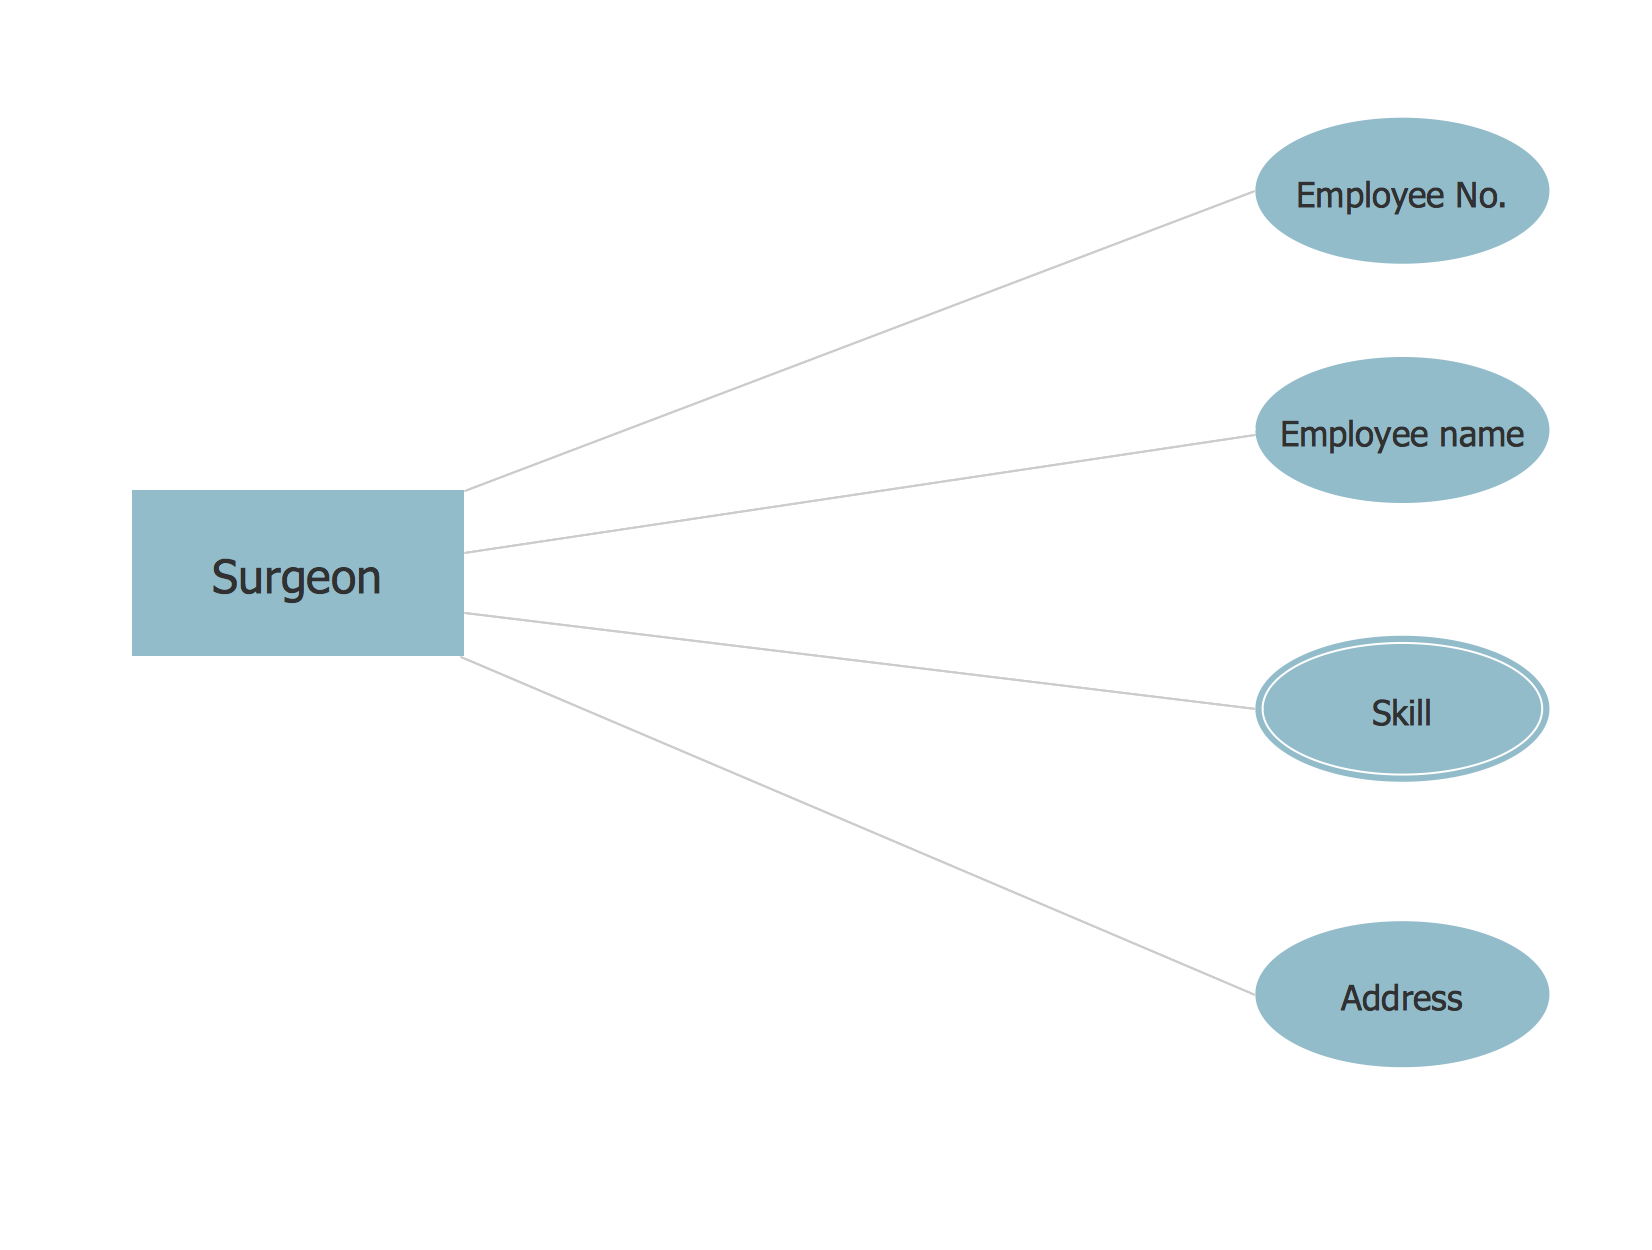
The vector stencils library Chen ERD from the solution Entity-Relationship Diagrams (ERD) contains specific symbols of the Chen ERD notation including entity symbols and relationship symbols for ConceptDraw PRO diagramming and vector drawing software. The Entity-Relationship Diagrams (ERD) solution is contained in the Software Development area of ConceptDraw Solution Park.- Chart Maker for Presentations | Serious crime in Cincinnati | Column ...
- Serious crime in Cincinnati | Bar Graphs | Column Chart Examples ...
- Bar Graphs | Serious crime in Cincinnati | Column Chart Examples ...
- Bar graph - Serious Crime in Cincinnati | How to Create a Column ...
- Bar Graph | Serious crime in Cincinnati | Bar Diagrams for Problem ...
- Serious crime in Cincinnati | Warehouse security quiz | How to ...
- Outstanding trends of wastewater treatment plants | Line Graph ...
- Chart Examples | Chart Templates | Flow Chart On Crime Rate
- Bar Graphs | Column Chart Examples | Bar Graphs | Diagrams And ...
- Chart Examples | Chart Templates | Recent Bar Graph On Crime ...
- Bar Diagrams for Problem Solving. Create manufacturing and ...
- Bar Graphs | Chart Examples | Column Chart Examples | Crime In ...
- Bar Graphs | Column Chart Template | Chart Examples | Design Bar ...
- Bar Graphs | Column Chart Software | Column Chart Examples ...
- Column Chart Examples | How to Create a Column Chart | Business ...
- Bar Graphs | Sales Growth. Bar Graphs Example | Bar Graph | Bar ...
- Bar Graphs | Sales Growth. Bar Graphs Example | Bar Graph | Why ...
- Bar Chart Examples
- Column Chart Examples | Business diagrams & Org Charts with ...
