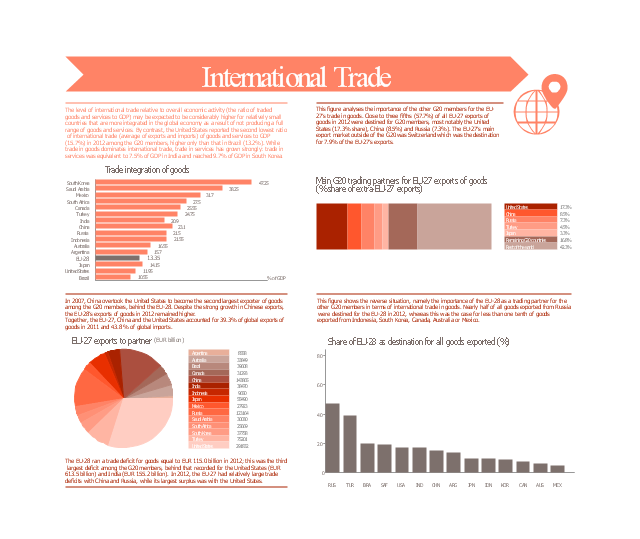
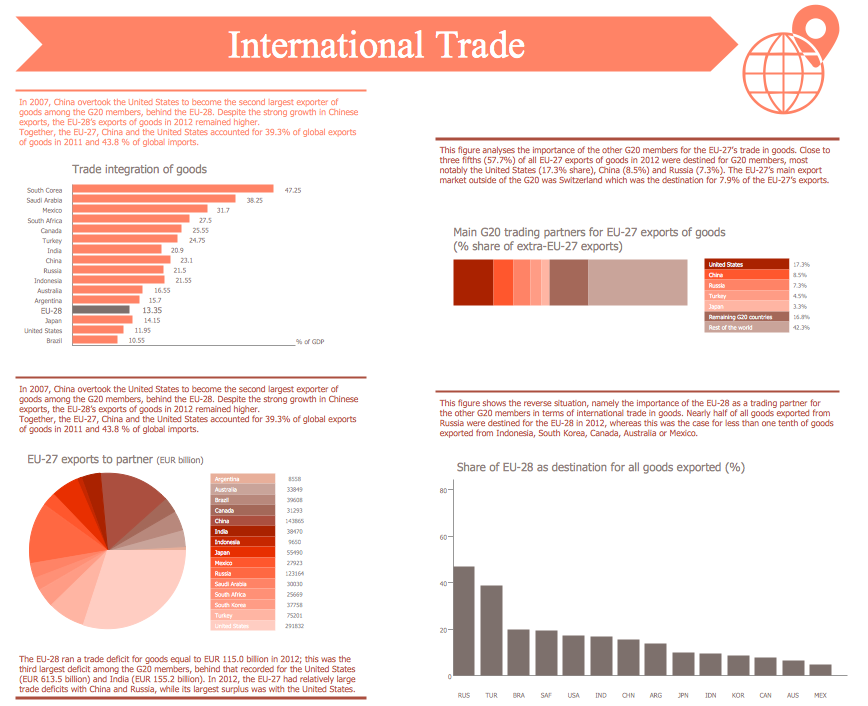
This marketing infogram example was created on the base of data of "The EU in the world 2014. A statistical portrai" from the website of the Eurostat - the statistical office of the European Union situated in Luxembourg.
"In 2007, China overtook the United States to become the second largest exporter of goods among the G20 members, behind the EU-28. Despite the strong growth in Chinese exports, the EU-28’s exports of goods in 2012 remained higher.
Together, the EU-27, China and the United States accounted for 39.3% of global exports of goods in 2011 and 43.8 % of global imports."
[epp.eurostat.ec.europa.eu/ cache/ ITY_ OFFPUB/ KS-EX-14-001/ EN/ KS-EX-14-001-EN.PDF]
The marketing infographic example "International trade statistics - EU in comparison with the Group of Twenty" was created using the ConceptDraw PRO diagramming and vector drawing software extended with the Marketing Infographics solition from the area "Business Infographics" in ConceptDraw Solution Park.
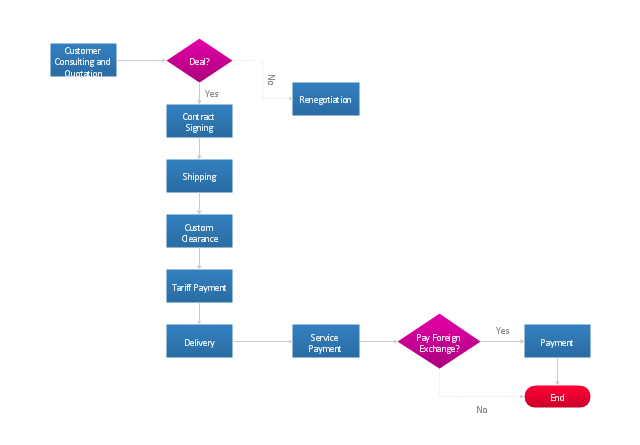
"An import is a good brought into a jurisdiction, especially across a national border, from an external source. The purchaser of the exotic good is called an importer. An import in the receiving country is an export from the sending country. Importation and exportation are the defining financial transactions of international trade.
In international trade, the importation and exportation of goods are limited by import quotas and mandates from the customs authority. The importing and exporting jurisdictions may impose a tariff (tax) on the goods. In addition, the importation and exportation of goods are subject to trade agreements between the importing and exporting jurisdictions." [Import. Wikipedia]
The flow chart example "Import process" was created using the ConceptDraw PRO diagramming and vector drawing software extended with the Flowcharts solution from the area "What is a Diagram" of ConceptDraw Solution Park.
Marketing Infographics
Marketing Infographics is a very popular tool that allows to represent the complex data, knowledge, and other marketing information in a simple, visual and attractive graphical form. But how to draw Marketing Infographics simply and quickly? ConceptDraw PRO diagramming and vector drawing software extended with unique Marketing Infographics Solution from the Business Infographics Area will help you design marketing infographics without efforts. This toolset included in ConceptDraw Office for small business project management, creating presentations using marketing infographics is critical part project management reporting software.Content Marketing Infographics
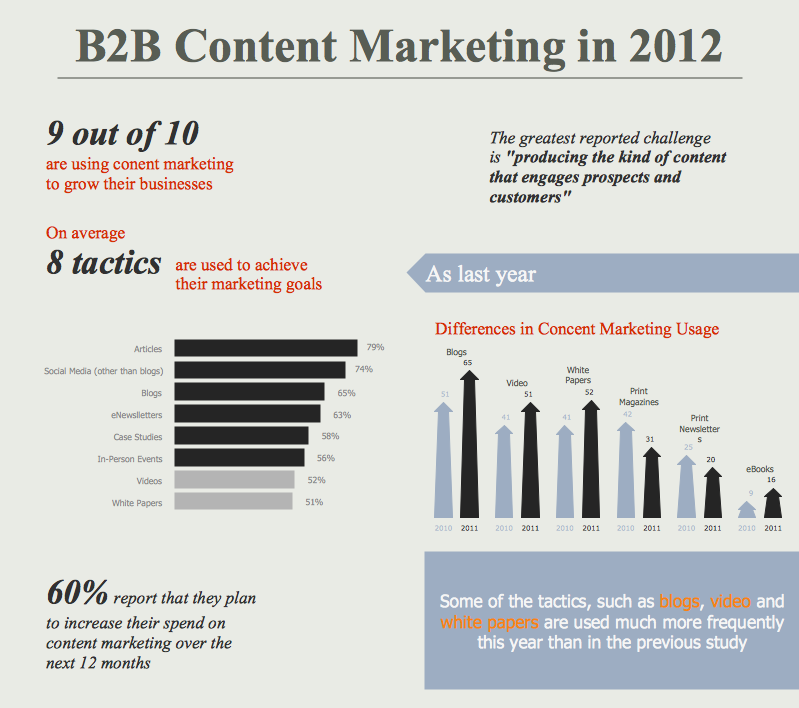
The popularity of visual content marketing grows day by day. So now simple and convenient designing of professional looking Content Marketing Infographics becomes increasingly actual. For achievement this goal ConceptDraw PRO software offers the Marketing Infographics Solution from the Business Infographics Area.- Import process - Flowchart | Flow Chart Of International Trade
- Foreign trade - Onion diagram | Target Diagram | Target and ...
- Diagram International Trade Process
- Trading process diagram - Deployment flowchart | Settlement ...
- Financial Trade UML Use Case Diagram Example | Settlement ...
- Deployment flowchart - Trading process diagram | Flowchart - Import ...
- Trading process diagram - Deployment flowchart | Financial Trade ...
- Import process - Flowchart | How to Import Project Data From MS ...
- Trading process diagram - Deployment flowchart | Flow Chart ...
- Import List Flowchart
- Import process - Flowchart | Flowchart Software | Process Flow Chart ...
- Trading process diagram - Deployment flowchart | Target Diagram ...
- Import process - Flowchart | Basic Flowchart Symbols and Meaning ...
- Import process - Flowchart | Flowchart Software | How to Build a ...
- Import process - Flowchart | Flowchart Software | Process Flow Chart ...
- Import process - Flowchart | Process Flow Diagrams | Flow chart ...
- Flowchart Software | Import process - Flowchart | Basic ...
- Create Flowchart | Flowchart Software | Basic Flowchart Symbols ...
- Flowchart - Import process | Basic Diagramming | Flowchart Software
- Bar Diagrams for Problem Solving. Create business management ...


