Process Flowchart
ConceptDraw is Professional business process mapping software for making process flow diagram, workflow diagram, general flowcharts and technical illustrations for business documents. It is includes rich examples, templates, process flowchart symbols. ConceptDraw flowchart maker allows you to easier create a process flowchart. Use a variety of drawing tools, smart connectors, flowchart symbols and shape libraries to create flowcharts of complex processes, process flow diagrams, procedures and information exchange.Data Flow Diagram Model
The DFD (Yourdon and Coad notation) example "Model of small traditional production enterprise" below was created using the ConceptDraw PRO diagramming and vector drawing software extended with the Data Flow Diagrams solution from the Software Development area of ConceptDraw Solution Park.Swim Lane Diagrams
Swim Lane diagrams are the variety of process flow diagrams and are based on the IDEF3 standard. They were developed by Lynn Shostack for usage in projecting. With their help organization diagrams are combined with process flow, as they visually display an object of the production system which is charged with given concrete processes in general flow of processes of the production system."Causes in the diagram are often categorized, such as to the 6 M's ...
The 6 Ms (used in manufacturing industry):
(1) Machine (technology);
(2) Method (process);
(3) Material (Includes Raw Material, Consumables and Information.);
(4) Man Power (physical work)/ Mind Power (brain work): Kaizens, Suggestions;
(5) Measurement (Inspection);
(6) Milieu/ Mother Nature (Environment).
The original 6Ms used by the Toyota Production System have been expanded by some to include the following and are referred to as the 8Ms. However, this is not globally recognized. It has been suggested to return to the roots of the tools and to keep the teaching simple while recognizing the original intent; most programs do not address the 8Ms.
(7) Management/ Money Power;
(8) Maintenance." [Ishikawa diagram. Wikipedia]
This 8Ms Ishikawa diagram (manufacturing cause and effect diagram) template is included in the Fishbone Diagram solution from the Management area of ConceptDraw Solution Park.
Types of Flowcharts
A Flowchart is a graphically representation of the process, algorithm or the step-by-step solution of the problem. There are ten types of Flowcharts. Using the Flowcharts solution from the Diagrams area of ConceptDraw Solution Park you can easy and quickly design the Flowchart of any of these types.Basic Flowchart Symbols and Meaning
Flowchart Symbols and Meaning - Provides a visual representation of basic flowchart symbols and their proposed use in professional workflow diagram, standard process flow diagram and communicating the structure of a well-developed web site, as well as their correlation in developing on-line instructional projects. See flowchart's symbols by specifics of process flow diagram symbols and workflow diagram symbols.Work Flow Process Chart
Workflow Diagram - workflow process diagram is a visual representation of a organizational process flow. Often it used as the same visual notation as process flow diagram. Visualising business processes using workflow diagram (workflow process diagram) allows estimate business process efficiency, analyse and optimize the process itself. Workflow diagram helps get focusing on each step and relations between workflow steps. ConceptDraw PRO is software for making workflow diagram. It contains specific designed graphics to draw workflow diagrams effectively. This is workflow diagram maker which do your work process effective.Flowchart Components
The ConceptDraw Flowchart component includes a set of samples and templates. This geathered as flowchart maker toolbox which focused on drawing flowcharts of any industry standards.
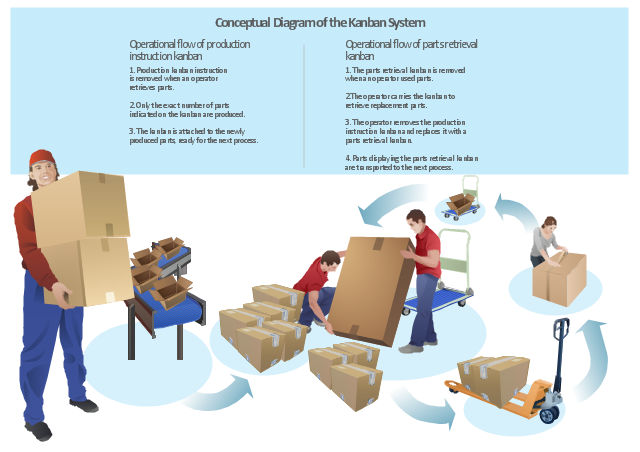
"Kanban ... (literally signboard or billboard) is a scheduling system for lean and just-in-time (JIT) production. Kanban is a system to control the logistical chain from a production point of view, and is not an inventory control system. Kanban was developed by Taiichi Ohno, at Toyota, to find a system to improve and maintain a high level of production. Kanban is one method through which JIT is achieved.
Kanban became an effective tool in support of running a production system as a whole, and it proved to be an excellent way for promoting improvement. Problem areas were highlighted by reducing the number of kanban in circulation." [Kanban. Wikipedia]
The example "Conceptual diagram of the Kanban System" was created in the ConceptDraw PRO diagramming and vector drawing software using the vector stencils library Packaging, loading, customs.
The example "Conceptual diagram of the Kanban System" is included in the Manufacturing and Maintenance solution from the Illustration area of ConceptDraw Solution Park.
Diagramming Software for Design UML Collaboration Diagrams
ConceptDraw helps you to start designing your own UML Collaboration Diagrams with examples and templates.Total Quality Management Value
The Total Quality Management Diagram solution helps you and your organization visualize business and industrial processes. Create Total Quality Management diagrams for business process with ConceptDraw software.Data Flow Diagram Examples
You need to draw the Data Flow Diagram? Use ConceptDraw PRO diagramming and vector drawing software extended with Data Flow Diagrams solution from the Software Development area of ConceptDraw Solution Park.The Data Flow Diagrams solution provides a numerous collection of Data Flow Diagram examples created according to Gane and Sarson, and Yourdon and Coad notations using the ConceptDraw PRO software.Example of DFD for Online Store (Data Flow Diagram) DFD Example
Data flow diagrams (DFDs) reveal relationships among and between the various components in a program or system. DFDs are an important technique for modeling a system’s high-level detail by showing how input data is transformed to output results through a sequence of functional transformations.Example of DFD for Online Store shows the Data Flow Diagram for online store and interactions between the Visitors, Customers and Sellers, as well as Website Information and User databases.
Influence Diagram
This sample shows the Influence Diagram. It was created in ConceptDraw PRO diagramming and vector drawing software using the Basic Diagramming Solution from the Universal Diagramming area of ConceptDraw Solution Park.Influence diagram represents the directed acyclic graph with three types of nodes and three types of arcs that connect the nodes. Decision node is drawn as a rectangle, Uncertainty node is drawn as an oval, Value node is drawn as an octagon.
IDEF0 Diagram
The vector stencils library IDEF0 Diagram from the solution IDEF0 Diagrams contains specific IDEF0 diagram symbols such as arrow symbols and entity symbols for ConceptDraw PRO diagramming and vector drawing software. The IDEF0 Diagram solution is contained in the Software Development area of ConceptDraw Solution Park.- Simple Diagram Of Production System
- Production System Flowchart
- Production System Model Flow Diagram
- Schematic Diagram Of Production System
- Explain The Schematic Production System
- Schematic Diagram Of Production System Sample
- Prosess Of Production System Flow Chart
- Using Schematic Diagram In Production Management
- Production System Chart
- Explain Production System Model With Diagram Example
- Diagram Of Production System
- Block Diagram Of Various Production System
- Production System Diagram
- Production System In Industrial Diagram
- Draw Schematics Of Production System
- Schematic Production System
- Block Diagram Of Production System
- Production System Model With Diagram
- Production System Model And Diagram
- Schematic Production System Diagram
- ERD | Entity Relationship Diagrams, ERD Software for Mac and Win
- Flowchart | Basic Flowchart Symbols and Meaning
- Flowchart | Flowchart Design - Symbols, Shapes, Stencils and Icons
- Flowchart | Flow Chart Symbols
- Electrical | Electrical Drawing - Wiring and Circuits Schematics
- Flowchart | Common Flowchart Symbols