The Best Drawing Program for Mac

Chart Examples

Best Multi-Platform Diagram Software

Visual Presentations Made Easy with Diagramming Software


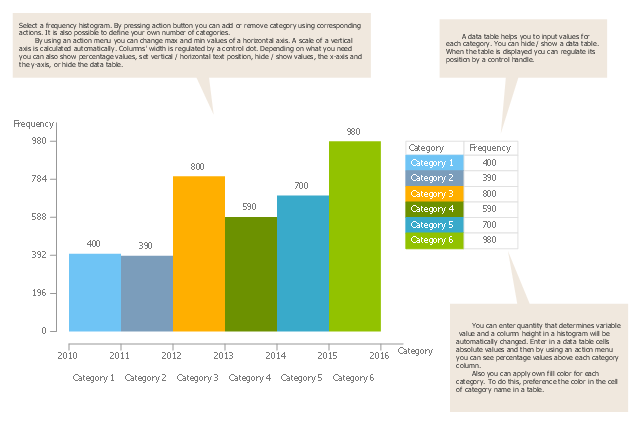
Use this template to design your histograms.
"In probability and statistics, a probability distribution assigns a probability to each measurable subset of the possible outcomes of a random experiment, survey, or procedure of statistical inference. Examples are found in experiments whose sample space is non-numerical, where the distribution would be a categorical distribution; experiments whose sample space is encoded by discrete random variables, where the distribution can be specified by a probability mass function; and experiments with sample spaces encoded by continuous random variables, where the distribution can be specified by a probability density function. More complex experiments, such as those involving stochastic processes defined in continuous time, may demand the use of more general probability measures." [Probability distribution. Wikipedia]
The diagram template "Histogram" for the ConceptDraw PRO diagramming and vector drawing software is included in the Histograms solution from the Graphs and Charts area of ConceptDraw Solution Park.
Template
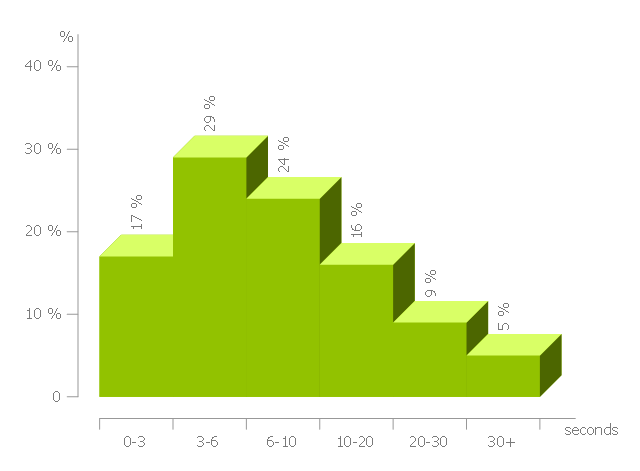
This histogram sample shows the frequency distribution of web page load time.
"Web performance optimization, WPO, or website optimization is the field of knowledge about increasing the speed in which web pages are downloaded and displayed on the user's web browser. ...
With the average internet speed now increasing globally, it's fitting for website administrators and "webmasters" to consider the time it takes for websites to render for the visitor.
Faster website download speeds have been shown to increase visitor retention and loyalty and user satisfaction, especially for users with slow internet connections and those on mobile devices. Web performance also leads to less data travelling across the web, which in turn lowers a website's power consumption and environmental impact. Some aspects which can affect the speed of page load include Browser/ Server Cache, Image Optimization and also encryption (for example SSL), which can affect the time it takes for pages to render." [Web performance optimization. Wikipedia]
The histogram example "Page load time" was created using the ConceptDraw PRO diagramming and vector drawing software extended with the Histograms solution from the Graphs and Charts area of ConceptDraw Solution Park.
Histogram
Basic Diagramming


Simple Diagramming

Basic Diagramming

Best Program to Make Diagrams

The Best Flowchart Software Available

The Best Mac Software for Diagramming or Drawing

Basic Diagramming

Basic Diagramming

Pie Chart Software

Pyramid Diagram

Line Graph Charting Software

Bar Chart Software

Column Chart Software

- Histogram template | Frequency histogram - Page load time | Chart ...
- Best Multi-Platform Diagram Software | The Best Drawing Program ...
- Visual Presentations Made Easy with Diagramming Software ...
- Histograms | Chart Examples | Bar Chart Examples |
- The Best Drawing Program for Mac | Best Software to Draw ...
- The Best Drawing Program for Mac | Bar Chart Software | Bar Chart ...
- Line Graphs | Line Graph Charting Software | Line graph template |
- The Best Drawing Program for Mac | Bar Chart Software | Column ...
- Best Multi-Platform Diagram Software | The Best Drawing Program ...
- Projects HR dashboard | Frequency Distribution Dashboard |
- The Best Drawing Program for Mac | Best Diagramming Software for ...
- TQM Diagram Tool | Marketing Diagrams | Sales KPI Dashboards |
- Network Visualization with ConceptDraw PRO | Marketing Diagrams ...
- Create Graphs and Charts | Line Graph Charting Software | Marketing |
- Divided bar diagram template
- Step chart template | Basic Diagramming | The Best Drawing ...
- Basic Diagramming | Line Chart Examples | Chart Examples |
- Basic Diagramming | Best Diagramming Software for Mac | Bubble ...
- Pie Chart Examples | Pie Chart Software | Basic Diagramming |
- Chart Examples | Pie Chart Examples | Line Chart Examples |