How To Draw an iPhone?
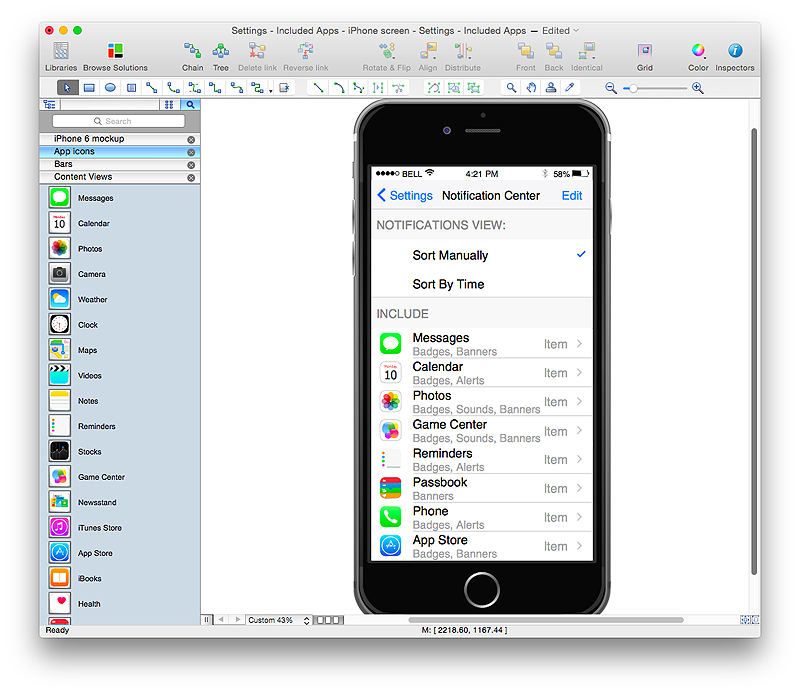
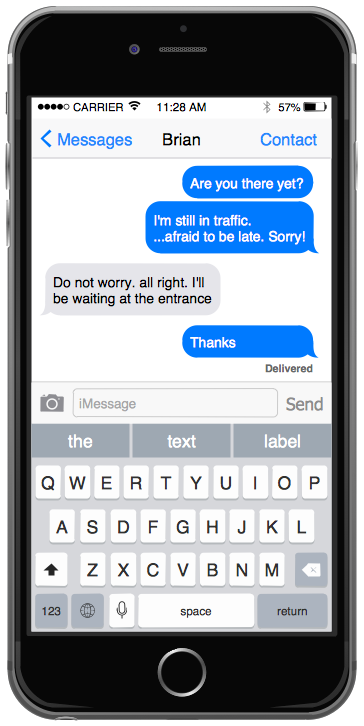
How To Draw an iPhone? It's very fast and easy to draw an iPhone and design iPhone user interface using the tools of ConceptDraw PRO extended with iPhone User Interface Solution. iPhone User Interface Solution offers you the incredibly large quantity of predesigned objects that are grouped to 9 libraries: Apps Icons, Bars, Content Views, Controls, iMessage, iPhone 6 Mockup, Tab Bar Icons, Temporary Views, Toolbar and Navigation Bar Buttons.HelpDesk
How to Design an Interface Mock-up of an Android Application
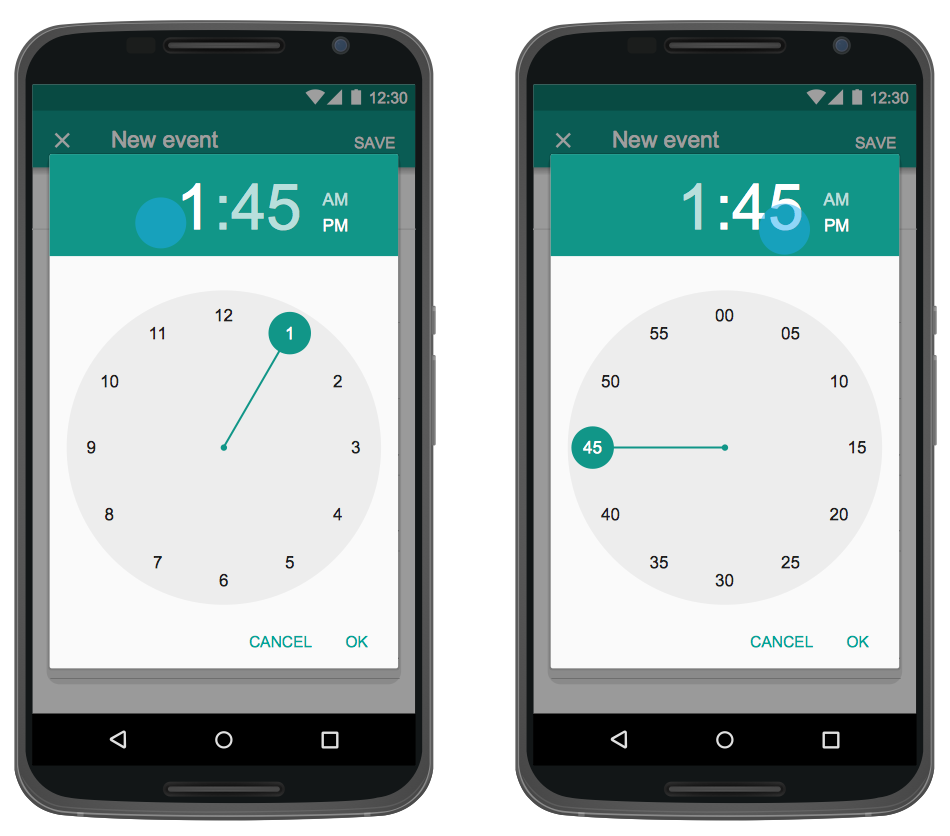
Uses Interface prototyping is much convenient when you can work through a diagram similar to the device design. ConceptDraw PRO allows you to develop Android User Interface (UI) prototypes using the special templates and vector libraries of the specific user interface elements. Using ConceptDraw PRO you can mock-up an Android UI system so that you can figure out how best to represent user interface (UI) elements for the development of a new mobile Apps.HelpDesk
How to Design a Mockup of Windows 10 User Interface
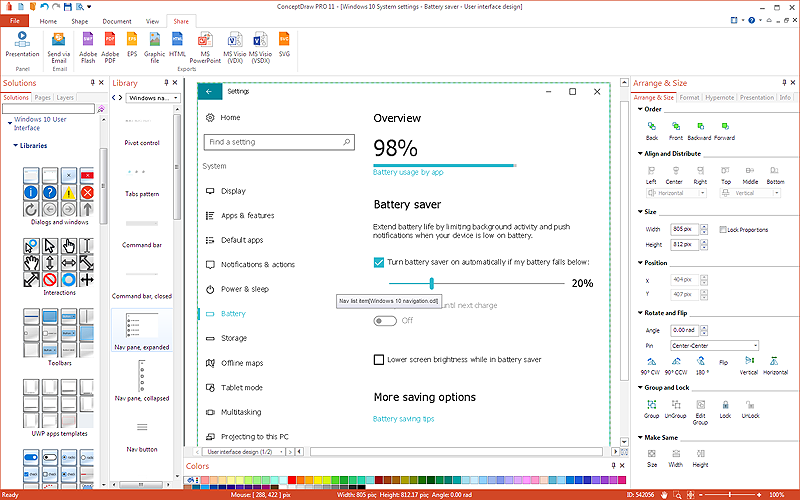
The launch of Windows 10 with its the tile-based Modern UI design brings a lot of new opportunities for both designers and developers to build new apps. To design an effective user interface, graphic designers will create visual Graphic User Interface (GUI) prototypes, that focus on maximizing the user experience — searching for the most functional layout that attends to core user needs, while retaining an appropriate aesthetic. It is important to know how the user will interact with the UI, and how functionality and appearance will change, depending on the features being used at any one time. The Modern UI design style has its own unique principles and typography that can be managed using ConceptDraw PRO. The ability to design Windows 10 User Interface is delivered by the Windows 10 User Interface solution for Conceptdraw PRO.HelpDesk
How to Design an Interface Mockup for iPhone Application in ConceptDraw PRO
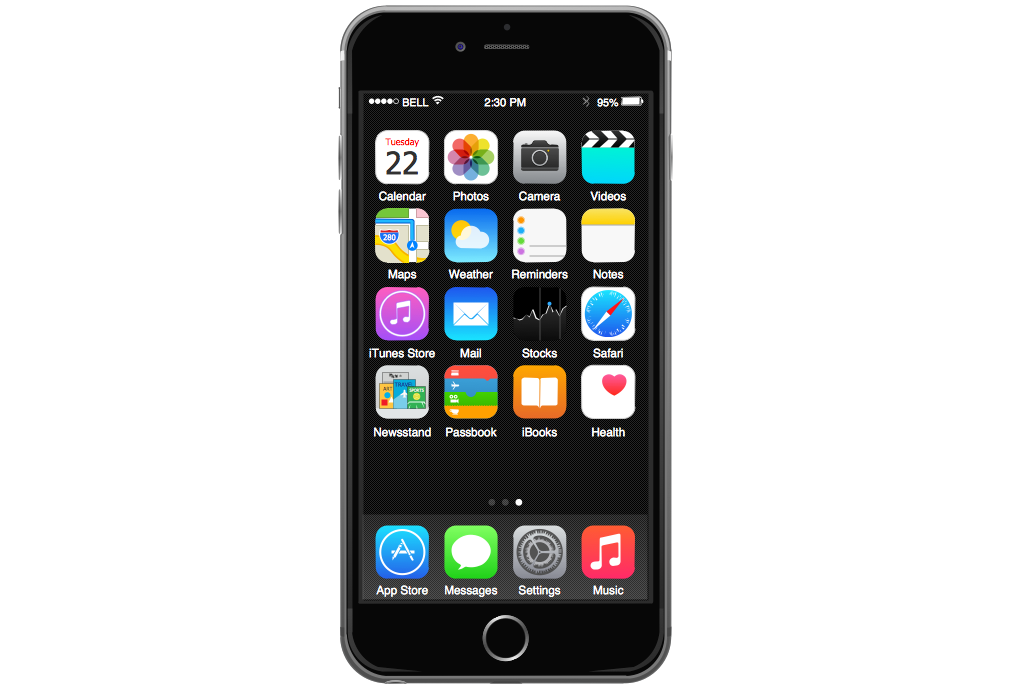
The Apple iPhone user interface has become something of a standard for smartphones, and mobile devices in general. A well designed user interface (UI) is very important for user-friendly navigation and best correlation with operating system logic. Development of successful iPhone App UI requires a planning and prototyping stage. An iPhone UI diagram can be employed to give a general view of the device's screen, upon which elements can be placed and re-arranged as necessary. Using ConceptDraw PRO you can mock-up an iPhone UI system so that you can figure out how best to represent user interface (UI) elements for the development of a new iPhone App.This template contains iPhone home screen with app icons.
Use it to design iPhone software applications user interface sketches, mockups and prototypes.
The template "iOS 8 / iPhone 6 home screen" for the ConceptDraw PRO diagramming and vector drawing software is included in the iPhone User Interface solution from the Software Development area of ConceptDraw Solution Park.
HelpDesk
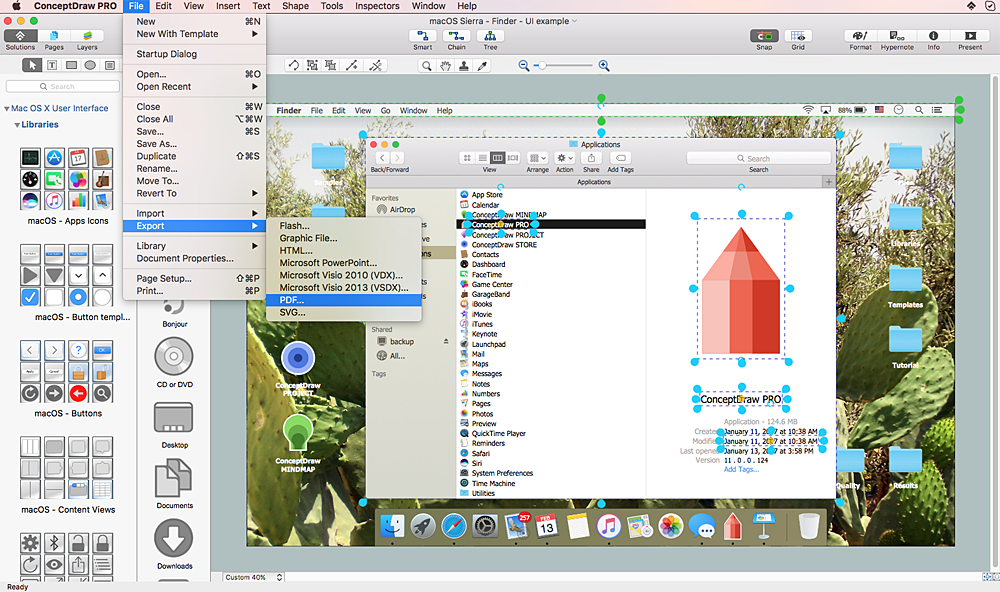
How to Design a Mockup of Apple macOS Sierra GUI
Since that first Macintosh, Apple have always developed and used their own hardware specific operating system. The fundamental style and layout of the Mac OS X user interface has remained largely in place since the earliest versions, but there have been obvious aesthetic enhancements, and elements of icon redesign to match branding across devices. To design an effective user interface, graphic designers will create visual GUI prototypes, that focus on maximizing the user experience. Uses Interface prototyping is much convenient when you can work through a diagram similar to the OS X design. ConceptDraw PRO allows you to develop Apple OS X User Interface (UI) prototypes using the special templates and vector libraries of the specific user interface elements. ConceptDraw Mac OS X UI solution offers libraries containing the distinct Mac app icons, menu bar graphics, glyph elements and other Mac OS X features — everything necessary to create high standard, professional UI graphic desigHow To Create Restaurant Floor Plan in Minutes
Developing Floor Plans, Design Drawings, Plans of Furniture Placement for restaurants and cafes is one of the most responsible and important steps at their construction and designing. Selection of favorable design, the right style of furniture and decors largely determine the success and atmosphere of the institution. The restaurant floor planner ConceptDraw PRO is a perfect choice for architects and designers. Enhanced with Cafe and Restaurant Floor Plans solution it offers a lot of extensive vector symbol libraries and building plan elements for drawing Restaurant floor plans, Restaurant layouts, Restaurant furniture layouts, Cafe floor plans, Bar area floor plan, Fast food restaurant plan, etc. With ConceptDraw PRO you don't need to be an artist to create great-looking restaurant floor plan drawings in minutes, all needed drawing tools are delivered by Building Plans area solutions. Construct your own general plan of restaurant's premises, choose the furniture for your taste from the Cafe and Restaurant Floor Plans solution libraries and arrange it on the plan as you desire fast and easy. ConceptDraw PRO has many of the features found in Visio for Mac such as Drawing, Connection, Shape and Editing Tools.
GUI Interface
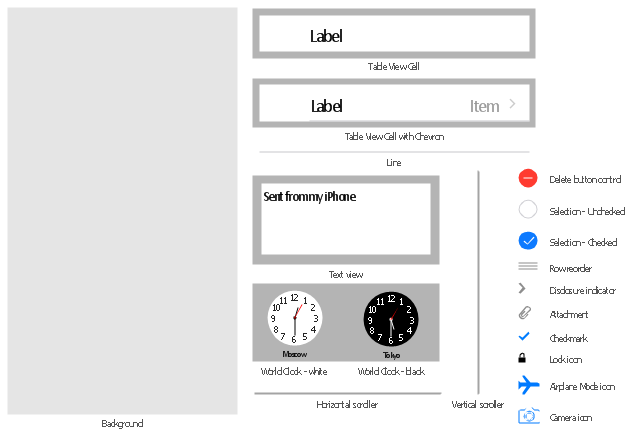
What is the ideal GUI interface? The interface of mobile device it's all that users see on it and can interact - screen, bars, icons of applications. So the interface is the first that draws the user's attention. The main goal of software engineers, GUI interface designers, and GUI developers is to make the interface first of all easy for perception and understanding, convenient and attractive for the users. The iPhone's GUI interface meets all these requirements.The vector stencils library "Content Views" contains 20 iOS apps GUI content views: table view cell, table view cell with chevron, text view, background, world clock, horizontal and vertical scrollers, delete button, icons: cheked and unchecked selections, row reorder, disclosure indicator, attachment, checkmark, lock, airplane mode, camera. Use it to draw content view elements for design of iPhone software applications user interface sketches, mockups and prototypes.
The iOS GUI views sample "Design elements - Content Views" was created using the ConceptDraw PRO diagramming and vector drawing software extended with the iPhone User Interface solution from the Software Development area of ConceptDraw Solution Park.
The iOS GUI views sample "Design elements - Content Views" was created using the ConceptDraw PRO diagramming and vector drawing software extended with the iPhone User Interface solution from the Software Development area of ConceptDraw Solution Park.
 iPhone User Interface
iPhone User Interface solution extends ConceptDraw PRO v10 software with templates, samples and libraries with large quantity of vector stencils of graphical user interface elements, Apps icons, UI patterns for designing and prototyping of the iOS applic
HelpDesk
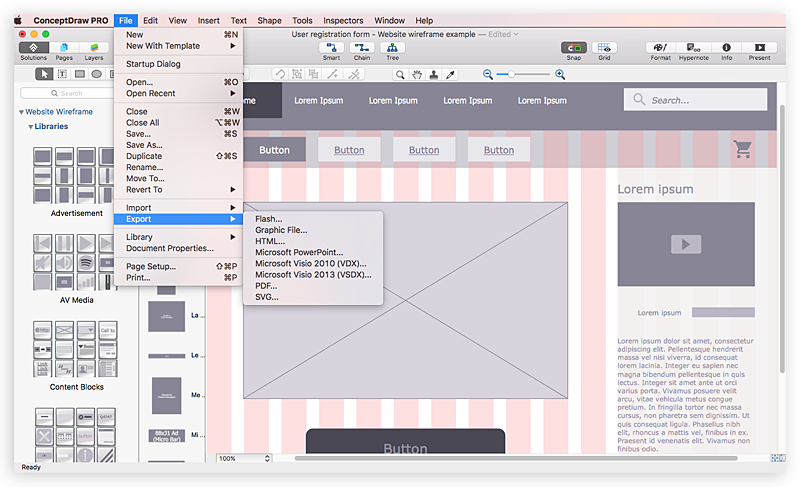
How to Develop Website Wireframes Using ConceptDraw PRO
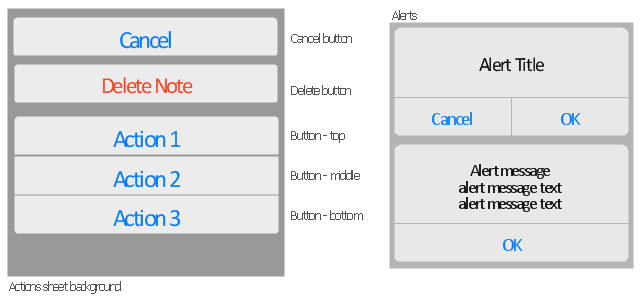
Website design is a rather complicated process. The development of a website wireframe is an important step in any screen design process. The first step of this process before coding can start, web designer creates a website wireframe — a mock-up for what will be displayed on the screen when navigating through the web site pages. A wireframe design always includes three components:Information design, navigation design and interface design. The configuration of these components depends on the business model of the website. The Website Wireframing tools provided with ConceptDraw Website Wireframe solution helps to define the information hierarchy of website design, making it easier for web-developers to plan the layout according to how a site visitor have to process the information.The vector stencils library "Temporary Views" contains 8 iOS apps GUI temporary view elements: alert two-button, alert, action sheet background, action sheet buttons, cancel button, delete button.
Use the library "Temporary Views" to add temporary view elements into your sketches, mockups and prototypes of iPhone software applications user interface.
The iOS GUI views sample "Design elements - Temporary Views" was created using the ConceptDraw PRO diagramming and vector drawing software extended with the iPhone User Interface solution from the Software Development area of ConceptDraw Solution Park.
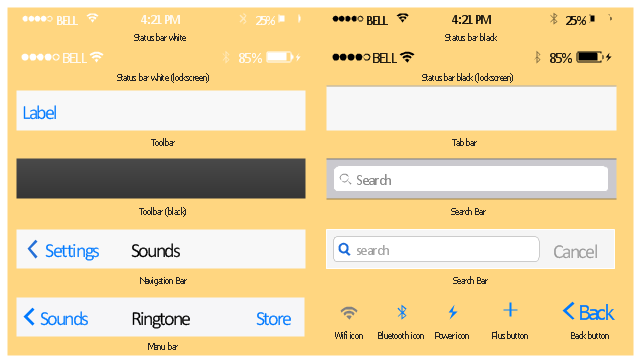
The vector stencils library "Bars" contains 16 iOS apps GUI views: menu bar, navigation bar, search bar, status bar, tab bar, toolbar, wifi icon, bluetooth icon, power icon, plus button, back button.
Use the library "Bars" to draw bar views in your design of iPhone software applications user interface sketches, mockups and prototypes.
The iOS GUI views sample "Design elements - Bars" was created using the ConceptDraw PRO diagramming and vector drawing software extended with the iPhone User Interface solution from the Software Development area of ConceptDraw Solution Park.
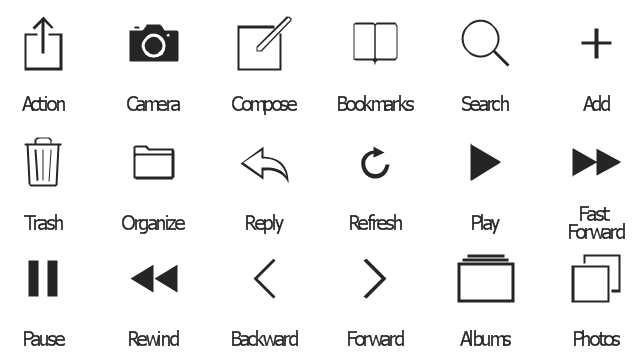
The vector stencils library "Toolbar and Navigation Bar Buttons" contains 18 iOS apps GUI view elements - toolbar and navigation bar buttons: action, camera, compose, bookmarks, search, add, trash, organize, reply, refresh, play, fast forward, pause, rewind, backward, forward, albums, photos.
Use the library "Toolbar and Navigation Bar Buttons" to draw toolbar and navigation bar elements for design of iPhone software applications user interface sketches, mockups and prototypes.
The iOS GUI view elements sample "Design elements - Toolbar and Navigation Bar Buttons" was created using the ConceptDraw PRO diagramming and vector drawing software extended with the iPhone User Interface solution from the Software Development area of ConceptDraw Solution Park.
What Is User Interface?
What is user interface (UI)? User interface of any information device includes everything designed you can interact - the screen you are looking, the icons you are clicking. ConceptDraw PRO extended with iPhone User Interface Solution is the best diagramming and vector drawing software for designing clear, pleasant and convenient user interfaces. Convenience is the most important moment for users.- How to Design an Interface Mockup for iPhone Application in ...
- Wireframe GUI - Template | How to Design an Interface Mock-up of ...
- Mac OS X User Interface | How to Design a Mockup of Apple OS X ...
- How to Design a Mockup of Windows 8 User Interface | Windows 8 ...
- How to Design a Mockup of Apple OS X UI | Graphic User Interface ...
- GUI Prototyping with ConceptDraw PRO | How to Design a Mockup ...
- iPhone User Interface | How to Design an Interface Mockup for ...
- GUI Software | Windows 8 UI Design Patterns | How to Design a ...
- How To Draw an iPhone? | How to Design an Interface Mockup for ...
- Top iPad Business Process Diagrams Apps | Process Flow app for ...
- How To Draw an iPhone? | Design elements - iPhone 6 mockup ...
- How to Design a Mockup of Apple OS X UI | Mac OS X User Interface
- How to Design a Mockup of Apple OS X UI | ConceptDraw Solution ...
- Mac OS User Interface Design Examples | How to Design a Mockup ...
- Messages - Template | App icons - Vector stencils library | Design ...
- Design elements - Apps icons | App icons - Vector stencils library ...
- How to Design a Mockup of Apple OS X UI | Mac OS X User ...
- Software and Database Design with ConceptDraw PRO | Process ...
- How to Design a Mockup of Windows 8 User Interface | User ...
- App icons - Vector stencils library | Design elements - Apps icons ...
