Project — Working With Tasks
A full-featured project management solution with all the necessary functions right at your fingertips. Generates an extensive variety of reports on project and task statuses. These videos provide a series of lessons that will enhance the understanding of all our users, from people just starting out with the software, through to expert users.Kanban Board Software: A Comprehensive Overview
Kanban Board Software is incredibly useful tool that allows a team to work effective and productive, to analyze and improve the business processes, and visualize the workflows. ConceptDraw DIAGRAM with its numerous solutions is a powerful Kanban Board Software! Draw your own professional looking Kanban Board Diagrams quick, easy and effective with useful tools of ConceptDraw DIAGRAM diagramming and vector drawing software.Project —Task Trees and Dependencies
Users new to ConceptDraw PROJECT will find the Basic lessons an essential platform for familiarizing themselves with the program′s functions. This video lesson will teach you how to set up task trees and dependencies.
 Kanban Board
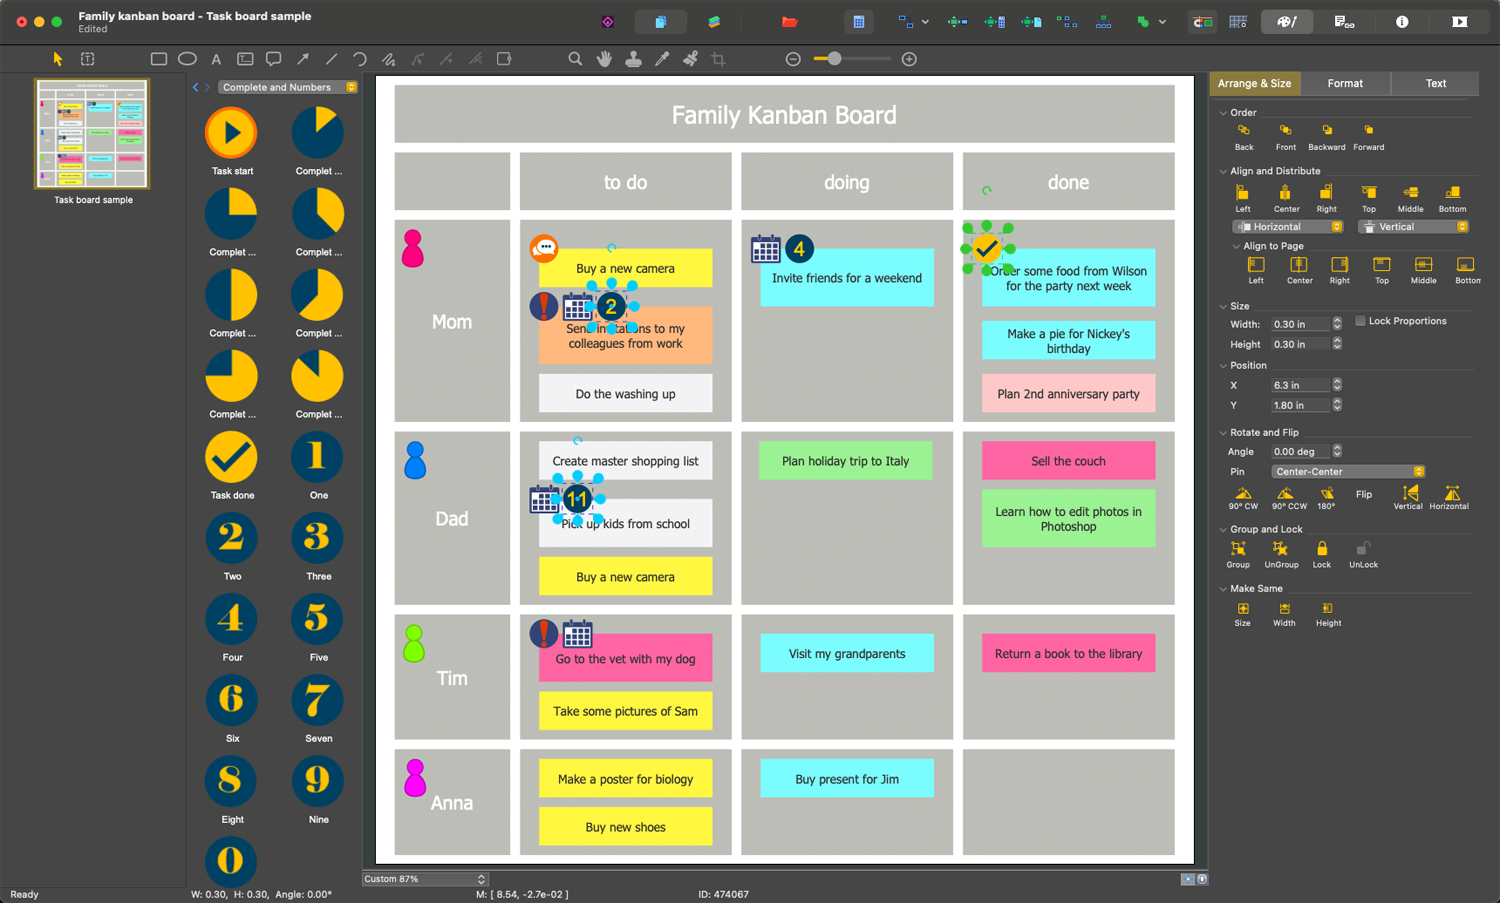
Kanban Board solution offers an effective way to build the Kanban boards in an electronic view. This solution includes a lot of Kanban Board samples and the great number of predesigned vector design objects of Task Boards, basic symbols, and icons of caution and markers, communication, complete and numbers, emoji and priorities, sticky notes, and team members. Use all advantages of the Kanban boards, Kanban board agile and ConceptDraw’s Kanban Board solution tools, start with any included Kanban Board example and improve your workflow efficiency and personal effectiveness.
Managing the task list
Four lessons explaining how to manage your task list in a Gantt chart. You will learn how to adjust your Gantt chart view, how to add/delete tasks or subtasks, how to change tasks hierarchy, how to show/hide subtasks.Critical Tasks
All project tasks are important, but only some of them are critical. A task that cannot be delayed without affecting the project end date is a critical task. In other words it is a task, which directly affects the project finish date and at the delay of its implementation the project's finish date will be postponed. Conversely, to move the project end date to an earlier date, you must reschedule the dates of tasks of critical path. During the life of a real project often happens that the critical path changes the time to time, because the tasks may be completed sooner or later than they were planned. A task stops to be critical when it is executed, since more it does not affect the execution of subsequent tasks and on the project finish date. The critical path lets easy to see the project was ended on time or not, and to determine the location of dangerous points on it. ConceptDraw Office applications and PM solutions offered by ConceptDraw Solution Park support the project managers and senior managers with perfect abilities of easy planning and managing projects, tracking the project statuses and critical tasks, with tools for creation Gantt Charts, depiction the critical path and easy generation wide range of project reports."Task management is the process of managing tasks through its life cycle. It involves planning, testing, tracking and reporting. Task management can help either individuals achieve goals, or groups of individuals collaborate and share knowledge for the accomplishment of collective goals. Tasks are also differentiated by complexity, from low to high.
Effective task management requires managing all aspects of a task, including its status, priority, time, human and financial resources assignments, recurrency, notifications and so on. These can be lumped together broadly into the basic activities of task management. ...
Task management may form part of project management and process management and can serve as the foundation for efficient workflow in an organisation. Project managers adhering to task-oriented management have a detailed and up-to-date project schedule, and are usually good at directing team members and moving the project forward. ...
Task life cycle.
The status of tasks can be described by the following states:
Ready,
Assigned,
Terminated,
Expired,
Forwarded,
Finished,
Failed." [Task management. Wikipedia]
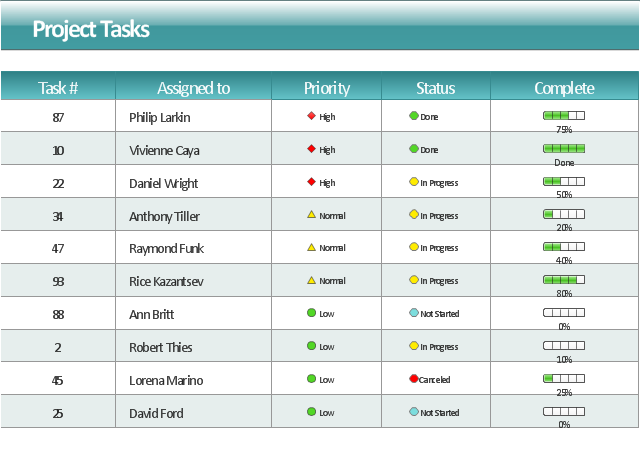
The example "Project management task status dashboard" was created using the ConceptDraw PRO diagramming and vector drawing software extended with the Status Dashboard solution from the area "What is a Dashboard" of ConceptDraw Solution Park.
ConceptDraw PROJECT Project Management Software Tool
ConceptDraw PROJECT is simple project management software. If you are on the fast track in your career and start facing such challenges as coordination many people, coordination tasks and works, manage project with a great deal of time and money involved - it is the right time to get Project management tool involved in your work.
 Project Management Area
Project Management area provides Toolbox solutions to support solving issues related to planning, tracking, milestones, events, resource usage, and other typical project management functions.
Product Overview
ConceptDraw PROJECT is a vigorous tool for managing single or multiple projects. It lets you determine all essential elements involved into project, control schedules, resources and finances, and monitor projects' progress in most effective yet simple manner.Gantt Chart Software
The Gantt Chart is the main interface in ConceptDraw PROJECT. It summarizes the tasks in your project and presents them graphically so you can easily view your progress.How to Create Gantt Chart
To begin managing a new project, you will need to define the individual Tasks that must be completed to deliver it. The default view for a new project in ConceptDraw PROJECT is the Gantt Chart."As a discipline, task management embraces several key activities. Various conceptual breakdowns exist, and these, at a high-level, always include creative, functional, project, performance and service activities.
Creative activities pertain to task creation. In context, these should allow for task planning, brainstorming, creation, elaboration, clarification, organization, reduction, targeting and preliminary prioritization.
Functional activities pertain to personnel, sales, quality or other management areas, for the ultimate purpose of ensuring production of final goods and services for delivery to customers. In context these should allow for planning, reporting, tracking, prioritizing, configuring, delegating, and managing of tasks.
Project activities pertain to planning and time and costs reporting. These can encompass multiple functional activities but are always greater and more purposeful than the sum of its parts. In context project activities should allow for project task breakdown, task allocation, inventory across projects, and concurrent access to task databases.
Service activities pertain to client and internal company services provision, including customer relationship management and knowledge management. In context these should allow for file attachment and links to tasks, document management, access rights management, inventory of client & employee records, orders & calls management, and annotating tasks.
Performance activities pertain to tracking performance and fulfillment of assigned tasks. In context these should allow for tracking by time, cost control, stakeholders and priority; charts, exportable reports, status updates, deadline adjustments, and activity logging.
Report activities pertain to the presentation of information regarding the other five activities listed, including graphical display." [Task management. Wikipedia]
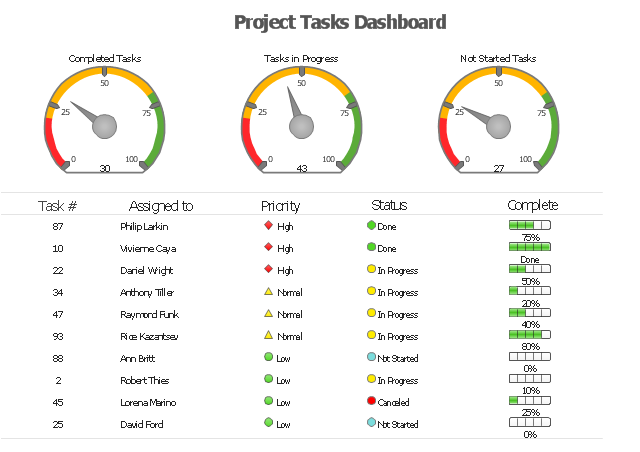
The example "Project tasks dashboard" was created using the ConceptDraw PRO diagramming and vector drawing software extended with the Status Dashboard solution from the area "What is a Dashboard" of ConceptDraw Solution Park.
How to Report Task's Execution with Gantt Chart
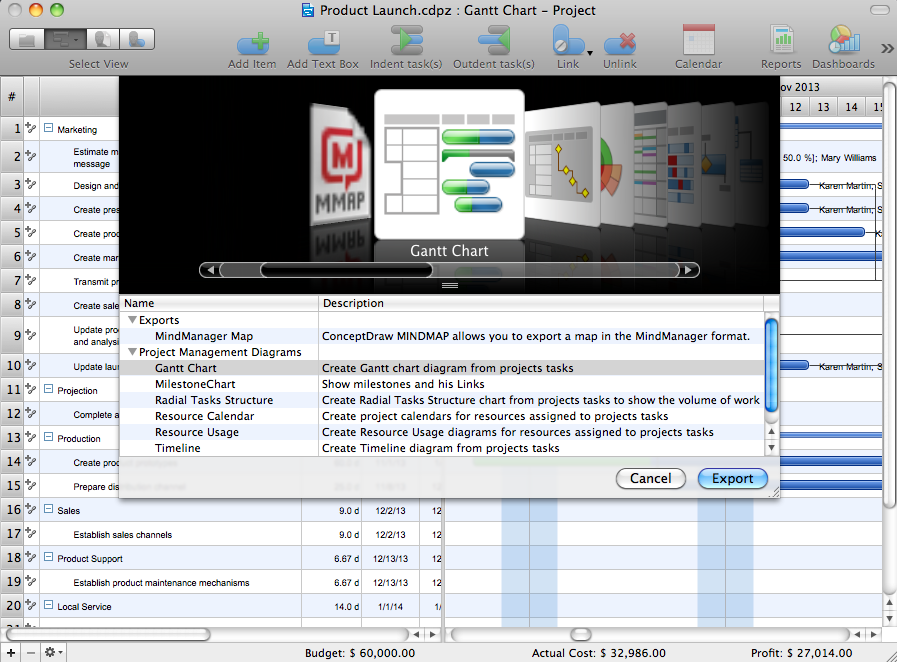
ConceptDraw PROJECT’s powerful reporting engine lets you generate a set of tabular reports with just one click, or visualize your project as Radial Tasks Structures, Work Breakdown Structures and Resource Calendars. It also provides you with dynamic Project Dashboards.All My Tasks
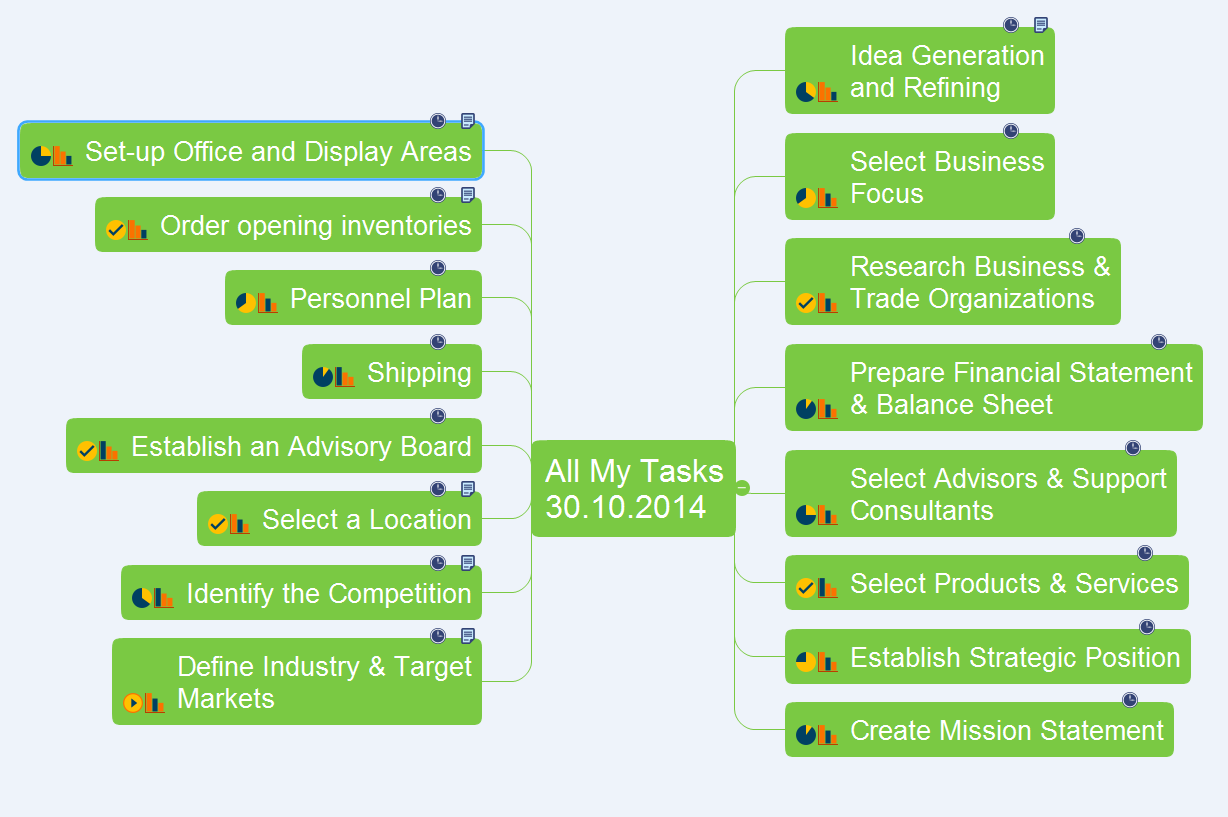
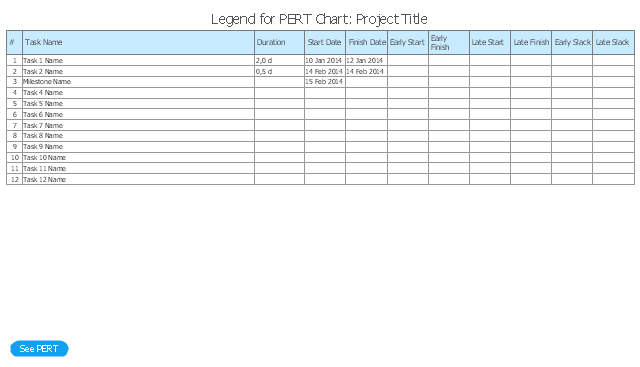
The communication's improvement fosters a positive team spirit and effective project realization. ConceptDraw MINDMAP software and ConceptDraw Solution Park supply the project participants and organizations with better tools, which assist in team's communication, in understanding tasks and time frames, project events in the entire organization. The powerful tools of ConceptDraw MINDMAP software and extensive set of solutions offered by ConceptDraw Solution Park create a single information space for messaging to teams. But for successful project's realization in addition to communication is needed to consider the list of tasks for execution. ConceptDraw MINDMAP offers all needed tools to create the list of tasks for any period of time - day, week, month, quarter, year, etc. This Mind Map designed with ConceptDraw MINDMAP software represents the list of tasks on the defined date. ConceptDraw MINDMAP offers wide visual capabilities for the maps, you can highlight the most important tasks with bright colors, add special symbols and text notes to your tasks, beautify the map with nice and colorful clipart.The PERT chart shows the logical connections and consequence of a set of tasks. PERT charts the time period for problem solving and the implementation plan for all activities along the critical path. The PERT chart is also known as a precedence diagram or project network diagram.
"The Program (or Project) Evaluation and Review Technique, commonly abbreviated PERT, is a statistical tool, used in project management, that is designed to analyze and represent the tasks involved in completing a given project. ...
PERT is a method to analyze the involved tasks in completing a given project, especially the time needed to complete each task, and to identify the minimum time needed to complete the total project.
PERT was developed primarily to simplify the planning and scheduling of large and complex projects. ...
A network diagram can be created by hand or by using diagram software. There are two types of network diagrams, activity on arrow (AOA) and activity on node (AON). Activity on node diagrams are generally easier to create and interpret." [Program Evaluation and Review Technique. Wikipedia]
The PERT chart is one of the Seven Management and Planning Tools (7 MP tools, Seven New Quality Tools).
The PERT chart template for the ConceptDraw PRO diagramming and vector drawing software is included in the solution "Seven Management and Planning Tools" from the Management area of ConceptDraw Solution Park.
- Project — Task Trees and Dependencies | Task Managing Software
- ConceptDraw PROJECT Project Management Software Tool ...
- Project — Task Trees and Dependencies | Managing the task list
- Project — Working With Tasks | Project management task status ...
- Project — Task Trees and Dependencies | Tasks Management Tool
- Project — Working With Tasks | Project Management Tasks
- Project — Working With Tasks | Task Manager Software
- Project management task status dashboard | Project — Task Trees ...
- Collaboration in a Project Team | Managing the task list

