This site uses cookies. By continuing to browse the ConceptDraw site you are agreeing to our Use of Site Cookies.

The Best Mac Software for Diagramming or Drawing

ConceptDraw DIAGRAM is a powerful intelligent vector graphics engine that can be used to create basic diagrams including flowcharts, charts, workflows, flowcharts, organizational charts, business diagram, learn business diagrams, flow diagrams.
How to draw an Organizational Chart

The Best Drawing Program for Mac

ConceptDraw DIAGRAM is the professional business graphic software for drawing diagrams and charts with great visual appeal on Mac OS X.

Basic Diagramming

ConceptDraw DIAGRAM with the specific tools you need to easily draw flowcharts, block diagrams, bar charts, histograms, pie charts, divided bar diagrams, line graphs, area charts, scatter plots, circular arrows diagrams, Venn diagrams, bubble diagrams, concept maps, electrical circuit diagrams, schematics,and others.
Use Basic Diagramming solution to draw you own diagrams, charts and graphs for graphic communication, explanation of business and personal ideas and concepts, simple visual presentation of numerical data, complex structures, logical relations, step-by-step flows of actions or operations.

Best Vector Drawing Application for Mac OS X

ConceptDraw DIAGRAM creates drawings, diagrams and charts with great visual appeal in Mac OS X.

Create Block Diagram

Block diagrams solution extends ConceptDraw DIAGRAM software with templates, samples and libraries of vector stencils for creating the block diagram.

Create block diagrams, electrical circuit diagrams, schematics, and more in minutes with ConceptDraw DIAGRAM.

Entity-Relationship Diagram (ERD) with ConceptDraw DIAGRAM

Entity-Relationship Diagram (ERD) serves for detailed description of structures and databases. An ERD represents a diagram made up mainly of rectangular blocks (for entities, or data) linked with relationships. The links between the blocks describe relations between these entities. There are three types of relationships: one-to-one,
one-to-many, many-to-many.
Draw Entity-Relationship Diagrams (ERD) easily with ConceptDraw extended with Entity-Relationship Diagram (ERD) Solution from the Software Development Area. Use ERD software to create ER diagram.
How to Build an Entity Relationship Diagram (ERD)

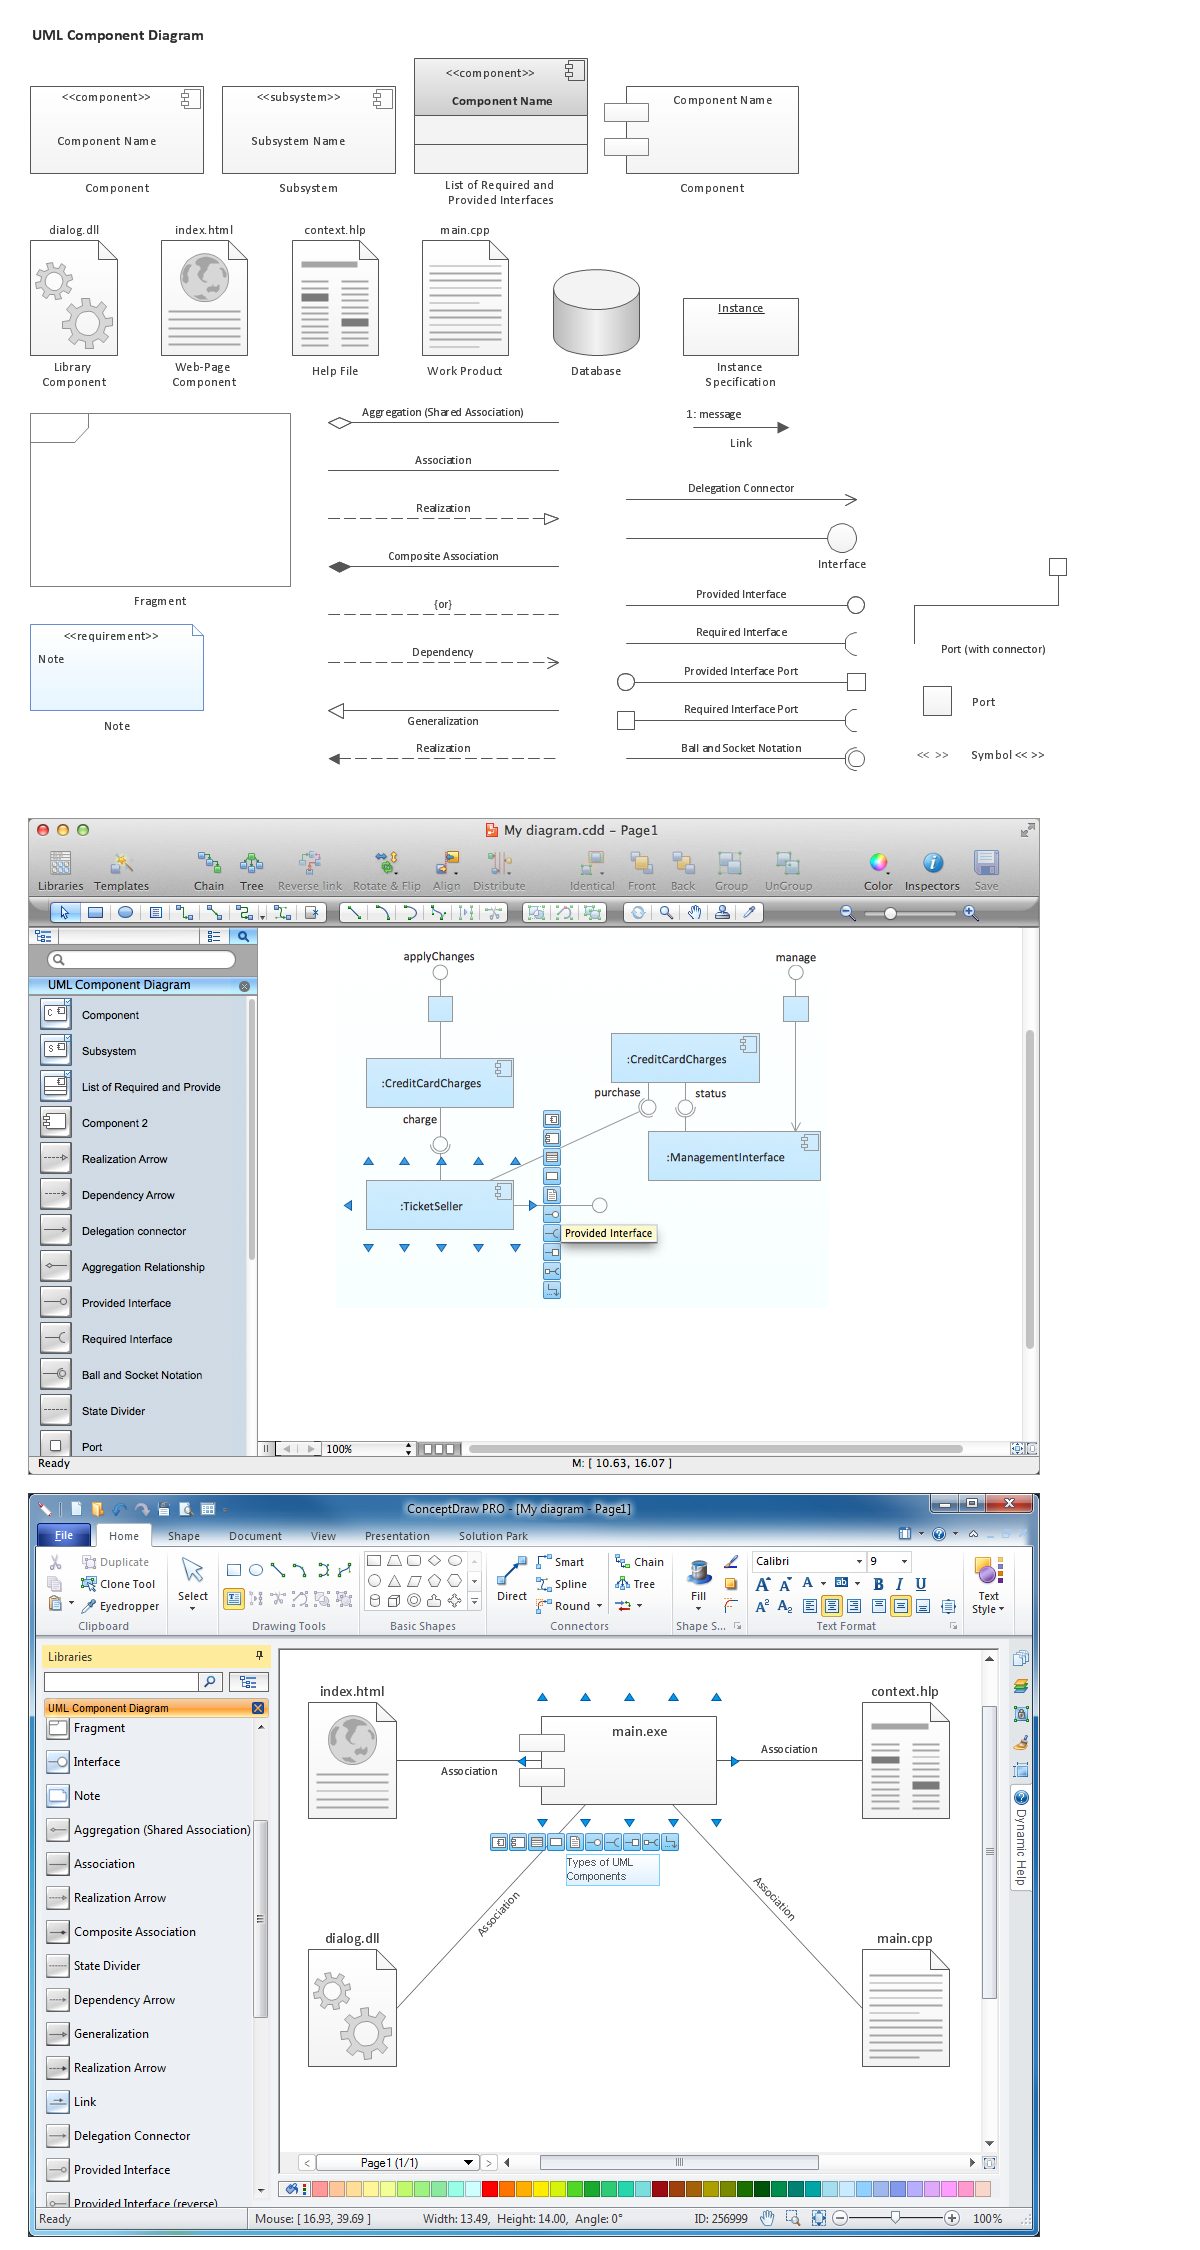
Diagramming Software for Design UML Component Diagrams

UML Component Diagram illustrate how components are wired together to larger components and software systems that shows the structure of arbitrarily complex systems.
ConceptDraw Rapid UML solution delivers libraries contain pre-designed objects fit UML notation, and ready to draw professional UML Component Diagram.

Block Diagram

The vector stencils libraries: Block Diagrams, Blocks with Perspective, Callouts, Connectors, Raised Blocks from the solution Block Diagrams contain specific block diagram symbols such as arrows, input/output symbols, start/end symbols, processing symbols, conditional symbols, commenting symbols, callouts, connectors, etc. for ConceptDraw DIAGRAM diagramming and vector drawing software. The Block Diagrams solution is contained in a "Diagrams" area of ConceptDraw Solution Park.
Use the libraries from the Block Diagrams solution to draw block diagrams for your business documents, presentations and websites in a few minutes.

Basic Diagramming

Create flowcharts, organizational charts, bar charts, line graphs, and more with ConceptDraw DIAGRAM.

Best Diagramming Software for macOS

ConceptDraw DIAGRAM creates drawings, flowcharts, block diagrams, bar charts, histograms, pie charts, divided bar diagrams, line graphs, area charts, scatter plots, circular arrows diagrams, Venn diagrams, bubble diagrams with great visual appeal on Mac OS X.
How to Draw a Bubble Chart

Basic Diagramming

Mathematical Drawing Software - Draw mathematical illustration diagrams easily from examples and templates!

Business diagrams & Org Charts with ConceptDraw DIAGRAM

Business flowcharting tool helps you create a flowchart with minimal effort. With ConceptDraw you can make a flowchart, draw data flow diagrams, orgchart professional, process flow diagrams etc - without any prior knowledge or training.
Draw Business Process Diagrams

diagram, chart, graph, plot, matrix, geographic, visual, vector, graphic, drawing, Solution Park, ConceptDraw Universal Diagramming Area

diagram, chart, graph, plot, matrix, geographic, visual, vector, graphic, drawing, Solution Park, ConceptDraw
This area collects solutions for drawing diagrams, charts, graphs, matrices, geographic and road maps for education, science, engineering, business.

IDEF3 Standard

Use Case Diagrams technology. IDEF3 Standard is intended for description and further analysis of technological processes of an enterprise. Using IDEF3 standard it is possible to examine and model scenarios of technological processes.

engineering, mechanical, electrical, chemical, process, diagram, scheme, technical, drawing Engineering

engineering, mechanical, electrical, chemical, process, diagram, scheme, technical, drawing
This solution extends ConceptDraw DIAGRAM.4 with the ability to visualize industrial systems in electronics, electrical, chemical, process, and mechanical engineering.

event-driven process chain diagram, EPC diagram, process chain flowchart Event-driven Process Chain Diagrams

event-driven process chain diagram, EPC diagram, process chain flowchart
Event-Driven Process Chain Diagrams solution extends ConceptDraw DIAGRAM functionality with event driven process chain templates, samples of EPC engineering and modeling the business processes, and a vector shape library for drawing the EPC diagrams and EPC flowcharts of any complexity. It is one of EPC IT solutions that assist the marketing experts, business specialists, engineers, educators and researchers in resources planning and improving the business processes using the EPC flowchart or EPC diagram. Use the EPC solutions tools to construct the chain of events and functions, to illustrate the structure of a business process control flow, to describe people and tasks for execution the business processes, to identify the inefficient businesses processes and measures required to make them efficient.

value stream map, VSM Value Stream Mapping

value stream map, VSM
Value stream mapping solution extends ConceptDraw DIAGRAM software with templates, samples and vector stencils for drawing the Value Stream Maps (VSM) in lean manufacturing practice.