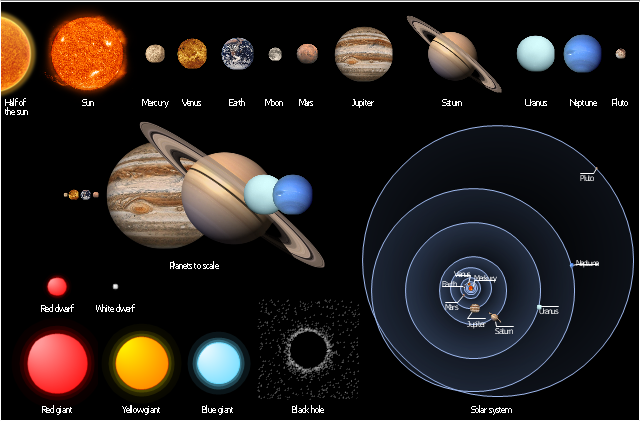
The vector stencils library "Stars and planets" contains 20 clipart images of sun, solar system planets and moon.
"A star is a massive, luminous sphere of plasma held together by its own gravity. The nearest star to Earth is the Sun, which is the source of most of the planet's energy. Some other stars are visible from Earth during the night, appearing as a multitude of fixed luminous points due to their immense distance. Historically, the most prominent stars were grouped into constellations and asterisms, and the brightest stars gained proper names. Extensive catalogues of stars have been assembled by astronomers, which provide standardized star designations." [Star. Wikipedia]
"A planet is an astronomical object orbiting a star or stellar remnant that is massive enough to be rounded by its own gravity, is not massive enough to cause thermonuclear fusion, and has cleared its neighbouring region of planetesimals. ... As scientific knowledge advanced, human perception of the planets changed, incorporating a number of disparate objects. In 2006, the International Astronomical Union (IAU) officially adopted a resolution defining planets within the Solar System. This definition has been both praised and criticized and remains disputed by some scientists because it excludes many objects of planetary mass based on where or what they orbit. Although eight of the planetary bodies discovered before 1950 remain "planets" under the modern definition, some celestial bodies, such as Ceres, Pallas, Juno, Vesta (each an object in the Solar asteroid belt), and Pluto (the first-discovered trans-Neptunian object), that were once considered planets by the scientific community are no longer viewed as such." [Planet. Wikipedia]
The clipart example "Design elements - Stars and planets" was created using the ConceptDraw PRO diagramming and vector drawing software extended with the Astronomy solution from the Science and Education area of ConceptDraw Solution Park.
 Manufacturing and Maintenance
Manufacturing and maintenance solution extends ConceptDraw PRO software with illustration samples, templates and vector stencils libraries with clip art of packaging systems, industrial vehicles, tools, resources and energy.
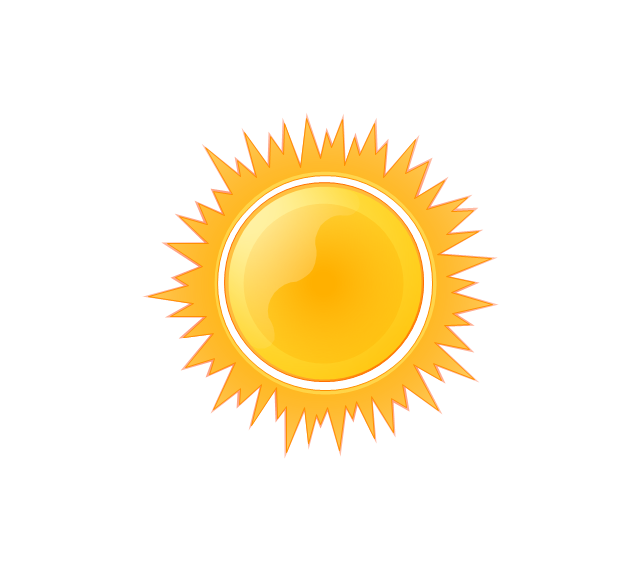
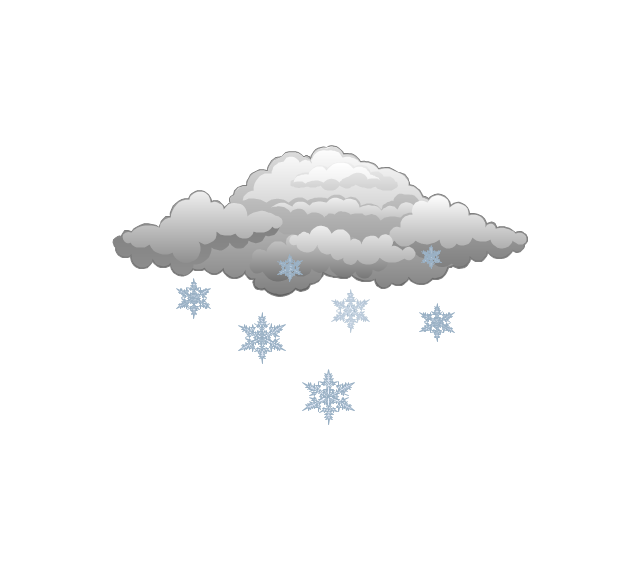
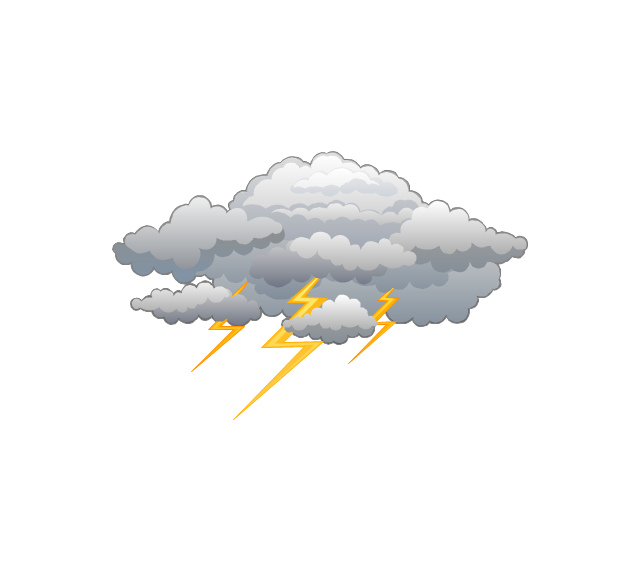
The vector stencils library "Weather" contains 17 weather clipart images for drawing illustrations on climate to show cloudiness, air temperature, precipitation, wind.
"Weather is the state of the atmosphere, to the degree that it is hot or cold, wet or dry, calm or stormy, clear or cloudy. Most weather phenomena occur in the troposphere, just below the stratosphere. Weather generally refers to day-to-day temperature and precipitation activity, whereas climate is the term for the average atmospheric conditions over longer periods of time. When used without qualification, "weather", is generally understood to mean the weather of Earth.
Weather is driven by air pressure (temperature and moisture) differences between one place and another. These pressure and temperature differences can occur due to the sun angle at any particular spot, which varies by latitude from the tropics. The strong temperature contrast between polar and tropical air gives rise to the jet stream. Weather systems in the mid-latitudes, such as extratropical cyclones, are caused by instabilities of the jet stream flow. Because the Earth's axis is tilted relative to its orbital plane, sunlight is incident at different angles at different times of the year. On Earth's surface, temperatures usually range ±40°C (−40°F to 100°F) annually. Over thousands of years, changes in Earth's orbit affect the amount and distribution of solar energy received by the Earth and influence long-term climate and global climate change." [Weather. Wikipedia]
The clip art example "Weather - Vector stencils library" was created using the ConceptDraw PRO diagramming and vector drawing software extended with the Nature solution from the Illustration area of ConceptDraw Solution Park.
www.conceptdraw.com/ solution-park/ illustrations-nature
 Pie Charts
Pie Charts are extensively used in statistics and business for explaining data and work results, in mass media for comparison (i.e. to visualize the percentage for the parts of one total), and in many other fields. The Pie Charts solution for ConceptDraw PRO v10 offers powerful drawing tools, varied templates, samples, and a library of vector stencils for simple construction and design of Pie Charts, Donut Chart, and Pie Graph Worksheets.
 Divided Bar Diagrams
The Divided Bar Diagrams Solution extends the capabilities of ConceptDraw PRO v10 with templates, samples, and a library of vector stencils for drawing high impact and professional Divided Bar Diagrams and Graphs, Bar Diagram Math, and Stacked Graph.
 25 Typical Orgcharts
The 25 Typical Orgcharts solution contains powerful organizational structure and organizational management drawing tools, a variety of professionally designed organization chart and matrix organization structure samples, 25 templates based on various orga
- Sun Solar System Clipart
- Clip Art Solar Energy
- Png Vector Clipart Wood Biomass Wind Turbine Wind Turbine Solar
- Cloudy Day Clipart
- Solar Energy Clipart
- Design elements - Resources and energy | Resources and energy ...
- Wind Energy Clipart
- Resources and energy - Vector stencils library | Network Glossary ...
- Energy Sources Clipart
- Energy Clip Art
- Solar System Symbols | Sun Solar System | Sketching Software ...
- Types of Flowcharts | Energy resources diagram | Pie Charts | Solar ...
- Resources and energy - Vector stencils library | Design elements ...
- Clipart Of Oil Energy
- Solar System Symbols | Sun Solar System | Sketching Software ...
- Solar Energy Examples
- Energy Pyramid Diagram | Resources and energy - Vector stencils ...
- How To use House Electrical Plan Software | Resources and energy ...
- Block Diagram Of Solar Energy
- Art Of Solar Diagram Design Of Solar
