Bar Chart
ConceptDraw PRO extended with Bar Graphs solution from Graphs and Charts area of ConceptDraw Solution Park is ideal software for quick and simple drawing bar chart of any complexity graph.Bio Flowchart Lite
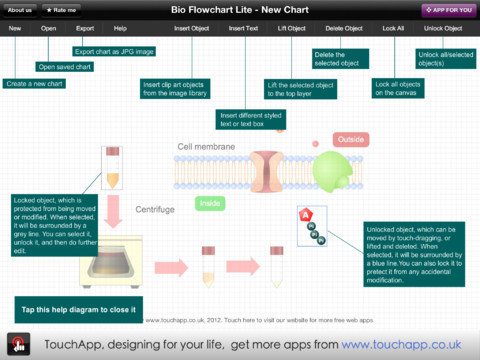
This app targets to help teachers and students to create vivid and professional biological flowcharts and diagrams in an easy way.Relative Value Chart Software
Relative value is a value measured in the terms of liquidity, risks, return of one investment or financial instrument relative to another. Relative values are widely used in:business, economics, investment, management, marketing, statistics, etc. ConceptDraw PRO software is the best for drawing professional looking Relative Value Charts. ConceptDraw PRO provides Divided Bar Diagrams solution from the Graphs and Charts Area of ConceptDraw Solution Park.Horizontal Flowchart
This sample was created in ConceptDraw PRO diagramming and vector drawing software using the Flowcharts solution from the What is a Diagram area of ConceptDraw Solution Park. A Flowchart is a graphically representation of the process, algorithm or the step-by-step solution of the problem. The Flowcharts have one or more starting and ending points. The geometric figures on the Flowcharts represent the steps of the process and are connected with arrows that show the sequence of the actions.Create Graphs and Charts
Charting Software allows you to create diagrams, charts, graphs, flowcharts, and other business graphics. ConceptDraw PRO include simple shape drawing tools, examples, templates, and symbol libraries.Pyramid Charts
ConceptDraw PRO extended with Pyramid Diagrams Solution from the Marketing Area of ConceptDraw Solution Park is a powerful Pyramid Charts making software. A Pyramid Chart has the form of triangle and hierarchically structures, organizes and help to analyze the information, data or ideas. Triangle is divided on the sections that usually have different widths. The width indicates the level of hierarchy among the topics.Bar Graph
You need to draw the Bar Graph? The automated tool can be useful for you. ConceptDraw PRO diagramming and vector drawing software extended with Bar Graphs solution from Graphs and Charts area of ConceptDraw Solution Park will help you create any Bar Graph.Scientific Symbols Chart
ConceptDraw PRO is the beautiful design software that provides many vector stencils, examples and templates for drawing different types of illustrations and diagrams.Mathematics Solution from the Science and Education area of ConceptDraw Solution Park includes a few shape libraries of plane, solid geometric figures, trigonometrical functions and greek letters to help you create different professional looking mathematic illustrations for science and education.
Line Graph
ConceptDraw PRO extended with Line Graphs solution from Graphs and Charts area of ConceptDraw Solution Park is ideal software for quick and simple drawing professional looking line graph.Polar Graph
This sample shows the Polar Graph. The Polar Graph is a graph in the polar coordinate system in which the each point on the plane is defined by two values - the polar angle and the polar radius. The certain equations have very complex graphs in the Cartesian coordinates, but the application of the polar coordinate system allows usually produce the simple Polar Graphs for these equations.Seating Chart Template
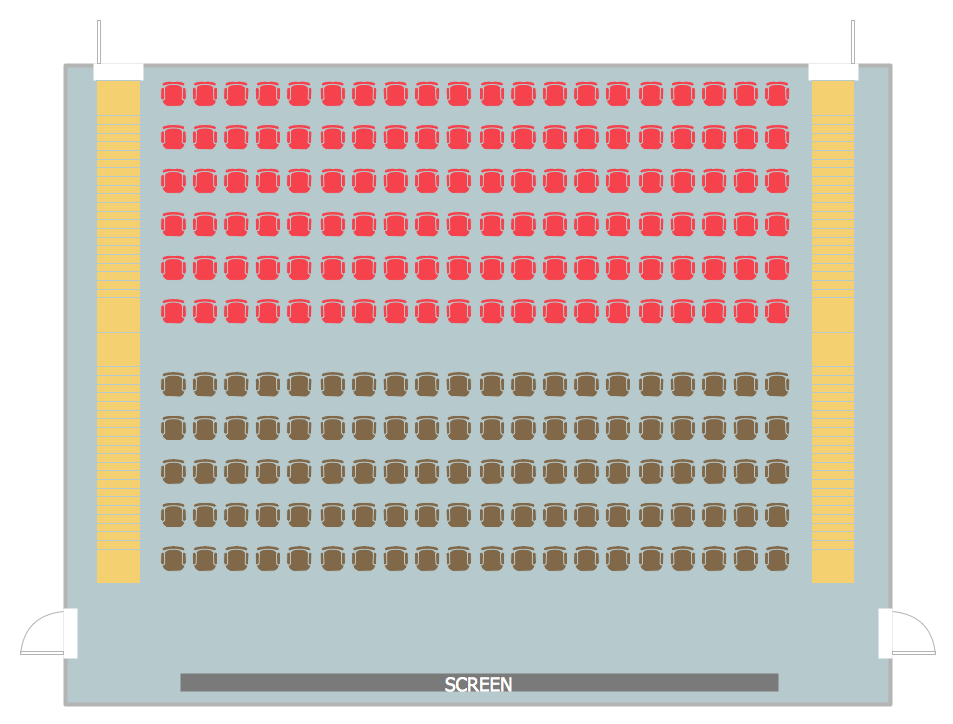
Seating chart developing is necessity for constructing and building the cinemas, theaters, banquet halls, auditoriums, and other premises for accommodation a large number of people. Seating chart template can help you design professional looking seating plan. ConceptDraw PRO diagramming and vector drawing software recommends you to use the Seating Plans solution from the Building Plans area for designing the seating charts.Chart Software for Better Presentations
Easy charting software comes with beautiful chart templates and examples. This makes it easy to create professional charts without prior experience. Graphs and Charts Area provide a wide collection of professional looking predesigned templates, samples and ready-to-use vector stencils that will help you to draw the charts and diagrams of various types: Pie Charts, Donut Charts, Line Charts, Column Charts, Bar Charts, Pyramids, Scatter Charts, Venn Diagrams, Spider Charts, Area Charts, Divided Bar Graphs.Sample Pictorial Chart. Sample Infographics
Sample Pictorial Chart - Pictorial Infographics solution provides easy-to-use design infographics drawing tools, large collection of different sample infographics and infograms, sample pictorial chart and templates to be filled in, and 10 libraries with great quantity of predesigned vector pictograms. Use Pictorial Infographics solution to draw your own design pictorial infographics documents quick and easy.Percentage Spider Chart
ConceptDraw PRO creates drawings, diagrams and charts with great visual appeal in Mac OS X. This sample shows the Spider Chart that represents the buyer perceptions of the leather footwear industries in Brazil, India and Italy.Astronomy Symbols
Are you an astronomer, astronomy teacher or student? And you need to draw astronomy pictures quick and easy? ConceptDraw PRO diagramming and vector drawing software extended with Astronomy solution from the Science and Education area will help you! Astronomy solution provides 7 libraries with wide variety of predesigned vector objects of astronomy symbols, celestial bodies, solar system symbols, constellations, etc.- Some Beautiful Images For Chart Drawing
- Beautiful Pictures To Draw On Chart
- Beautiful Images For Drawing Diagram
- Some Beutiful Images Of Charts
- Beautiful Chart Pictures
- Beautiful Drawing On Chart
- Beautiful Picture Of Charts Of Presentation
- Beautiful Chart On Icon Of Computer
- Drawing Illustration | How to Draw a Natural Landscape | How can ...
- Beautiful Charts Pictures On Landscape
- A Beautiful Chart Of Computer
- Make Desighning Pictures On School Chart
- Beautiful Charts Of Computer
- The Pictures Of Beautiful
- Beautiful Images Of Structure Of Software
- Image Of Organizational Chart Of Cable Company
- Animals Pictures
- How to Draw a Natural Landscape | Beautiful Nature Scene ...
- Chart Examples | Beutifull Drawing Picture With Nature
- Drawing Illustration | Drawing a Nature Scene | Beautiful Nature ...


