Tools to Create Your Own Infographics
Over the past few centuries, data visualization has evolved so much that we use it every day in all areas of our lives. Many believe that infographic is an effective tool of storytelling, as well as analytics, and that it is able to overcome most of the language and educational barriers. Understanding the mechanisms of human perception will help you to understand how abstract forms and colors used in data visualization can transmit information more efficient than long paragraphs of text.Best Tool for Infographic Construction
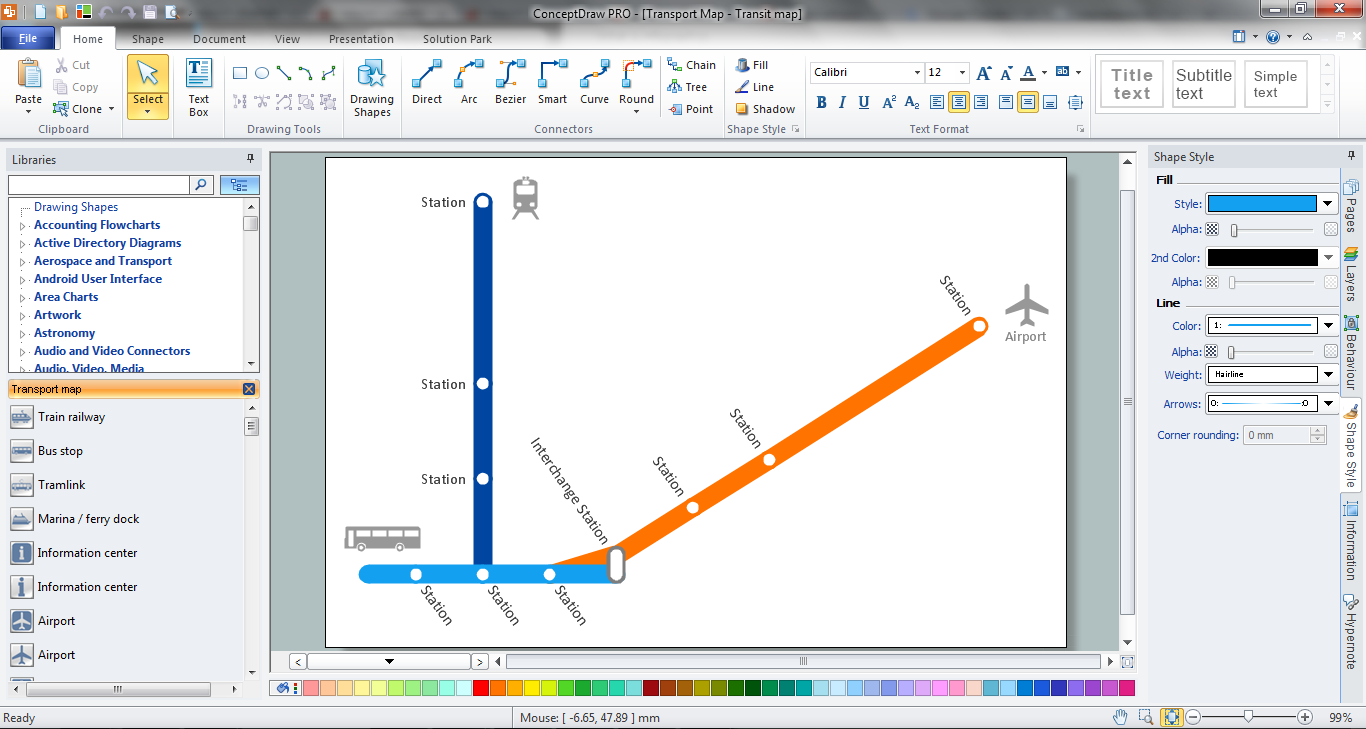
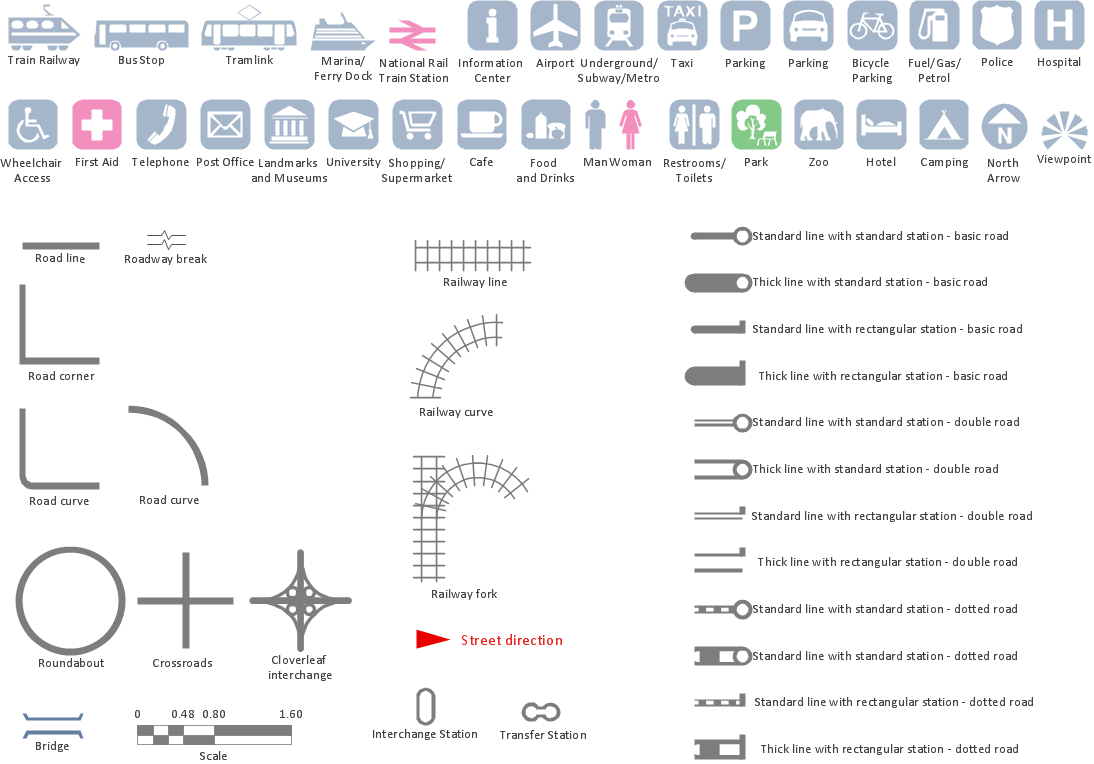
ConceptDraw is a best data visualization tool that will allow everyone to create rich infographics and visualizations quickly and easily.Spatial infographics Design Elements: Transport Map
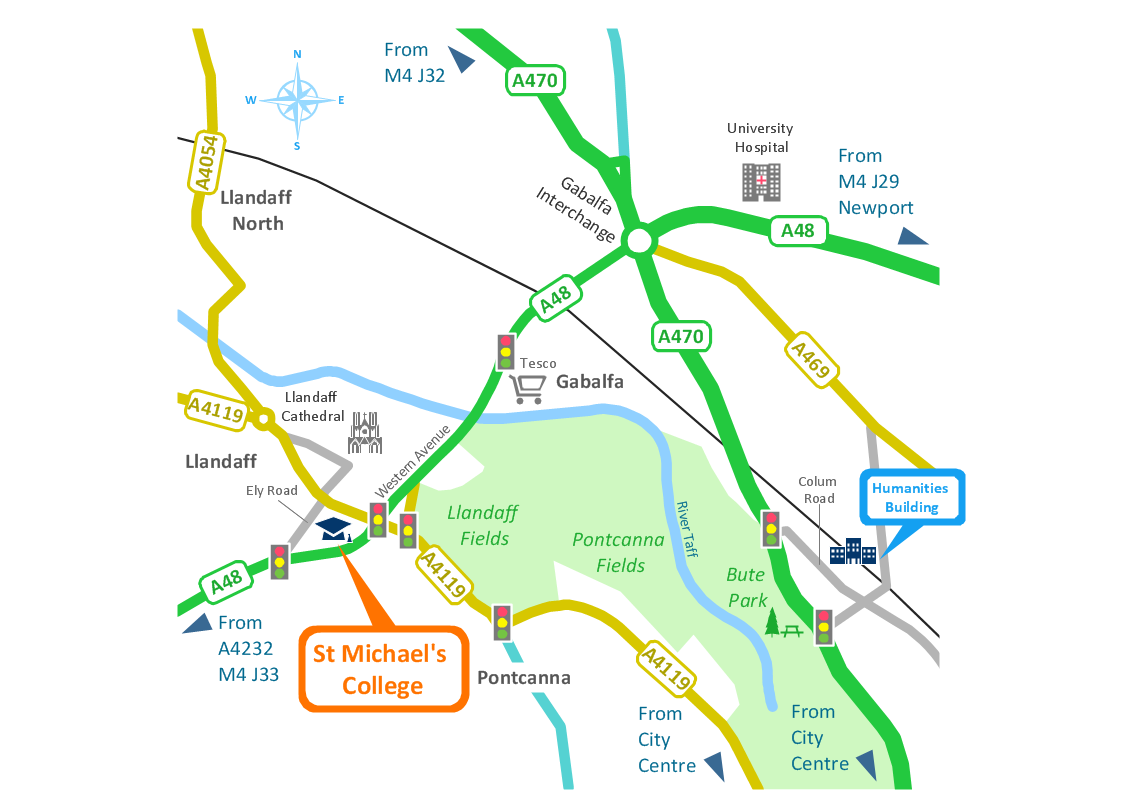
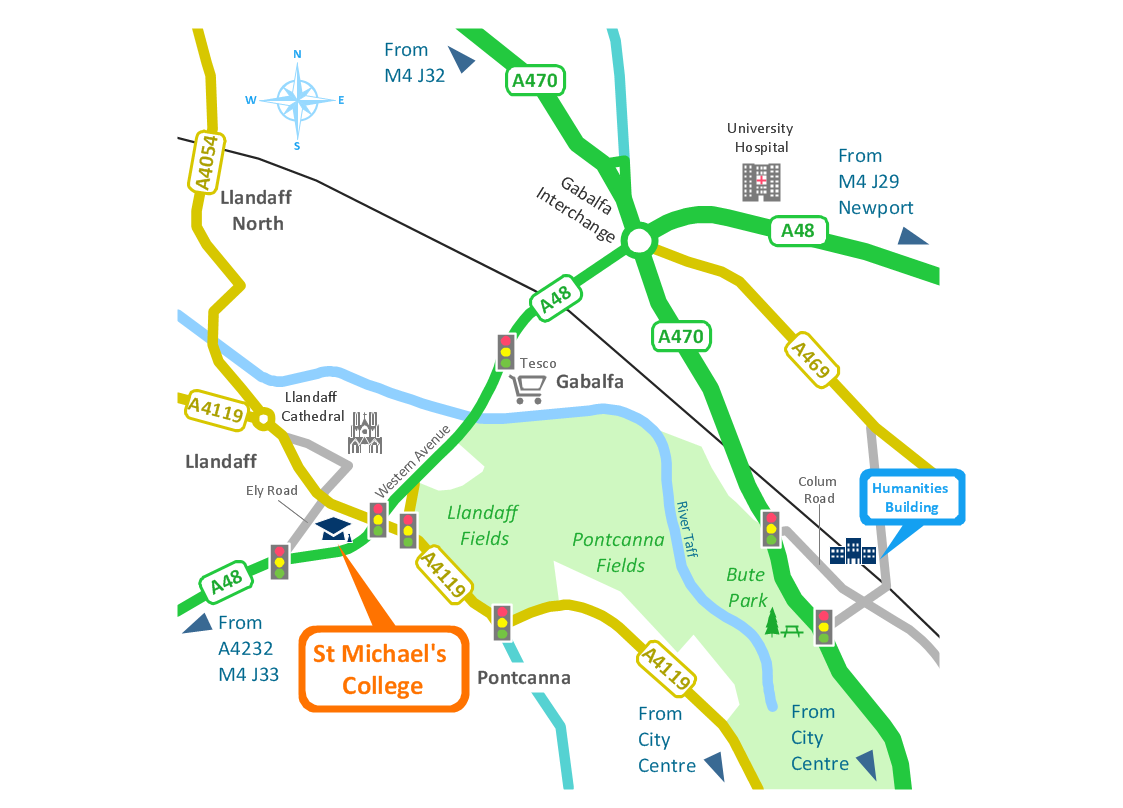
Do you like infographics and data visualization? Creating infographics is super-easy with ConceptDraw.Spatial infographics Design Elements: Location Map
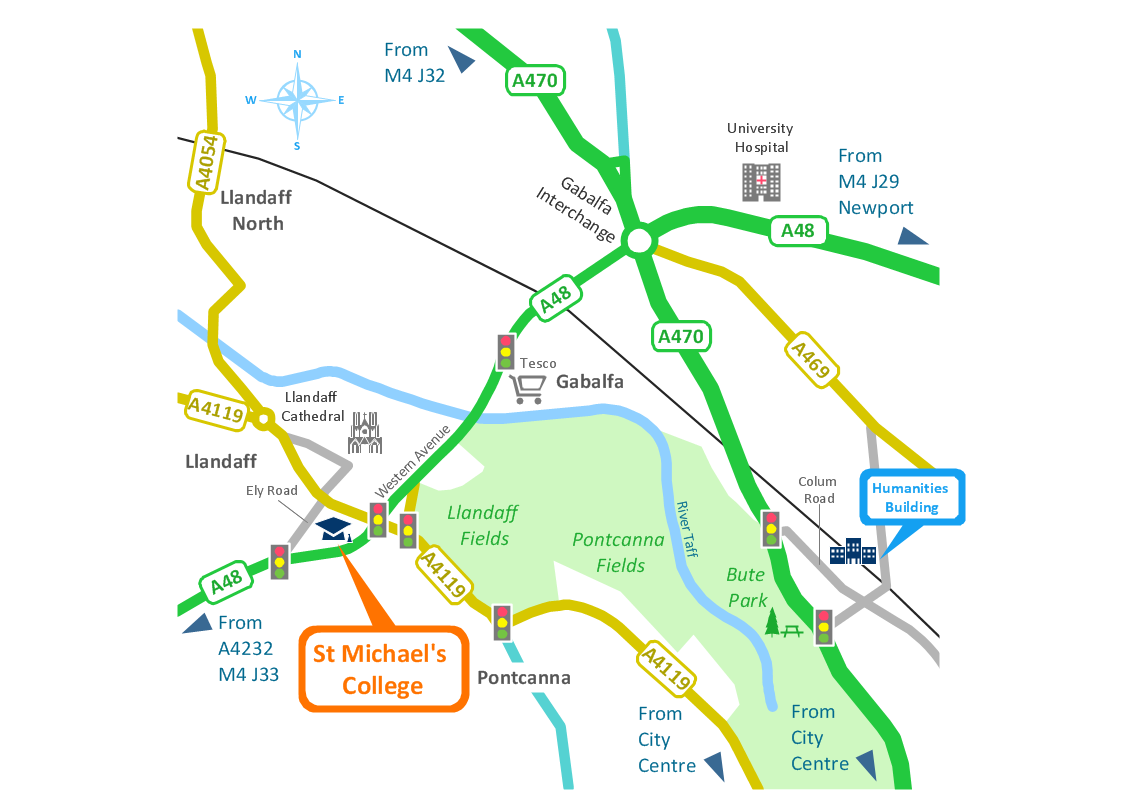
Infographic Design Elements for visually present various geographically distributed information.
 Spatial Infographics
Spatial infographics solution extends ConceptDraw PRO software with infographic samples, map templates and vector stencils libraries with design elements for drawing spatial information graphics.
Excellent Examples of Infographic Maps
Create Spatial infographics with ConceptDraw using its excellent examples of infographic maps. We hope these can inspire and teach you!Brilliant Examples of Infographics Map, Transport, Road
ConceptDraw PRO contains spatial infographics samples, map templates to be filled in, and libraries of vector stencils for main design elements of spatial infographics.Spatial Data Analysis
ConceptDraw PRO diagramming and vector drawing software extended with Pictorial Infographics Solution from the “What are Infographics” Area is the best for Spatial Data Analysis. You have a perfect possibility to make sure this right now.How tо Represent Information Graphically
ConceptDraw Infographics is a great visual tool for communicating the large amounts of data and graphic visualization and representations of data and information.Visualization Spatial Data Using Thematic Maps Combined with Infographics
Now anyone can build an infographics from their data using ConceptDraw. Nice and simple, but the features it have are power-packed!Map Infographic Maker
Take inspiration with ConceptDraw to visualise your maps and make eye-catching infographics.Map Infographic Tool
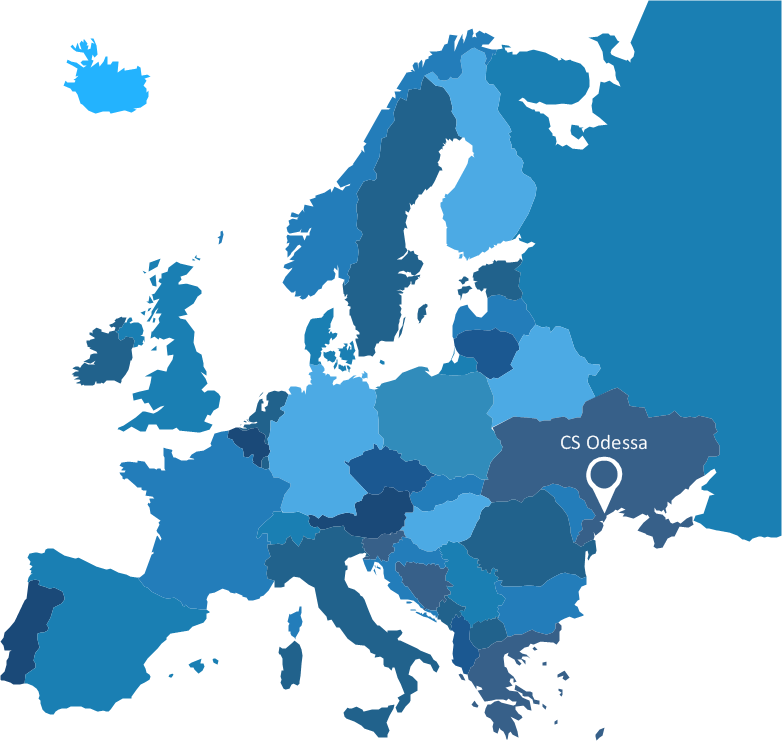
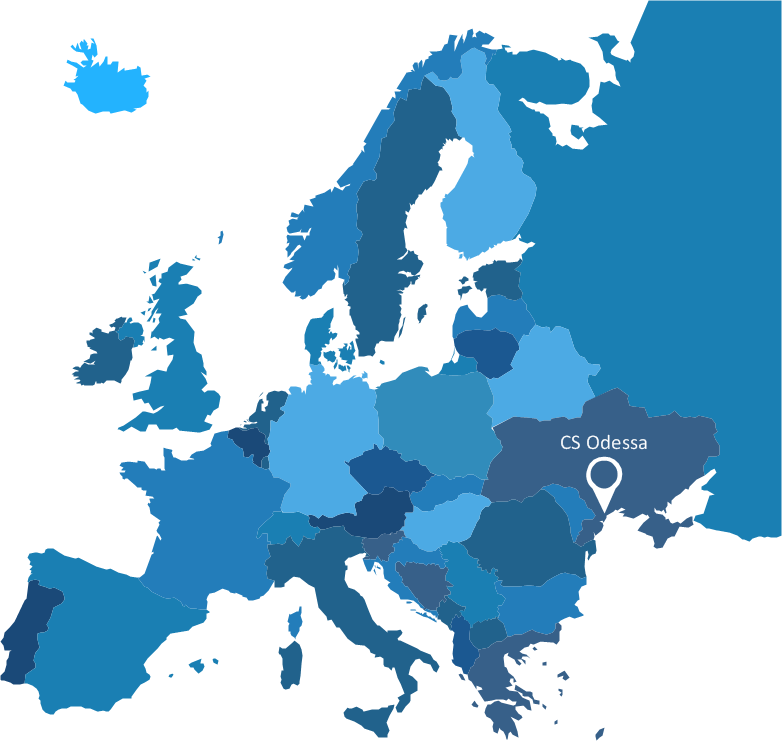
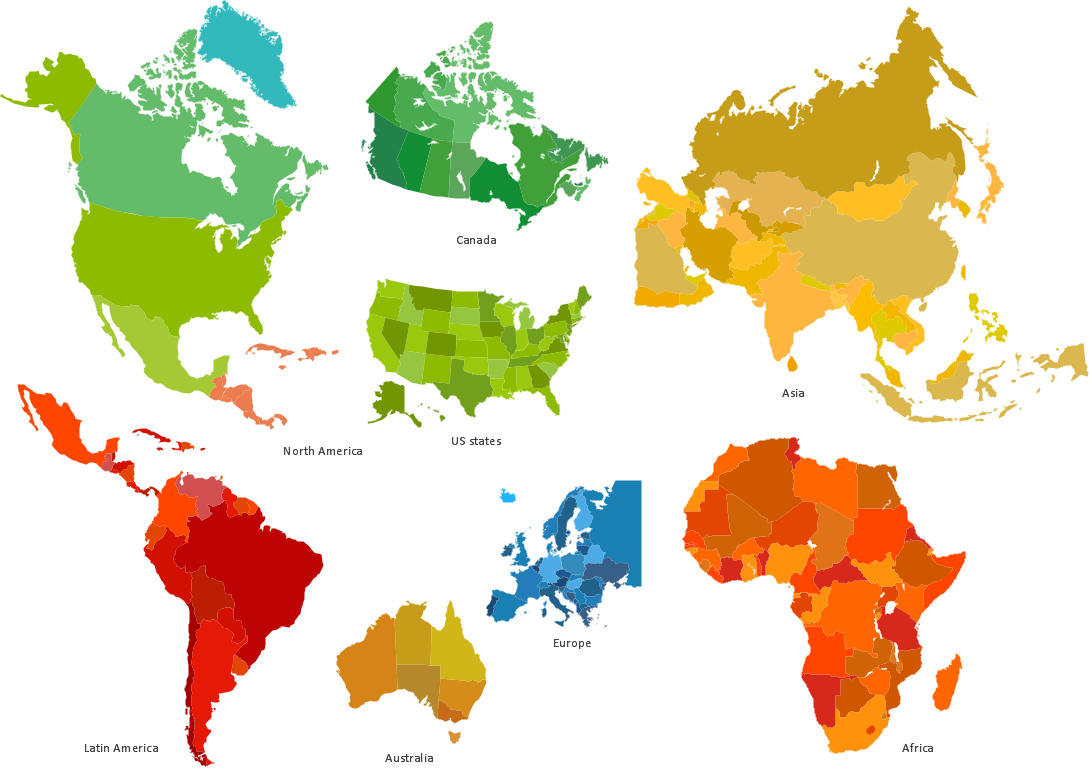
ConceptDraw is a data visualization tool, which can help you to create a map infographics. Anyone can do this, it's that easy!Spatial infographics Design Elements: Continental Map
ConceptDraw PRO is a software for making infographics illustrations. You can work with various components to build really impressive and easy-to-understand infographics design.Travel Infographics
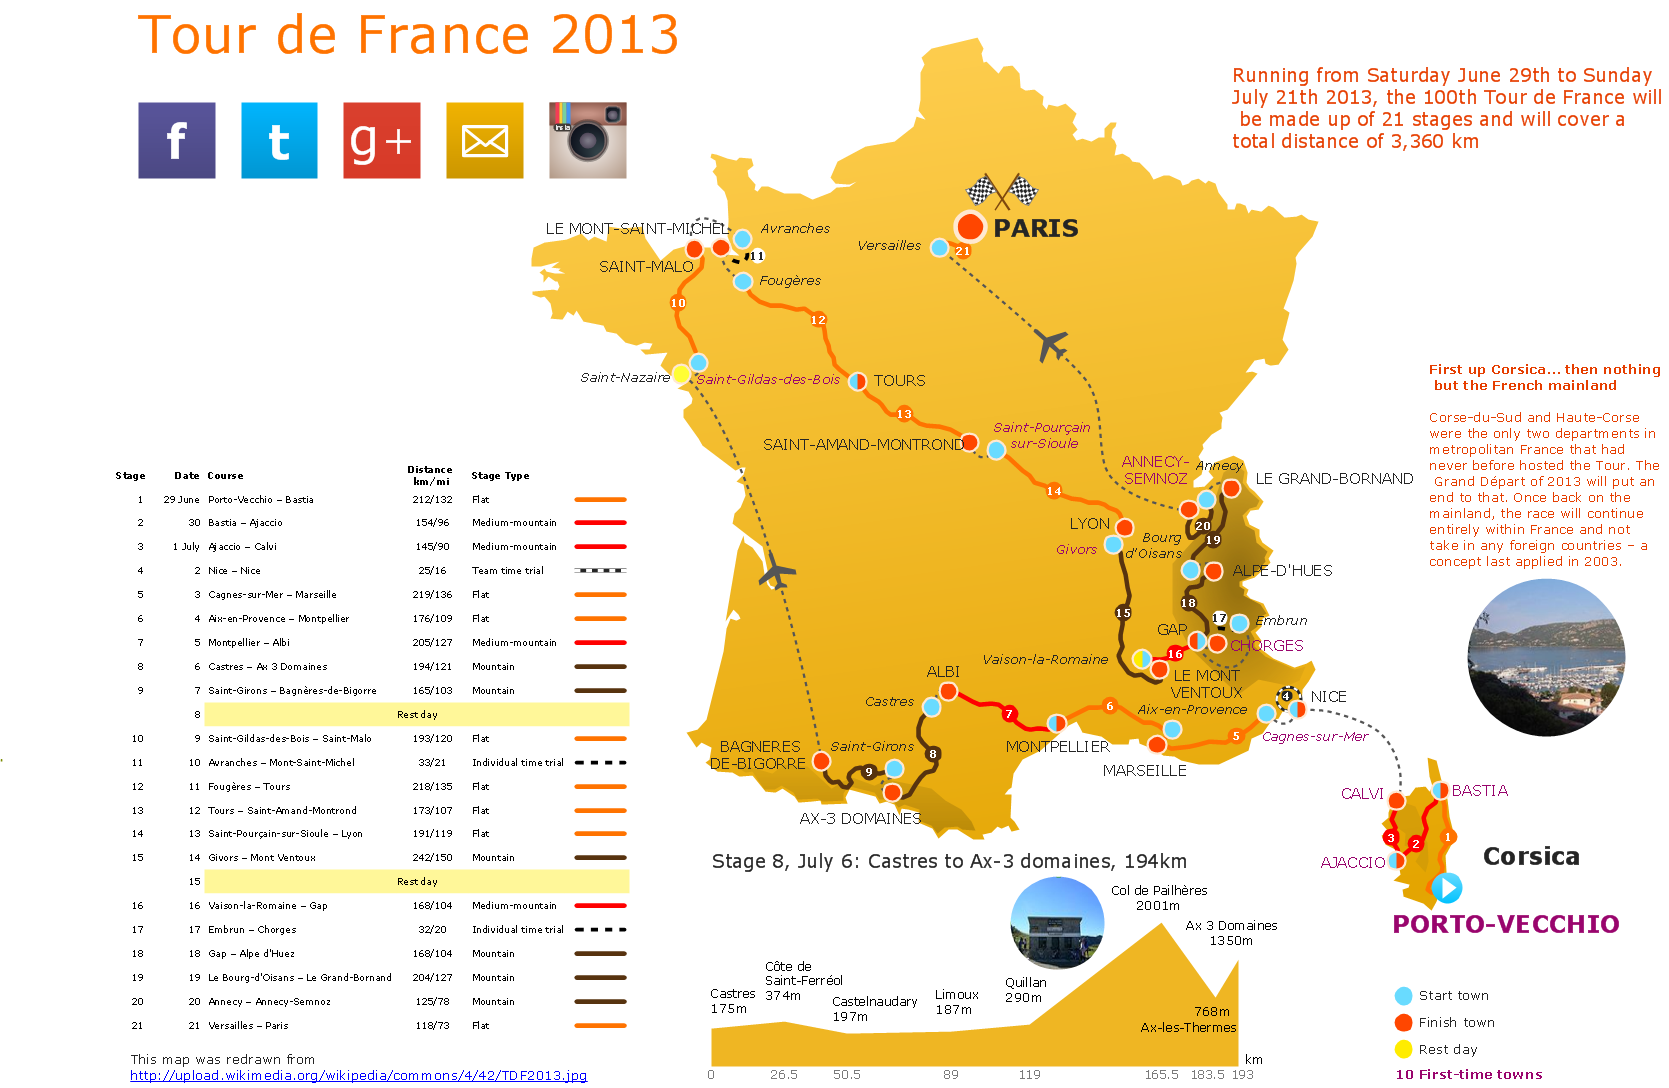
Creating Travel infographics is super-easy with ConceptDraw.Informative and Well-Designed Infographics
Informative and well-designed Infographics allows visually present various map containing information.- Process Flowchart | Business Diagram Software | Spatial Data ...
- Process Flowchart | Business Diagram Software | Spatial ...
- ConceptDraw PRO The best Business Drawing Software | Spatial ...
- Spatial Infographics | Event-driven Process Chain (EPC) Diagrams ...
- Spatial Infographics | Maps | Aerospace and Transport | Sample ...
- Hotel Spatial Bubble Diagram
- ConceptDraw PRO The best Business Drawing Software ...
- Process Flowchart | SysML Diagram | Spatial Data Analysis ...
- Mind Map Exchange | Spatial Infographics | Business Processes ...
- Spatial infographics Design Elements: Location Map | Process ...
- Spatial Data Analysis | How to Draw Pictorial Chart . How to Use ...
- Process Flowchart | Spatial Data Analysis | Types of Welding in ...
- Continent Maps | Maps | Spatial Infographics | Fish Bone Diagram Of ...
- UML Component Diagram . Design Elements | Spatial infographics ...
- Maps | Continent Maps | Spatial Infographics | Class Diagram Of ...
- Tree Network Topology Diagram | Spatial Infographics | Network ...
- Total Quality Management TQM Diagrams | How to Create a TQM ...
- Diagram And Flowchat Of Tourist Guide
- Spatial infographics Design Elements: Transport Map ...
- Winter Sports Vector Clipart. Medal Map. Spatial Infographics | How ...


