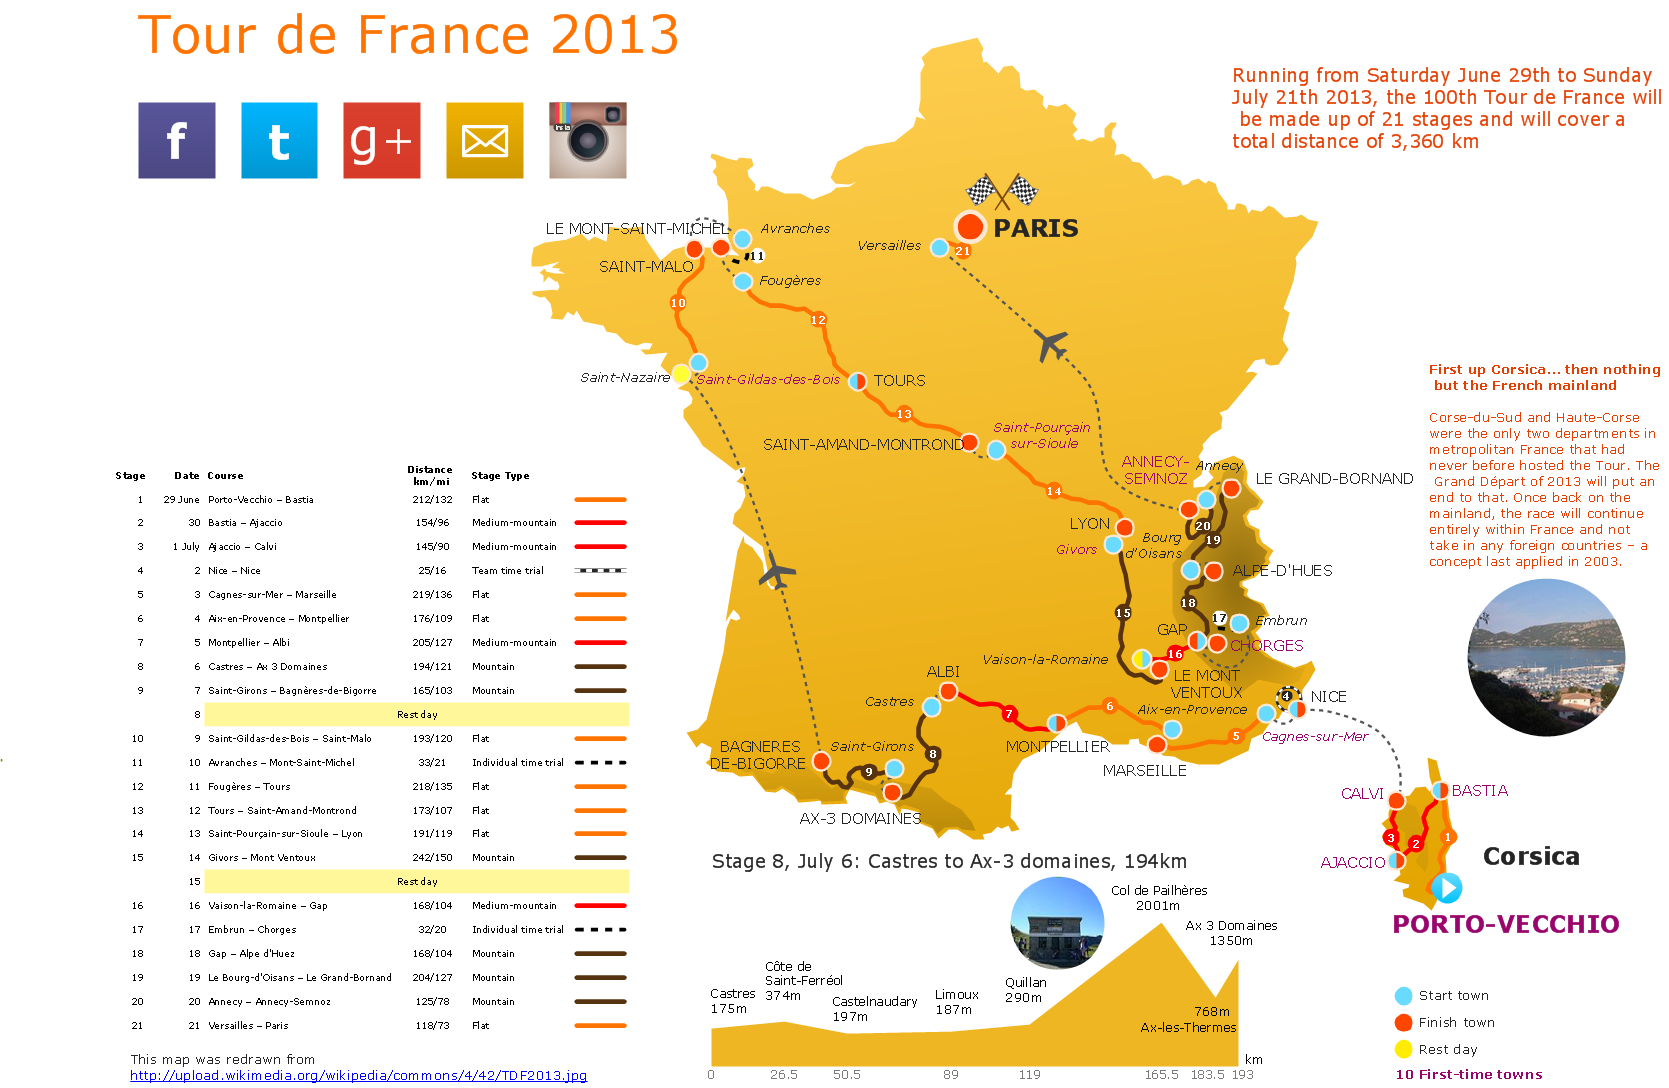
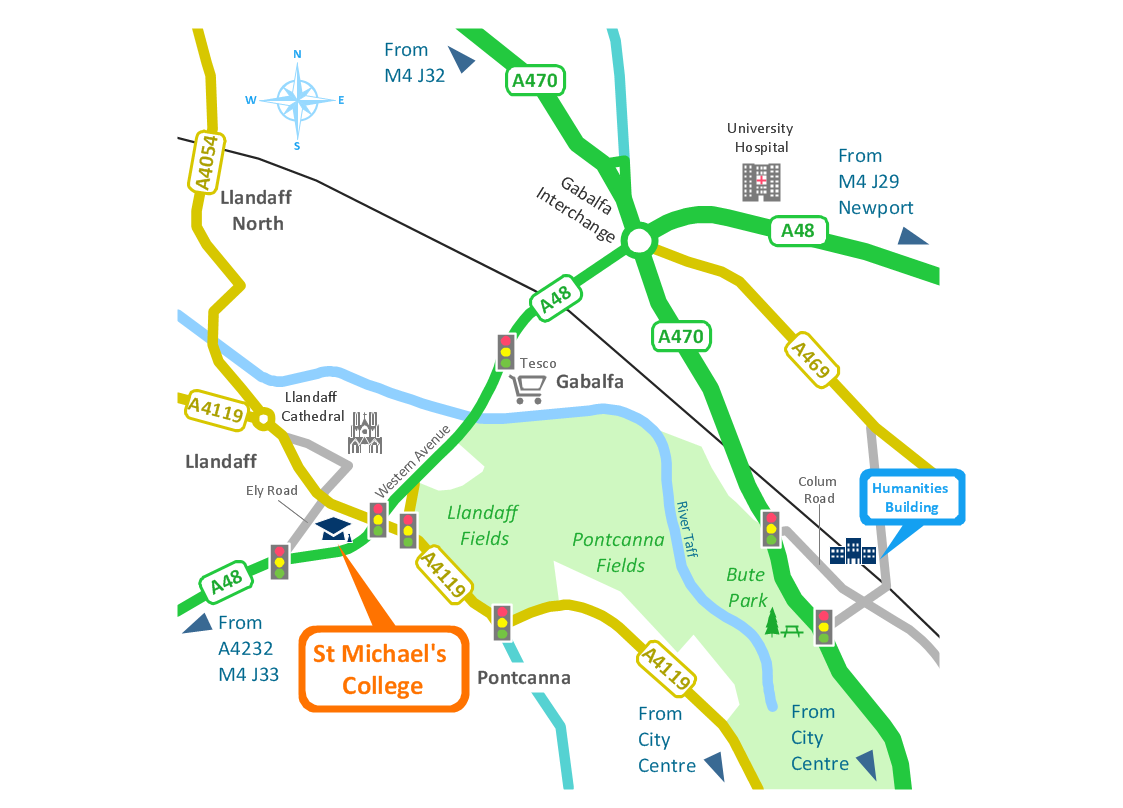
Transportation Infographics
ConceptDraw is a visualization Software for making transportation infographics. Infographics design vector elements and vector graphics which will surely help you in your design process.Tools to Create Your Own Infographics
Over the past few centuries, data visualization has evolved so much that we use it every day in all areas of our lives. Many believe that infographic is an effective tool of storytelling, as well as analytics, and that it is able to overcome most of the language and educational barriers. Understanding the mechanisms of human perception will help you to understand how abstract forms and colors used in data visualization can transmit information more efficient than long paragraphs of text.How to Create a Powerful Infographic When You do not Have a Designer
Create a powerful infographic, become inspired by the people with ConceptDraw.Map Infographic Design
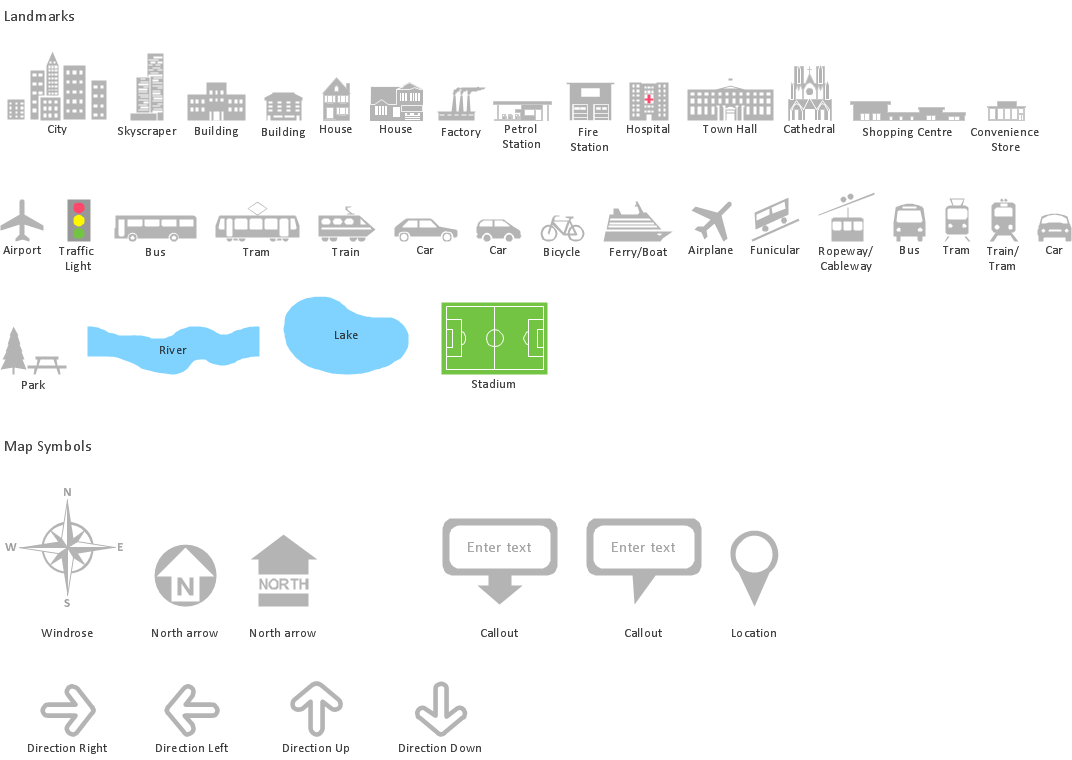
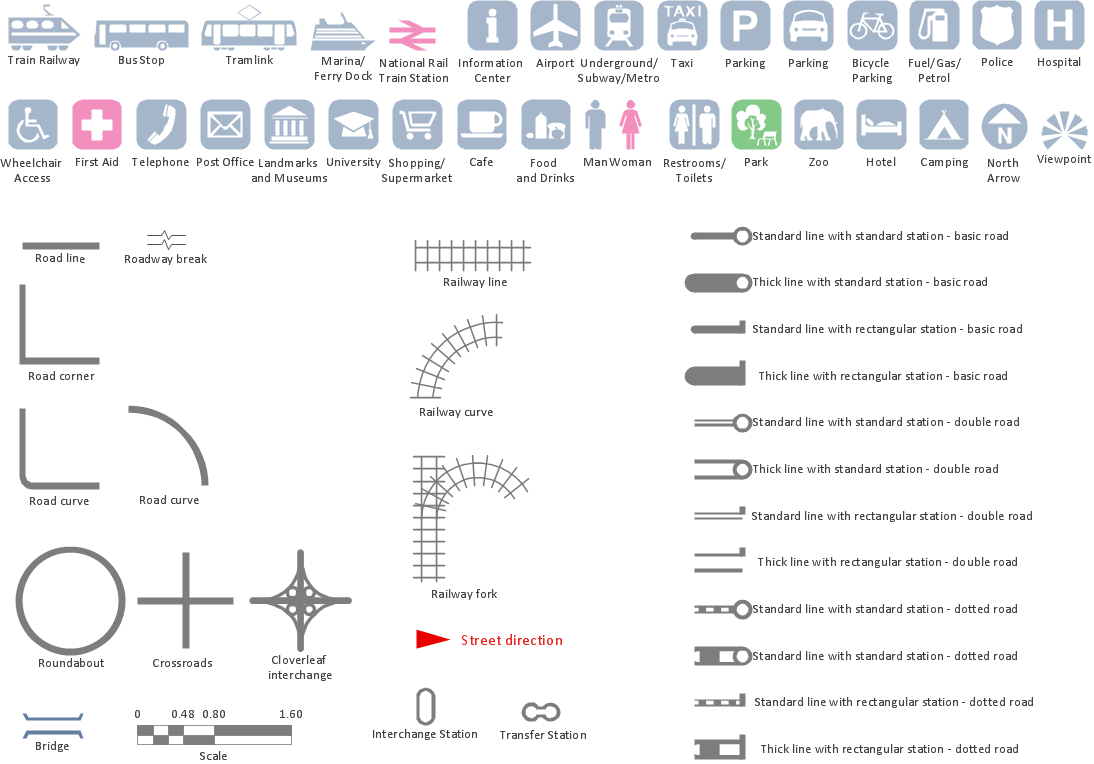
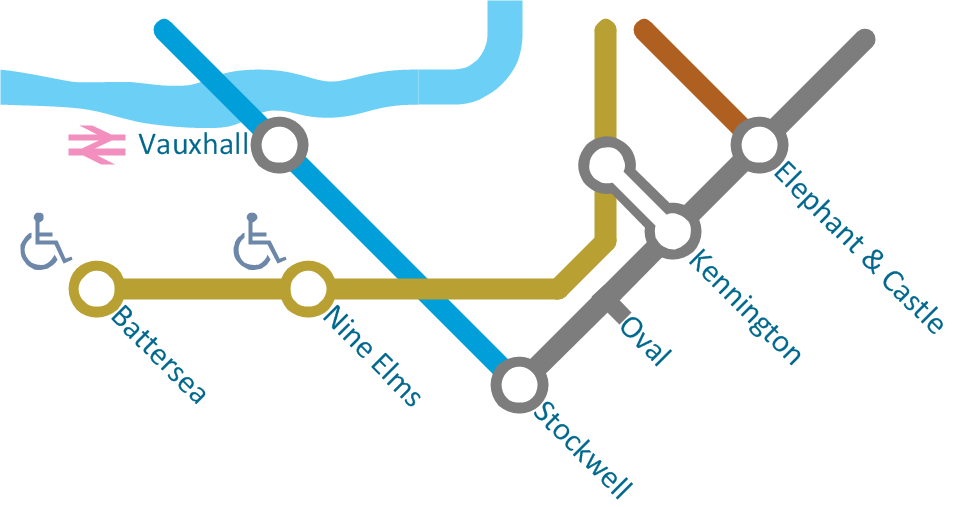
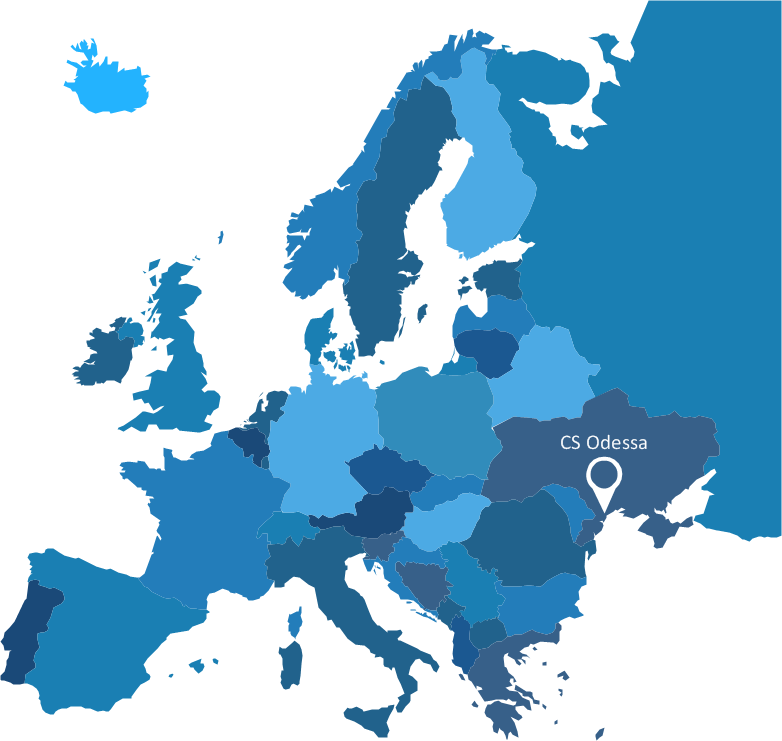
ConceptDraw collection of vector elements for infographics design.Spatial infographics Design Elements: Transport Map
Do you like infographics and data visualization? Creating infographics is super-easy with ConceptDraw.Map Infographic Tool
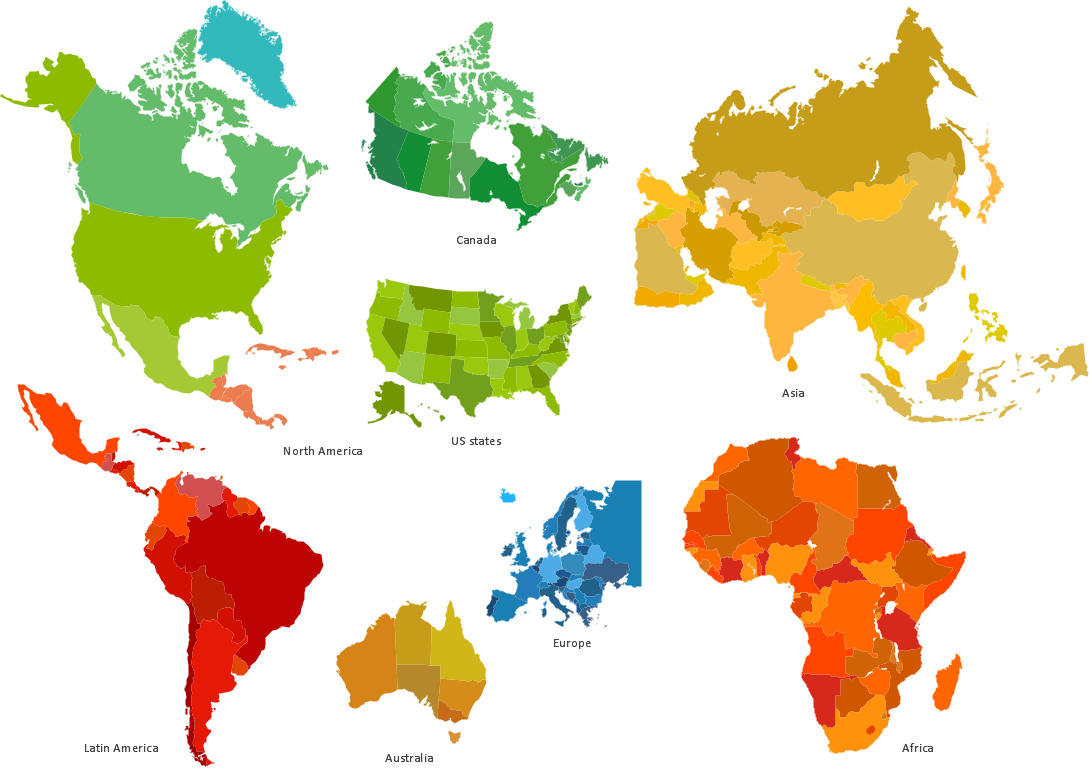
ConceptDraw is a data visualization tool, which can help you to create a map infographics. Anyone can do this, it's that easy!Map Infographic Maker
Take inspiration with ConceptDraw to visualise your maps and make eye-catching infographics.Superb Examples of Infographic Maps
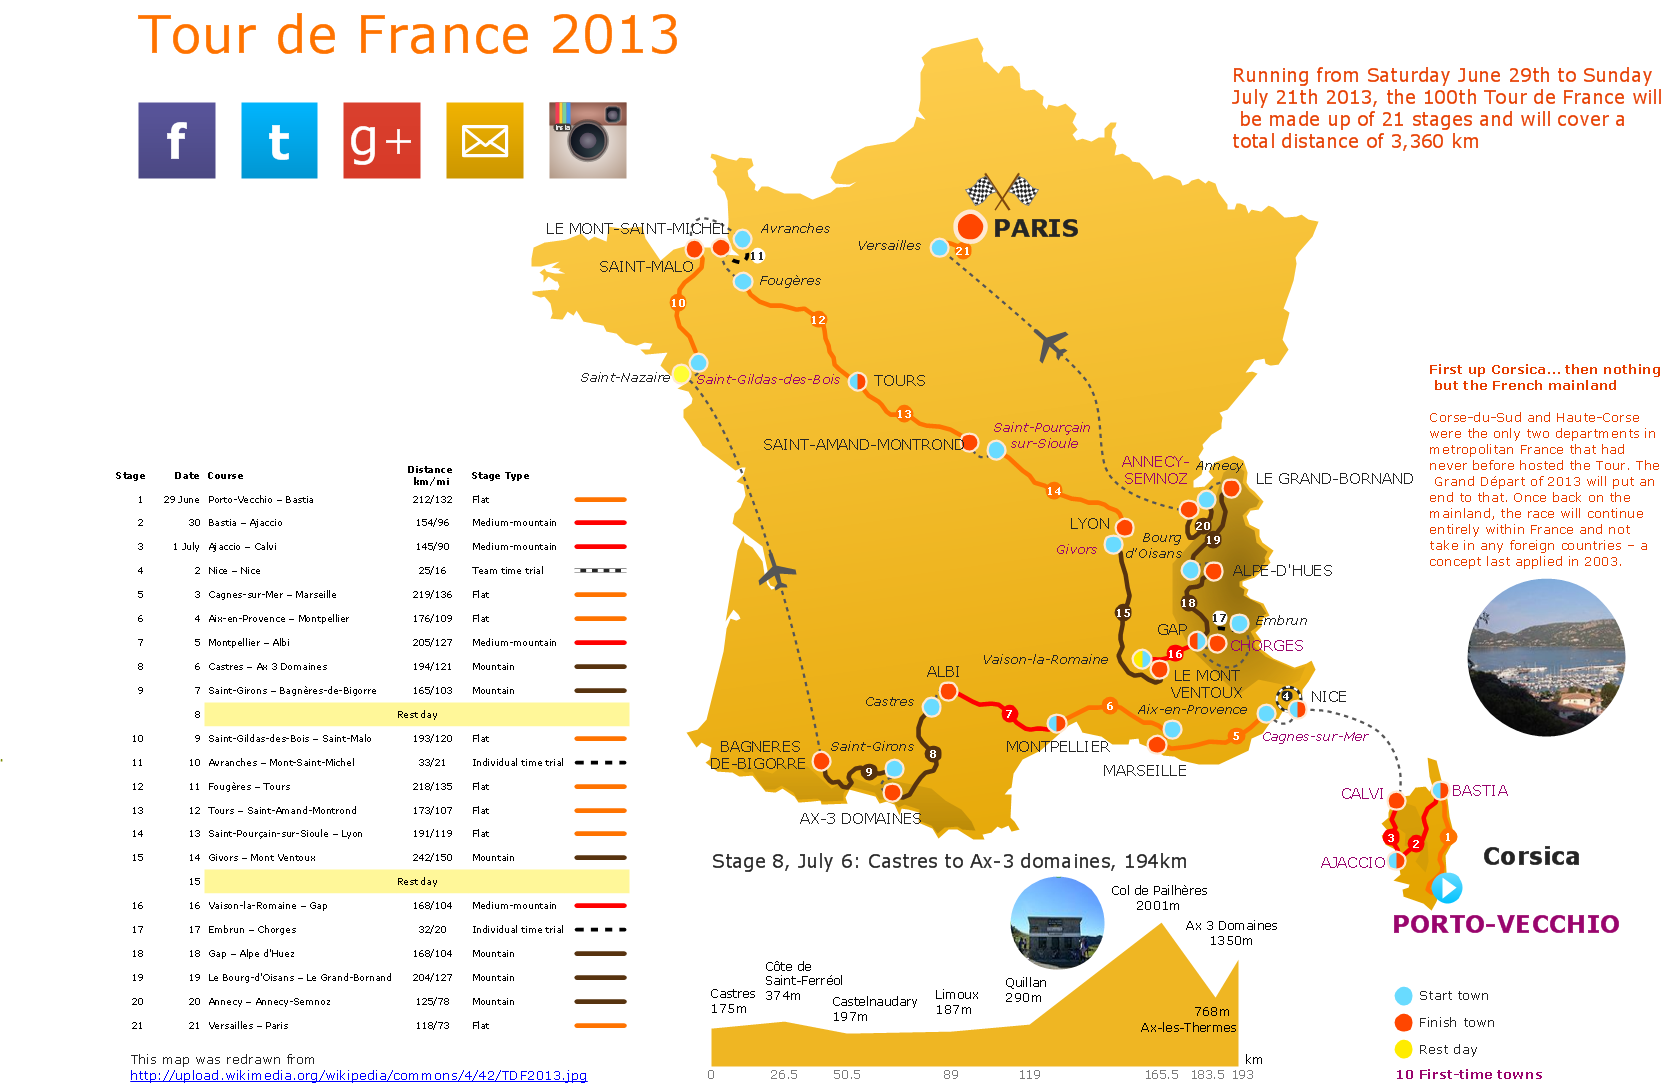
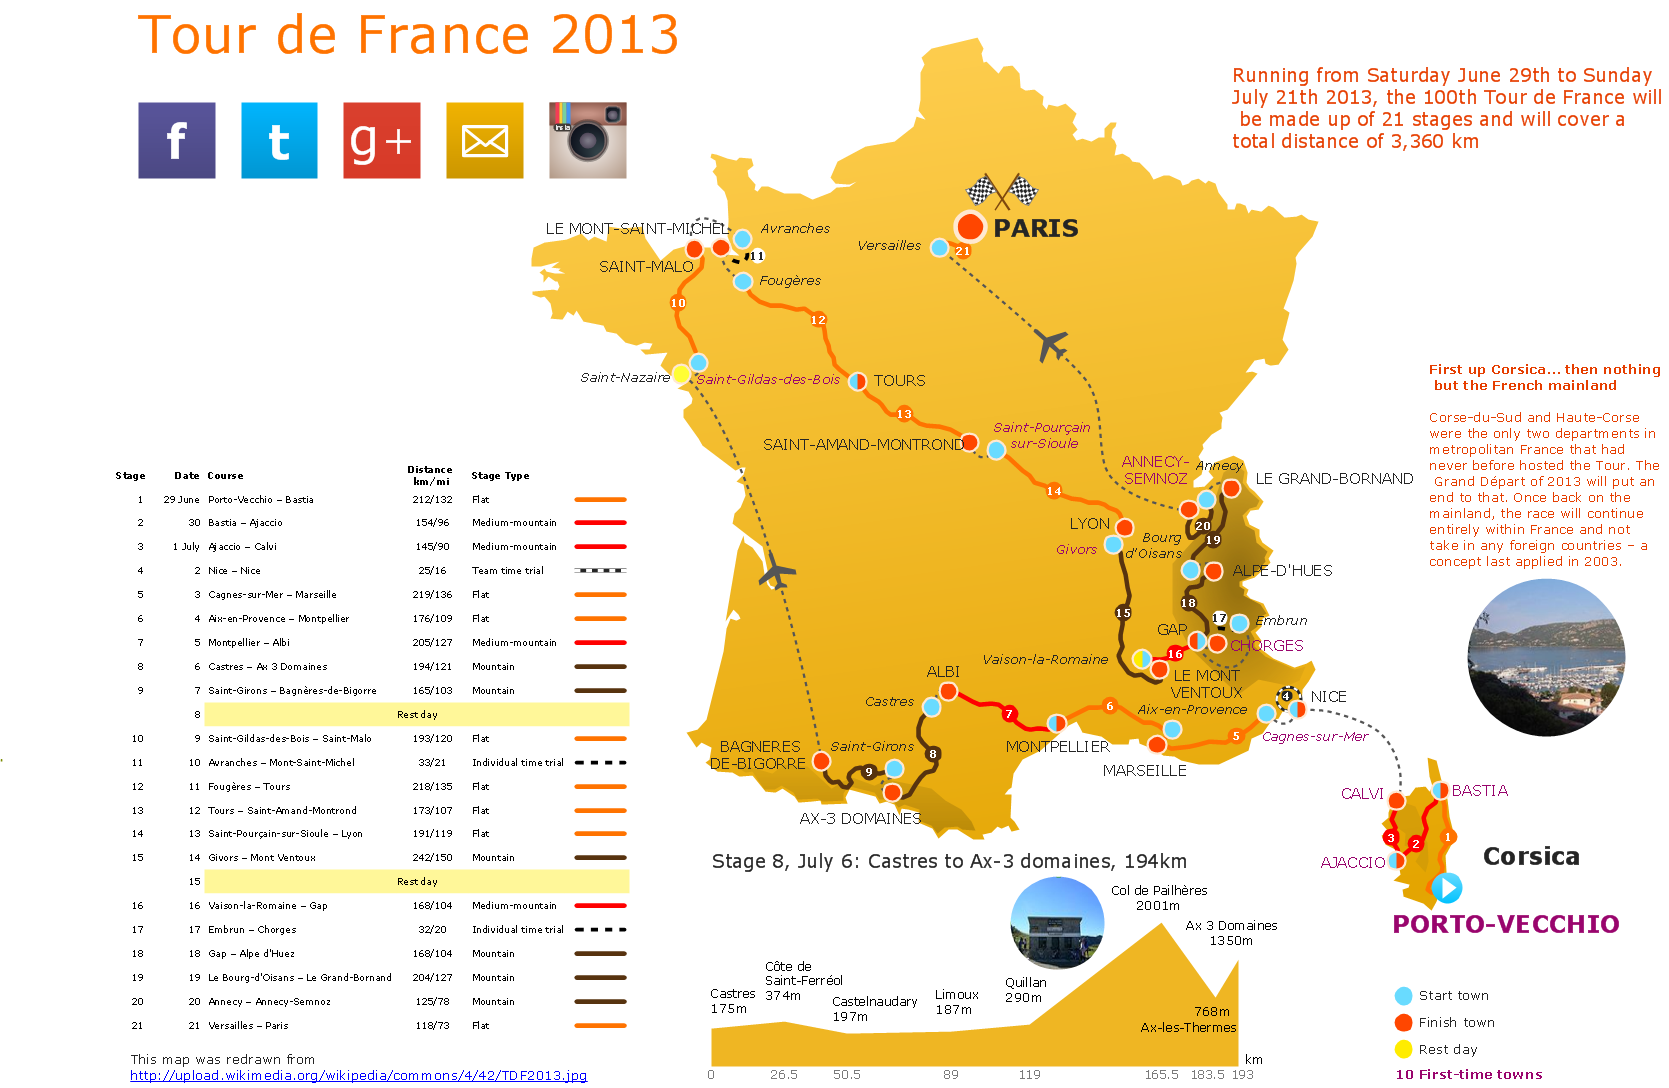
Great examples of Infographic Maps, they are needed for inspiration.Travel Infographics
Creating Travel infographics is super-easy with ConceptDraw.Winter Sports Vector Clipart. Medal Map. Spatial Infographics
Tracking Olympic results in visual format is the most modern way to deliver statistics to a broad audience. This is a good example of an illustrated table you may easily modify, print, or publish on web from ConceptDraw Winter Sports solution .Informative and Well-Designed Infographics
Informative and well-designed Infographics allows visually present various map containing information.Tools for Creating Infographics and Visualizations
ConceptDraw lets you express your professional accomplishments in a simple, but compelling personal infographics and visualizations.Map Infographic Creator
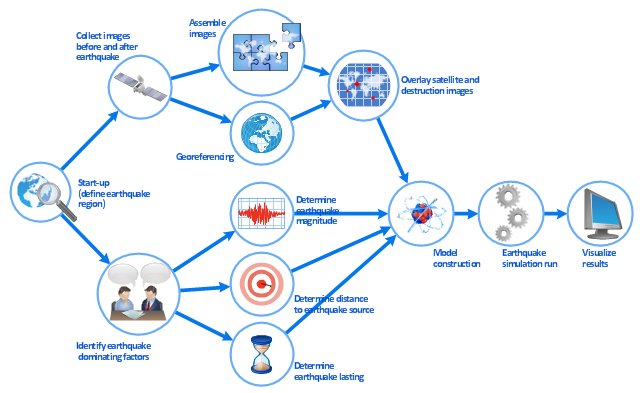
Follow samples and map templates to create nfographic maps. It's super-easy!This work flow chart sample was redesigned from the picture "Simulation for earthquake disaster assessment" from the article "Simulation Workflows".
[iaas.uni-stuttgart.de/ forschung/ projects/ simtech/ sim-workflows.php]
" This simulation was developed to have an in depth understanding of the destructions and the decisions to be made in various phases of crisis management (Source: Mahdi Hashemi and Ali A. Alesheikh (2010). "Developing an agent based simulation model for earthquakes in the context of SDI." GSDI 12 World Conference. 19 – 22 October 2010. Singapour). The simulation process contains following major steps:
(1) All spatial information including satellite images (before and after the earthquake) and topographic/ cadastral maps of the area are mosaicked and georeferenced. The parts of the city that contain various levels of destructions are selected. Three types of features namely buildings, roads and recreational areas are classified and extracted from the satellite images.
(2) The governing factors of destructions are identified; a mathematical model that integrates the factors is constructed.
(3) The simulation is constructed for various parameter values (different earthquake strength, time elapses, etc.)" [iaas.uni-stuttgart.de/ forschung/ projects/ simtech/ sim-workflows.php]
The example "Workflow diagram - Earthquake disaster assessment" was drawn using the ConceptDraw PRO diagramming and vector drawing software extended with the Workflow Diagrams solution from the Business Processes area of ConceptDraw Solution Park.
HelpDesk
How to Connect an Image to a Topic in Your Mind Map
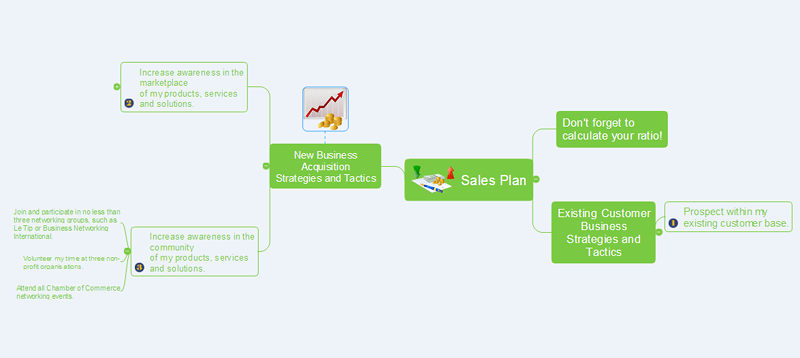
ConceptDraw MINDMAP gives a possibility to connect image to topic making your mind map more memorable and brain friendly. You can add images to any element of a map.
- Spatial Dashboard | Composition Dashboard | Frequency ...
- Business and Finance | Artwork | Sales Dashboard | Dashboard ...
- Visualization Spatial Data Using Thematic Maps Combined with ...
- Images Of Double Bar Graph
- Tools Images
- Vector Images
- Mathematical Pictures Images
- Computers and Communications | What is Infographics Area | Idea ...
- Basic Flowchart Images . Flowchart Examples | How to Draw a ...
- Presentation Clipart | Business People Clipart | Winter Sports Vector ...
- Images Of The Continent Of Europe
- Images Of Meetings
- Spatial infographics Design Elements: Transport Map | Design ...
- Spatial Infographics
- Earthquake disaster assessment - Workflow diagram | Weather ...
- Road Transport Images
- Arrows - Vector clipart library | Winter Sports Vector Clipart. Medal ...
- Best Tool for Infographic Construction | Spatial Infographics | What ...
- Workflow diagram - Earthquake disaster assessment | Audit failure ...
- How to Draw a Good Diagram of a Business Workflow? | Workflow ...


