Basic Flowchart Symbols and Meaning
Flowcharts are the best for visually representation the business processes and the flow of a custom-order process through various departments within an organization. ConceptDraw PRO diagramming and vector drawing software extended with Flowcharts solution offers the full set of predesigned basic flowchart symbols which are gathered at two libraries: Flowchart and Flowcharts Rapid Draw. Among them are: process, terminator, decision, data, document, display, manual loop, and many other specific symbols. The meaning for each symbol offered by ConceptDraw gives the presentation about their proposed use in professional Flowcharts for business and technical processes, software algorithms, well-developed structures of web sites, Workflow diagrams, Process flow diagram and correlation in developing on-line instructional projects or business process system. Use of ready flow chart symbols in diagrams is incredibly useful - you need simply drag desired from the libraries to your document and arrange them in required order. There are a few serious alternatives to Visio for Mac, one of them is ConceptDraw PRO. It is one of the main contender with the most similar features and capabilities.
Cross-Functional Flowchart
Use of Cross-Functional Flowchart is a clear way of showing each team member’s responsibilities and how processes get shared or transferred between different responsible people, teams and departments. Use the best flowchart maker ConceptDraw PRO with a range of standardized cross-functional flowchart symbols to create the Cross-Functional Flowcharts simply and to visualize the relationship between a business process and the functional units responsible for that process. To draw the most quickly Cross-Functional Flowcharts, Cross Functional Process Maps, or Cross Functional Process Flow Diagrams, start with a Cross-functional flowchart samples and templates from ConceptDraw Solution Park. The ConceptDraw Arrows10 and RapidDraw technologies will be also useful for you in drawing. ConceptDraw PRO supports designing both types - horizontal and vertical Cross-functional flowcharts. A vertical layout makes the accents mainly on the functional units while a horizontal layout - on the process. If you need a Visio alternative in Mac OS X, try ConceptDraw PRO. Its interface is very intuitive and it’s actually much easier to use than Visio, yet somehow it’s just as powerful if not more so. ConceptDraw PRO performs professional quality work and seamless Visio interaction.
Functional Organizational Structure
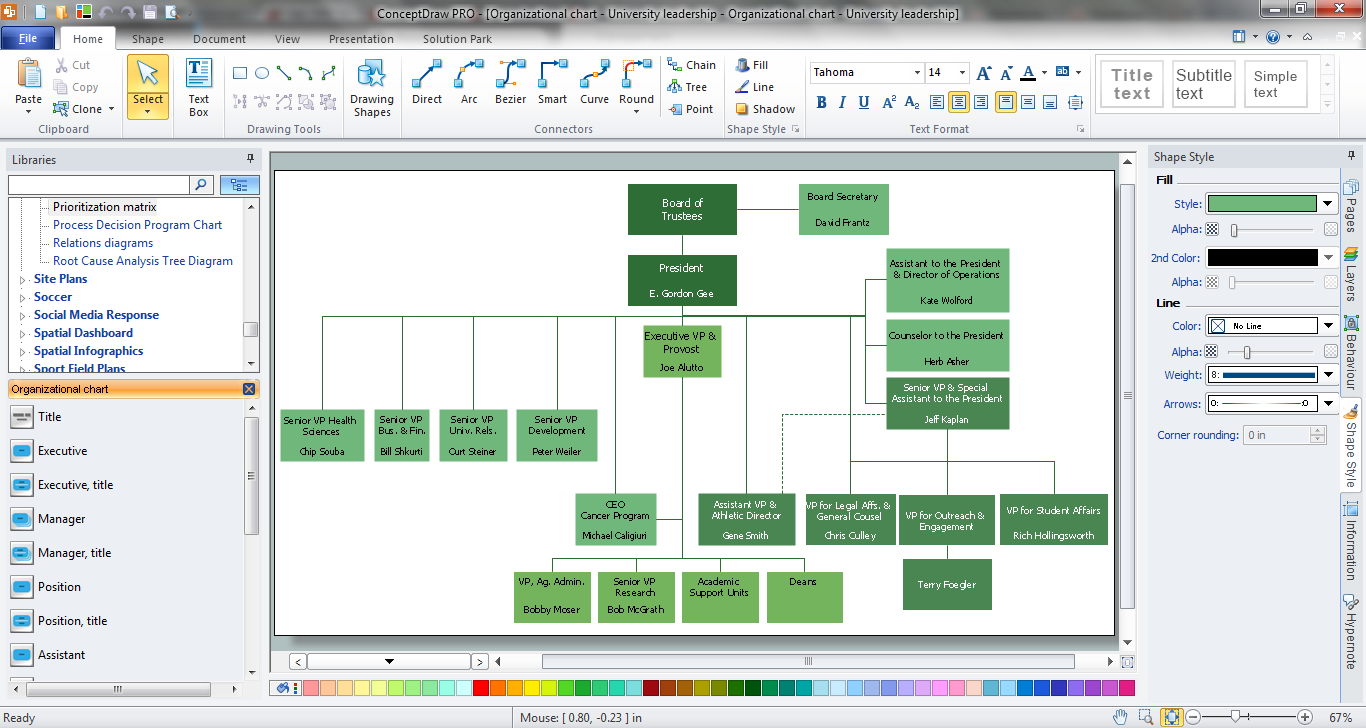
A functional organizational structure is a structure that consists of activities such as coordination, supervision and task allocation. You want to draw a functional organizational structure and look for the helpful software for this? Pay attention for the ConceptDraw PRO software! Extended with Organizational Charts Solution from the Management Area, it is ideal for functional organizational structure development.Computer Network. Computer and Network Examples
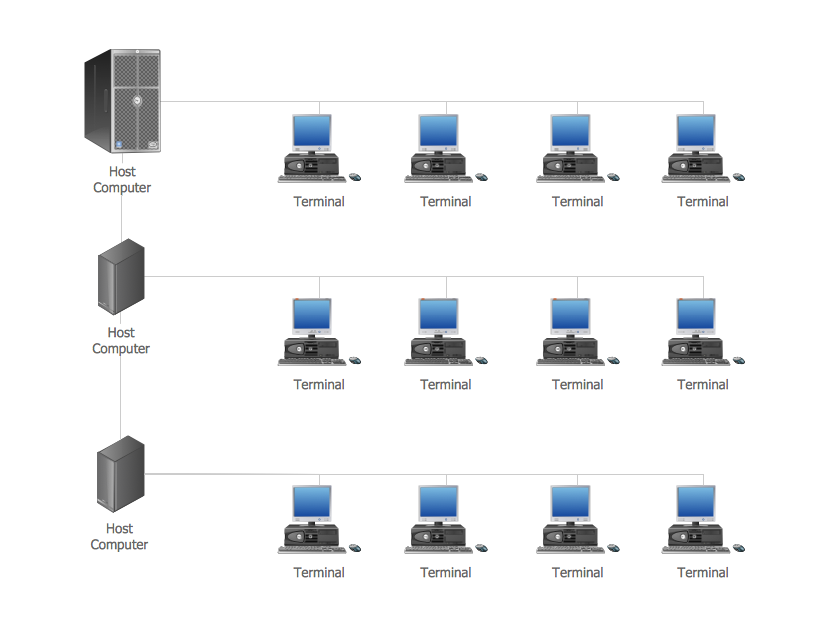
A Computer Network is a telecommunication network containing the set of nodes (computer network devices, such as computers, phones, servers) and allows them exchange the data using the network links. There are many kinds of computer networks. The primary difference is their size, according to the scale they can be classified as: Local area network (LAN), Metropolitan area network (MAN), Global Area Network (GAN), Wide area network (WAN), Storage area network (SAN), Campus area network (CAN), Personal area network (PAN). Computer networks also differ by connection method according to the used hardware technology (Ethernet, Wireless LAN, Optical fiber, HomePNA, Power line communication), by functional relationships that exist between network elements (Client-server, Active Networking, Peer-to-peer), by network topology (Tree computer network, Bus network, Star network, Ring network, Mesh network, etc.). Solutions of Computer and Networks Area from ConceptDraw Solution Park contain powerful drawing tools for easy designing diagrams for any Computer Network from listed diversity.
Six Markets Model Chart
This sample shows the Six Markets Model Chart. It was created in ConceptDraw PRO diagramming and vector drawing software using the Marketing Diagrams Solution from the Marketing area of ConceptDraw Solution Park. The six markets model defines six markets that take the central place in the relationship marketing: internal markets, supplier markets, recruitment markets, referral markets, influence markets and customer markets. The six markets model allows the organization to analyze the stakeholders and key market domains that can be important to it. This model used in marketing project management software for small business project management.ConceptDraw PRO Network Diagram Tool
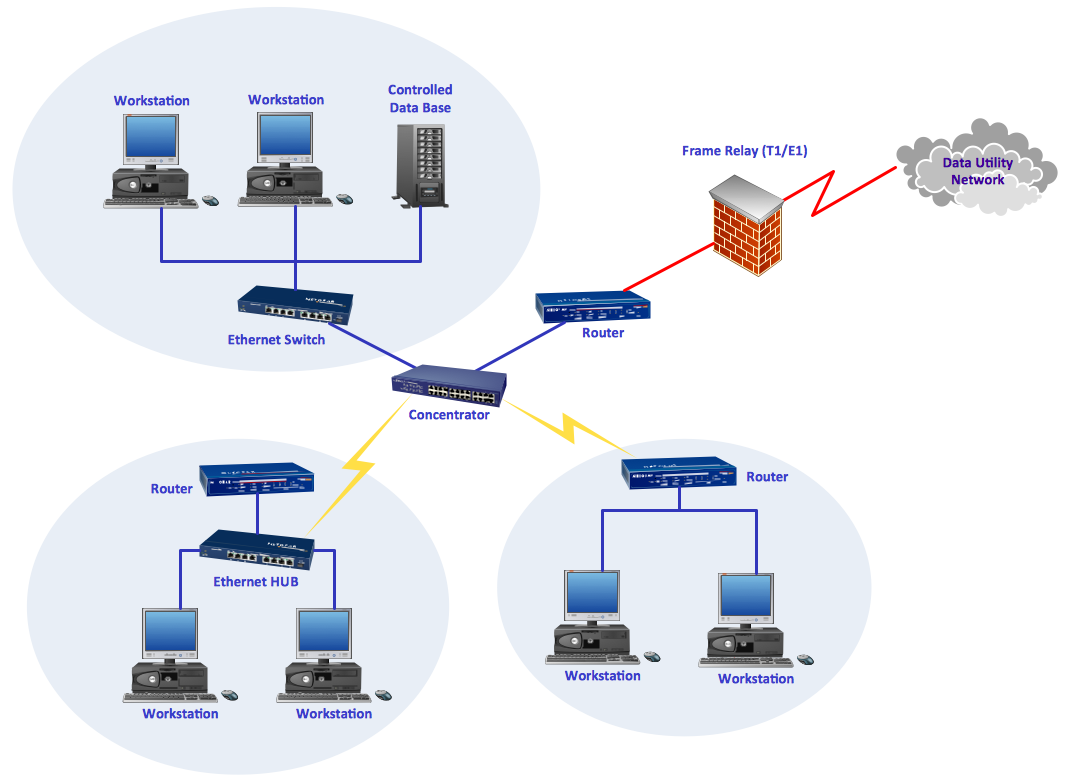
Computer network diagrams visually depict the nodes of computer networks and connections between them. Diversity of Network Diagrams includes Wireless network diagrams, Network wiring diagrams, LAN network diagrams, Network WAN diagrams, Network topology diagrams, Network cable diagrams, Logical network diagrams, Network security diagrams, Diagram home network, Network physical diagrams, Activity network diagrams, and many others. To construct any of them it is useful to apply a special software with effective network diagramming tools. ConceptDraw PRO is ideal and powerful network diagram tool. It helps you diagram a network or create Computer network diagrams of various types using specialized and task-specific libraries of network components such as computers, hubs, switches, servers, routers, smart connectors, printers, mainframes, face plates, etc. that simulate network architectures, network design topologies and devices (all these shapes are parts of network diagram tool ConceptDraw PRO).
- How to Draw a Computer Network Diagrams | Process Flowchart ...
- DFD Library System | Data Flow Diagram Symbols. DFD Library ...
- Yourdon and Coad Diagram | Data Flow Diagram Process | Data ...
- DFD, Yourdon and Coad notation - Vector stencils library | DFD ...
- Basic Flowchart Symbols and Meaning | Process Flowchart ...
- Data Flow Diagram Process | Yourdon and Coad Diagram | DFD ...
- Yourdon and Coad Diagram | DFD, Yourdon and Coad notation ...
- Design Data Flow . DFD Library | DFD, Yourdon and Coad notation ...
- Basic Flowchart Symbols and Meaning | UML Flowchart Symbols ...
- Basic Flowchart Symbols and Meaning | Entity Relationship ...
- DFD Library System | Data Flow Diagram Symbols. DFD Library ...
- Program Structure Diagram | Venn Diagram Examples for Problem ...
- DFD, Yourdon and Coad notation - Vector stencils library | Data ...
- Data Flow Diagram Symbols. DFD Library | DFD, Yourdon and Coad ...
- Yourdon and Coad Diagram | Data Flow Diagram Examples | DFD ...
- Data Flow Diagram Symbols. DFD Library
- Basic Flowchart Symbols and Meaning | Design elements - TQM ...
- Process Flowchart | Structured Systems Analysis and Design ...
- Example of DFD for Online Store (Data Flow Diagram ) DFD ...


