HelpDesk
How to Create a Timeline Diagram in ConceptDraw PRO
A Timeline is a chart which displays a project plan schedule in chronological order. A Timeline is used in project management to depict project milestones and visualize project phases, and show project progress. The graphic form of a timeline makes it easy to understand critical project milestones, such as the progress of a project schedule. Timelines are particularly useful for project scheduling or project management when accompanied with a Gantt chart. It captures the main of what the project will accomplish and how it will be done. making a project timeline is one of the most important skills a project manager needs have. Making comprehensive, accurate timelines allows you getting every project off in the best way. ConceptDraw PRO allows you to draw a timeline charts using special library.HelpDesk
How to Connect Objects in ConceptDraw PRO on PC
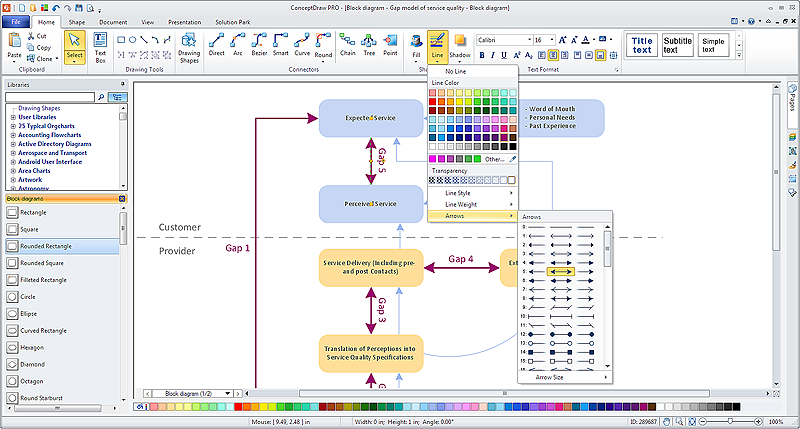
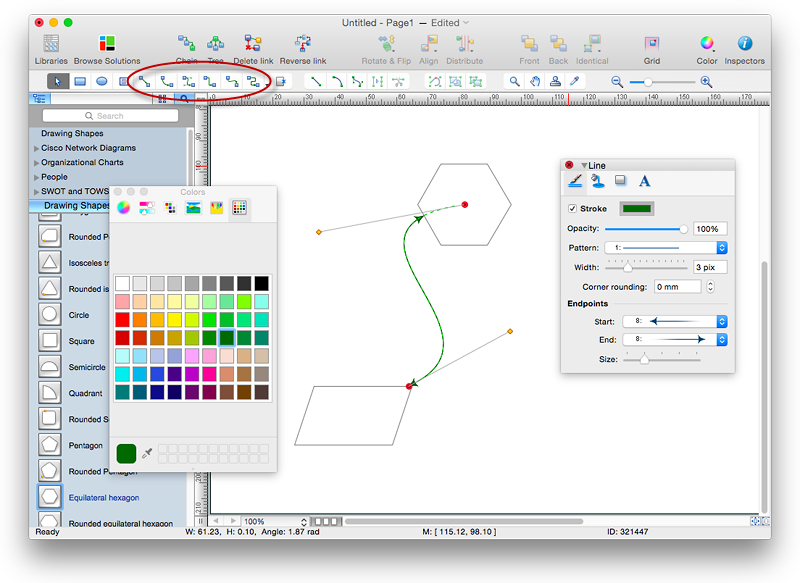
ConceptDraw PRO provides a few options for drawing connections between objects: Direct Connectors, Smart, Arc, Bezier, Curve and Round Connectors. You can connect objects in your ConceptDraw diagram with proper connectors using the embedded automatic connection modes. This article describes how you can connect objects with connectors and how you can ascribe different types and behaviors.
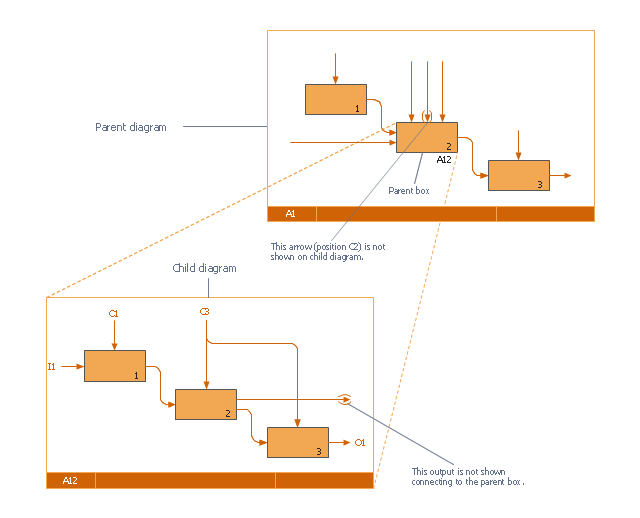
This IDEF0 diagram was redesigned from the Wikimedia Commons file: 18 Example of Tunneled Arrows.svg.
[commons.wikimedia.org/ wiki/ File:18_ Example_ of_ Tunneled_ Arrows.svg]
"Tunneled Arrows.
Arrows that provide information at one level of decomposition but are not needed at another (parent, child) level." [classes.engr.oregonstate.edu/ mime/ fall2013/ ie545-001/ Slides/ class%20 01-3b%20 IDEF0%20 1%20 revised.pdf]
The example "IDEF0 diagram - Tunneled arrows" was created using the ConceptDraw PRO diagramming and vector drawing software extended with the solution "IDEF Business Process Diagrams" from the area "Business Processes" of ConceptDraw Solution Park.
HelpDesk
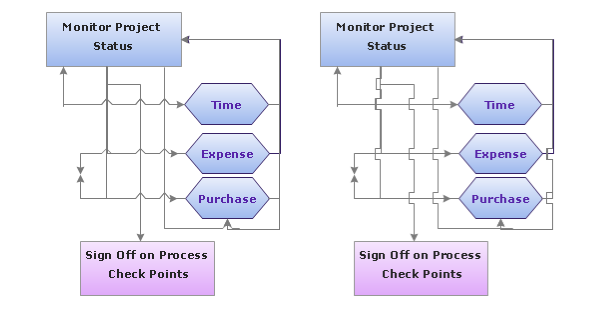
How to Set Line Jumps for Smart Connectors in ConceptDraw PRO
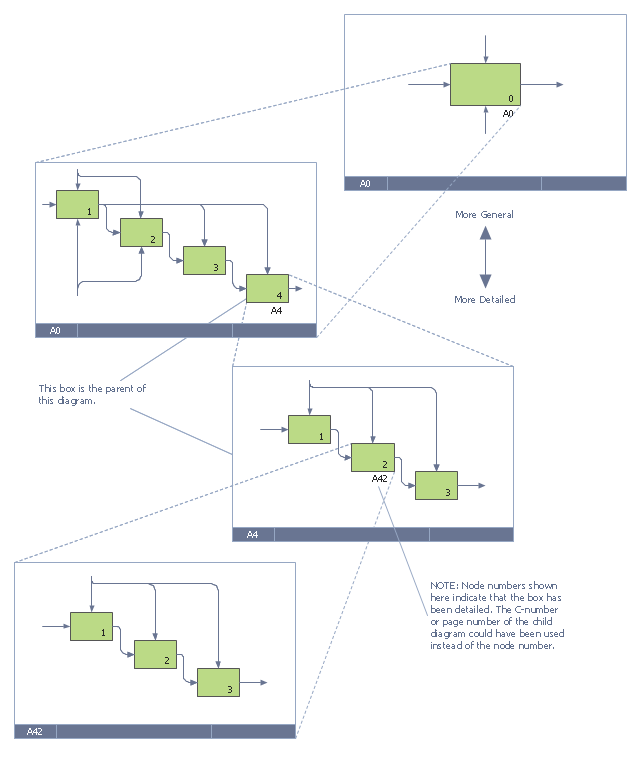
Connecting objects in ConceptDraw PRO is an easy task. You can use Chain, or Tree connection mode for automatic connection of multiple objects. Besides the automatic connection modes, ConceptDraw PRO offers few options to connect objects manually: Direct, Arc, Bezier, Smart, Curve and Round Connectors. You can make them square, arched or angled and also set vertical or horizontal orientation Thus, you can control how the jumps and orientation occurs on smart connectors. When two smart connectors cross each other you can control how the two intersecting lines look.This IDEF0 diagram example was redesigned from the Wikimedia Commons file: 6 Decomposition Structure.svg.
[commons.wikimedia.org/ wiki/ File:6_ Decomposition_ Structure.svg]
"Functional decomposition refers broadly to the process of resolving a functional relationship into its constituent parts in such a way that the original function can be reconstructed (i.e., recomposed) from those parts by function composition. In general, this process of decomposition is undertaken either for the purpose of gaining insight into the identity of the constituent components (which may reflect individual physical processes of interest, for example), or for the purpose of obtaining a compressed representation of the global function, a task which is feasible only when the constituent processes possess a certain level of modularity (i.e., independence or non-interaction). Interactions between the components are critical to the function of the collection. All interactions may not be observable, but possibly deduced through repetitive perception, synthesis, validation and verification of composite behavior." [Functional decomposition. Wikipedia]
The example "IDEF0 diagram - Decomposition structure" was created using the ConceptDraw PRO diagramming and vector drawing software extended with the solution "IDEF Business Process Diagrams" from the area "Business Processes" of ConceptDraw Solution Park.
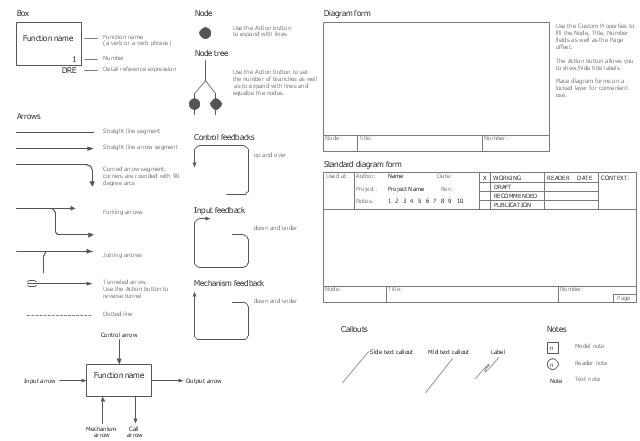
The vector stencils library "IDEF0" contains 26 IDEF0 diagram symbols.
Use it for business process modeling with IDEF0 diagrams.
"The IDEF0 model ... is based on a simple syntax. Each activity is described by a verb-based label placed in a box. Inputs are shown as arrows entering the left side of the activity box while output are shown as exiting arrows on the right side of the box. Controls are displayed as arrows entering the top of the box and mechanisms are displayed as arrows entering from the bottom of the box. Inputs, Controls, Outputs, and Mechanisms are all referred to as concepts.
- Arrow: A directed line, composed of one or more arrow segments, that models an open channel or conduit conveying data or objects from source (no arrowhead) to use (with arrowhead). There are 4 arrow classes: Input Arrow, Output Arrow, Control Arrow, and Mechanism Arrow (includes Call Arrow). See Arrow Segment, Boundary Arrow, Internal Arrow.
- Box: A rectangle, containing a name and number, used to represent a function.
- Context: The immediate environment in which a function (or set of functions on a diagram) operates.
- Decomposition: The partitioning of a modeled function into its component functions.
- Fork: The junction at which an IDEF0 arrow segment (going from source to use) divides into two or more arrow segments. May denote unbundling of meaning.
- Function: An activity, process, or transformation (modeled by an IDEF0 box) identified by a verb or verb phrase that describes what must be accomplished.
- Join: The junction at which an IDEF0 arrow segment (going from source to use) merges with one or more other arrow segments to form a single arrow segment. May denote bundling of arrow segment meanings.
- Node: A box from which child boxes originate; a parent box. See Node Index, Node Tree, Node Number, Node Reference, Diagram Node Number." [IDEF0. Wikipedia]
The shapes example "Design elements - IDEF0" was created using the ConceptDraw PRO diagramming and vector drawing software extended with the solution "IDEF Business Process Diagrams" from the area "Business Processes" of ConceptDraw Solution Park.
HelpDesk
How to Connect Objects in ConceptDraw PRO on Mac
ConceptDraw PRO provides a few options for drawing connections between. This article describes how you can connect objects with connectors and how you can ascribe different types and behaviors.
ConceptDraw Arrows10 Technology
You want to connecting objects manually? You don't know how should diagramming software work? Is it possible to develop a diagram as quickly as the ideas come to you? Yes. The innovative ConceptDraw Arrows10 Technology - This is more than enough versatility to draw any type of diagram with any degree of complexity. You can start draw your diagram manually now.
 Scatter Diagrams
The Scatter Diagrams solution extends ConceptDraw PRO v10 functionality with templates, samples, and a library of vector stencils that make construction of a Scatter Plot easy. The Scatter Chart Solution makes it easy to design attractive Scatter Diagrams used in various fields of science, work, and life activities. ConceptDraw PRO lets you enter the data to the table and construct the Scatter Plot Graph automatically according to these data.
 Line Graphs
How to draw a Line Graph with ease? The Line Graphs solution extends the capabilities of ConceptDraw PRO v10 with professionally designed templates, samples, and a library of vector stencils for drawing perfect Line Graphs.
- Straight Line Mechanism Block Diagram
- Straight Line Method Algorithm And Flowchart In Maths
- How I Represent Dashed Line Notation In Straight Line
- Entity Relationship Diagram Symbols | ERD Symbols and Meanings ...
- Algorithm And Flowchart Examples For Straight Line
- Single Line Diagram Of Business Park
- Straight Line Plan Diagram
- Flow Chart And Algorithm Of Straight Line
- Simple Stright Line Workflow Diagram
- Business Process Workflow Diagram | Floor Plans | Business ...
- Samples Of Straight Lines
- Algorithm And Flow Chart Of Straight Line
- Line Chart Examples | Types of Flowchart - Overview | Basic ...
- Line Chart Examples | Line Graph | Pictures of Graphs | Population ...
- Types Of Polygon With Diagram
- Arrow And Line Diagrams
- Line Graph Connectors
- Design elements - Line graphs | Design elements - UML class ...
- IDEF0 diagram - Decomposition structure

