HelpDesk
How to Set Line Jumps for Smart Connectors in ConceptDraw PRO

Line Chart Examples

Line Graph

Line Chart Templates

Line Chart

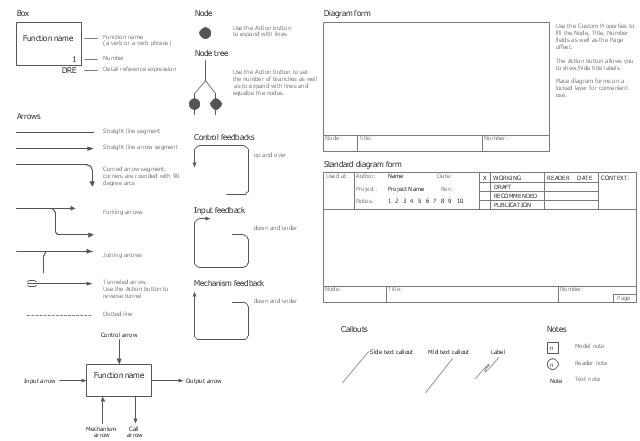
This vector stencils library contains 26 IDEF0 diagram symbols.
Use it for business process modeling with IDEF0 diagrams using ConceptDraw PRO diagramming and vector drawing tools.
The vector stencils library "IDEF0" is included in the IDEF Business Process Diagrams solution from the Business Processes area of ConceptDraw Solution Park.
Use it for business process modeling with IDEF0 diagrams using ConceptDraw PRO diagramming and vector drawing tools.
The vector stencils library "IDEF0" is included in the IDEF Business Process Diagrams solution from the Business Processes area of ConceptDraw Solution Park.
Box
Label

Side text callout

Mid text callout
Model note

Reader note
Text note

Node

Diagram form

Standard diagram form
Straight line segment

Straight line arrow segment
Curved arrow segment
Tunneled arrow
Dotted line

Input arrow
Output arrow
Control arrow
Mechanism arrow
Call arrow
Forking arrows

Joining arrows

Control feedback - up and over

Input feedback - down and under

Mechanism feedback - down and under

Node tree
HelpDesk
How to Connect Objects in ConceptDraw PRO on PC

Smart, Arc, Bezier, Curve and Round Connectors. You can connect objects in your ConceptDraw diagram with proper connectors using the embedded automatic connection modes. This article describes how you can connect objects with connectors and how you can ascribe different types and behaviors.

This vector stencils library contains 26 IDEF0 diagram symbols.
Use it for business process modeling with IDEF0 diagrams using ConceptDraw PRO diagramming and vector drawing tools.
The vector stencils library "IDEF0" is included in the IDEF Business Process Diagrams solution from the Business Processes area of ConceptDraw Solution Park.
Use it for business process modeling with IDEF0 diagrams using ConceptDraw PRO diagramming and vector drawing tools.
The vector stencils library "IDEF0" is included in the IDEF Business Process Diagrams solution from the Business Processes area of ConceptDraw Solution Park.
Box
Label
Side text callout
Mid text callout
Model note
Reader note
Text note
Node
Diagram form
Standard diagram form
Straight line segment
Straight line arrow segment
Curved arrow segment
Tunneled arrow
Dotted line
Input arrow
Output arrow
Control arrow
Mechanism arrow
Call arrow
Forking arrows
Joining arrows
Control feedback - up and over
Input feedback - down and under
Mechanism feedback - down and under
Node tree
What Is a Line Chart

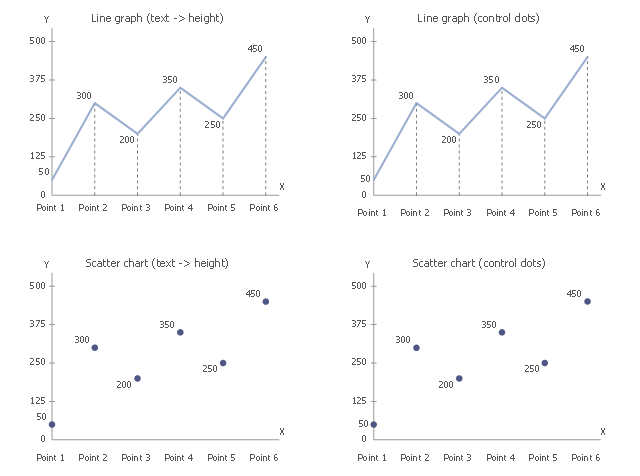
The vector stencils library "Line Graphs" contains 4 chart templates. Use it to design your line charts in ConceptDraw PRO diagramming and vector drawing software.
"A line chart or line graph is a type of chart which displays information as a series of data points connected by straight line segments. It is a basic type of chart common in many fields. It is similar to a scatter plot except that the measurement points are ordered (typically by their x-axis value) and joined with straight line segments. A line chart is often used to visualize a trend in data over intervals of time – a time series – thus the line is often drawn chronologically." [Line chart. Wikipedia]
The templates example "Design elements - Line graphs" is included in the Basic Line Graphs solution from the Graphs and Charts area of ConceptDraw Solution Park.
Chart templates
 Line Graphs
How to draw a Line Graph with ease? The Line Graphs solution extends the capabilities of ConceptDraw PRO v10 with professionally designed templates, samples, and a library of vector stencils for drawing perfect Line Graphs.
The vector stencils library "Transmission paths" contains 43 symbols of power transmission paths, electronic circuits, bus connectors and elbows, terminals, junctions, and concentrators.
Use it to annotate electrical diagrams, electronic schematics and circuit diagrams in the ConceptDraw PRO diagramming and vector drawing software extended with the Electrical Engineering solution from the Engineering area of ConceptDraw Solution Park.
www.conceptdraw.com/ solution-park/ engineering-electrical
2-line bus

3-line bus 2

4-line bus

8-line bus

2-line bus elbow

3-line bus elbow 2

4-line bus elbow

8-line bus elbow

3-line bus

3-line bus elbow

4-line bus 2

8-line bus 2

4-line bus elbow 2

8-line bus elbow 2
Point

Terminal

Terminal 3-phase

Label

Flow direction, right
Flow direction, left
Flow direction, inward

Flow direction, outward
Transmission path

Line, overhead

Line, underground

Line, submarine

Line, loaded

Line, coaxial
Cable group
Lead group

Anticreep device
Line concentrator
Overground enclosure
Overground enclosure 2

Optical fiber

Optical fiber 2

Straight bus
Straight bus 2
Elbow bus

Elbow bus 2

Elbow bus 3

Elbow bus 4

Bus width
HelpDesk
How to Create a Timeline Diagram in ConceptDraw PRO

HelpDesk
How to Connect Objects in ConceptDraw PRO on Mac

The vector stencils library "IDEF0" contains 26 IDEF0 diagram symbols.
Use it for business process modeling with IDEF0 diagrams.
"The IDEF0 model ... is based on a simple syntax. Each activity is described by a verb-based label placed in a box. Inputs are shown as arrows entering the left side of the activity box while output are shown as exiting arrows on the right side of the box. Controls are displayed as arrows entering the top of the box and mechanisms are displayed as arrows entering from the bottom of the box. Inputs, Controls, Outputs, and Mechanisms are all referred to as concepts.
- Arrow: A directed line, composed of one or more arrow segments, that models an open channel or conduit conveying data or objects from source (no arrowhead) to use (with arrowhead). There are 4 arrow classes: Input Arrow, Output Arrow, Control Arrow, and Mechanism Arrow (includes Call Arrow). See Arrow Segment, Boundary Arrow, Internal Arrow.
- Box: A rectangle, containing a name and number, used to represent a function.
- Context: The immediate environment in which a function (or set of functions on a diagram) operates.
- Decomposition: The partitioning of a modeled function into its component functions.
- Fork: The junction at which an IDEF0 arrow segment (going from source to use) divides into two or more arrow segments. May denote unbundling of meaning.
- Function: An activity, process, or transformation (modeled by an IDEF0 box) identified by a verb or verb phrase that describes what must be accomplished.
- Join: The junction at which an IDEF0 arrow segment (going from source to use) merges with one or more other arrow segments to form a single arrow segment. May denote bundling of arrow segment meanings.
- Node: A box from which child boxes originate; a parent box. See Node Index, Node Tree, Node Number, Node Reference, Diagram Node Number." [IDEF0. Wikipedia]
The shapes example "Design elements - IDEF0" was created using the ConceptDraw PRO diagramming and vector drawing software extended with the solution "IDEF Business Process Diagrams" from the area "Business Processes" of ConceptDraw Solution Park.
IDEF0 diagram symbols
- Labels Lines Png
- Goods And Services Png
- Downward Straight Line Clipart
- Instagram Vector Png
- Pentagon Png
- Line Chart Examples | Line Graph Charting Software | Chart ...
- Animal Stencils Png
- Polygon types | Common joint types | Basic Flowchart Symbols and ...
- Basic Line Graphs | Menus - Vector stencils library | Vertical Cross ...
- Common joint types | Polygon types | Basic Flowchart Symbols and ...
- Straight line segment
- Line Graphs | Line Graph Charting Software | How to Draw a Line ...
- Ecosystem goods and services - Segmented pyramid diagram ...
- Last resort hotel book room process - DFD | Process Flowchart ...
- Line Chart Examples | Line Chart Template for Word | How to Create ...
- Line Graph | Design elements - Line graphs | How to Draw a Line ...
- How to Draw a Line Chart Quickly | How to Create a Line Chart ...
- Line Graph Charting Software | Line Chart Examples | Line Chart ...
- Line Graphs
- Line Chart Templates