Value Stream Diagram
The new Value Stream Mapping solution found in the ConceptDraw Solution Park continues to extend the range of ConceptDraw PRO into a business graphics tool.Quality Engineering Diagrams
Create Quality Engineering Diagrams (value stream maps) - for value stream analysis and value stream management, material and information flow mapping, using our quick start templates included with ConceptDraw.The Lean Enterprise Value Stream Mapping
Create value stream maps - for value stream analysis and value stream management, material and information flow mapping, using our quick start templates included with ConceptDraw.HelpDesk
How to Create a VSM Diagram Using ConceptDraw Value Stream Mapping Solution
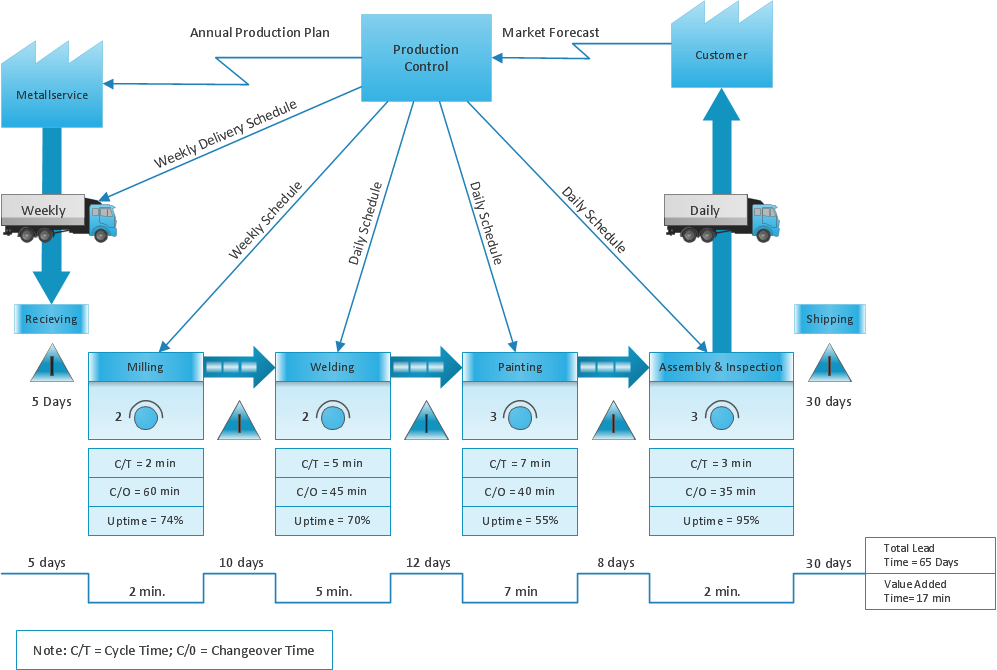
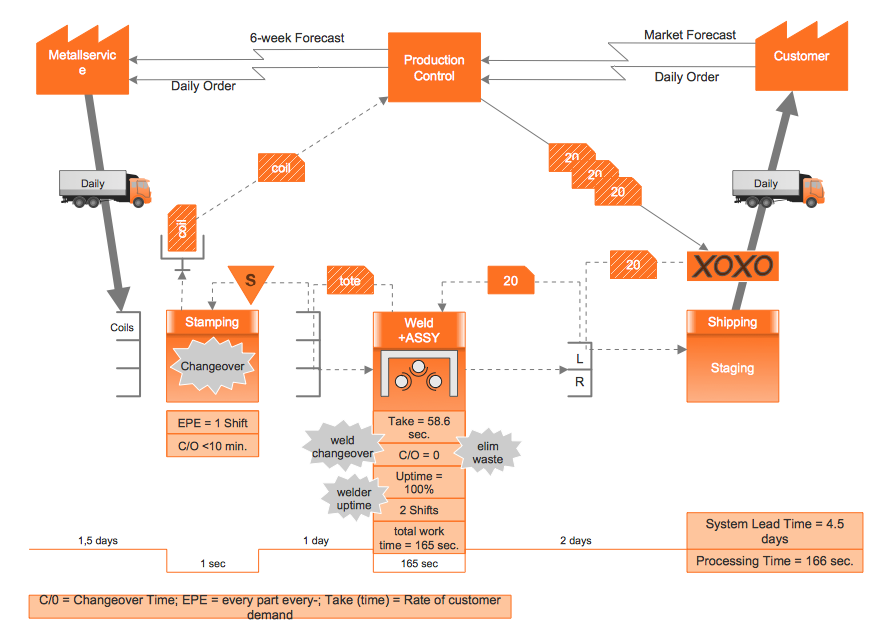
Value Stream Mapping is a Lean Manufacturing tool that uses a flow diagram to document in great detail every step of a manufacturing process. This graphical representation of a process is a powerful tool that helps in the diagnosis of process efficiency and allows companies to develop improved processes. Many lean practitioners use Value Stream Mapping as a fundamental tool to identify waste, cut process cycle times, and implement process improvement. Many organizations use value stream mapping as a key portion of their lean efforts. Value Stream Maps are used to analyze and design the flow of materials and information required to bring a product or service to a consumer. You can create a Value Stream Mapping flowchart using ConceptDraw PRO tools.
 Event-driven Process Chain Diagrams
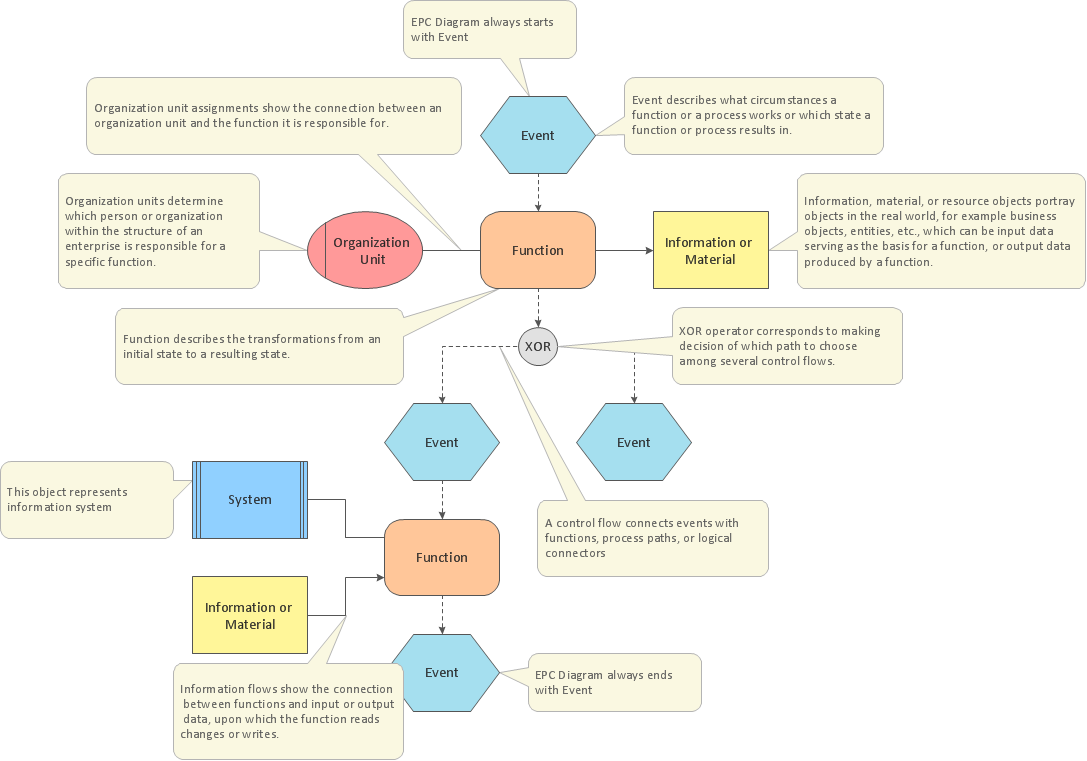
Event-driven Process Chain (EPC) Diagram is a type of flowchart widely used for modeling in business engineering and reengineering, business process improvement, and analysis. EPC method was developed within the Architecture of Integrated Information Systems (ARIS) framework.
 Value Stream Mapping
Value stream mapping solution extends ConceptDraw PRO software with templates, samples and vector stencils for drawing the Value Stream Maps (VSM) in lean manufacturing practice.
Types of Flowcharts
A Flowchart is a graphical representation of process, algorithm, workflow or step-by-step solution of the problem. It shows the steps as boxes of various kinds and connects them by arrows in a defined order depicting a flow. There are twelve main Flowchart types: Basic Flowchart, Business Process Modeling Diagram (BPMN), Cross Functional Flowchart, Data Flow Diagram (DFD), IDEF (Integrated DEFinition) Flowchart, Event-driven Process Chain (EPC) Diagram, Influence Diagram (ID), Swimlane Flowchart, Process Flow Diagram (PFD), Specification and Description Language (SDL) Diagram, Value Stream Mapping, Workflow Diagram. Using the Flowcharts solution from the Diagrams area of ConceptDraw Solution Park you can easy and quickly design a Flowchart of any of these types. This solution offers a lot of special predesigned vector symbols for each of these widely used notations. They will make the drawing process of Flowcharts much easier than ever. Pay also attention for the included collection of ready Flowchart examples, samples and quick-start templates. This is business process improvement tools. If you are looking for MS Visio for your Mac, then you are out of luck, because it hasn't been released yet. However, you can use Visio alternatives that can successfully replace its functions. ConceptDraw PRO is an alternative to MS Visio for Mac that provides powerful features and intuitive user interface for the same.
Types of Flowchart - Overview
When designing a process or an instruction in clear and understandable way, you should consider creating a flowchart. You can avoid spending a lot of time understanding complex concepts as they get clear with different diagrams. The flowcharts are very popular diagram type, they are useful at different fields from the description business processes to the presentation of cooking recipes. Basic Flowchart, Business Process Modeling Diagram, Process Flowchart, Cross Functional Flowchart, Procedure Flowchart, Data Flow Diagram, IDEF Flowchart, SDL Diagram, Workflow Diagram, Document Flowchart, Program Flowchart, Value Stream Map, System Flowchart, Highlight Flowchart, Sales Flowchart are the main types flowchart. The ConceptDraw PRO is one of the professional applications which has great advantages and using which you can create different types of Flowcharts easy and fast. Try to draw an illustrative and comprehensible diagram in ConceptDraw PRO describing the processes instead of writing complex long text and make sure how it is convenient. Visio is expensive, and if you use it in a team environment, these costs are compounded. ConceptDraw PRO is an affordable alternative to Visio and luckily, it comes with a team plan. ConceptDraw PRO can import and export Visio files, so Mac users can collaborate with PC users stuck on Microsoft's software.
Business Process Modeling with EPC
Event-Driven Process Chain Diagrams for improvement throughout an organisation. ConceptDraw PRO - software that reduces the time needed to create a business process model.Sentence Diagram
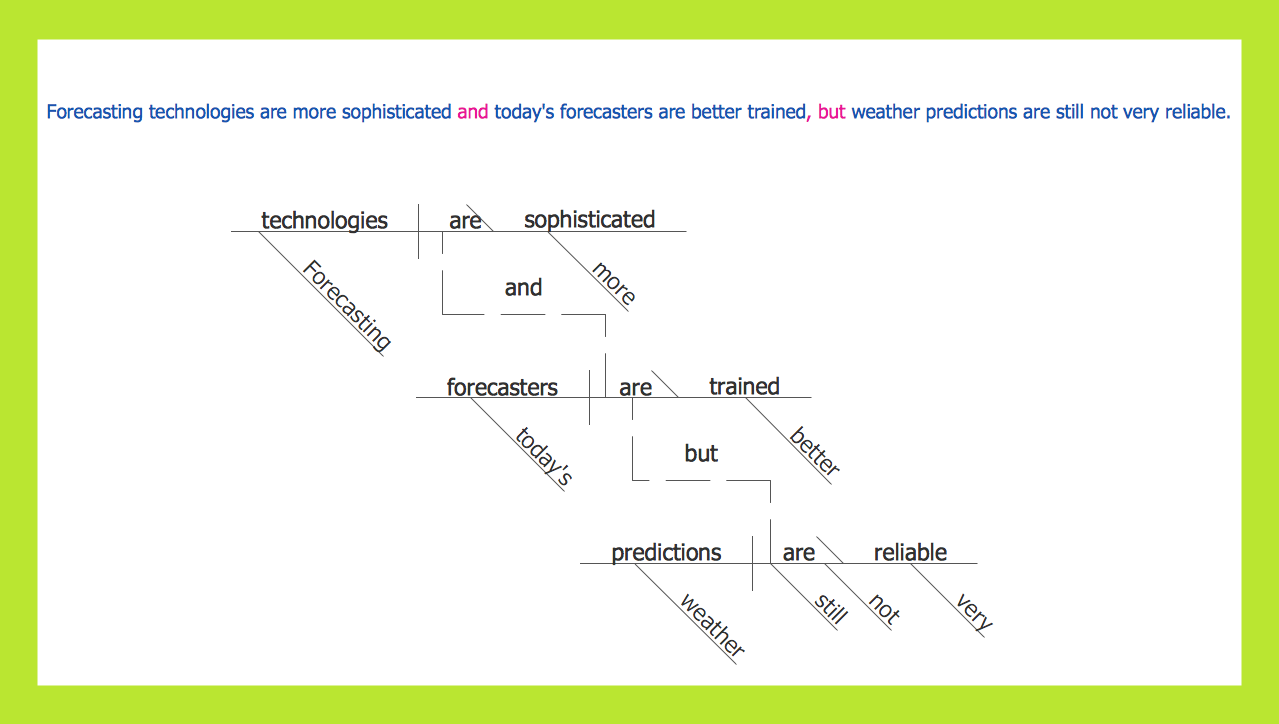
In pedagogy and theoretical syntax, a sentence diagram or parse tree is a pictorial representation of the grammatical structure of a sentence. The term "sentence diagram" is used more in pedagogy, where sentences are diagrammed. ConceptDraw PRO diagramming and vector drawing software extended with Language Learning solution from the Science and Education area is ideal for quick and easy drawing sentence diagrams of any complexity.SIPOC Diagram
SIPOC is a tool that summarizes the inputs and outputs of one or more processes in table form. You need to draw professional looking SIPOC Diagram quick and easy? Pay please your attention on ConceptDraw PRO diagramming and vector drawing software. Extended with Business Process Mapping Solution from the Business Processes Area of ConceptDraw Solution Park, it suits ideal for this.How To Create a FlowChart using ConceptDraw
Have you ever needed a flowchart, but did not have the time or tools to build one? Rapid Draw allows you to build a professional flowchart quickly and easily. You have the ability to add your own shapes to Rapid Draw’s built in shape library.
 Entity-Relationship Diagram (ERD)
An Entity-Relationship Diagram (ERD) is a visual presentation of entities and relationships. That type of diagrams is often used in the semi-structured or unstructured data in databases and information systems. At first glance ERD is similar to a flowch
Business Processes description with ConceptDraw PRO
Business Processes description with ConceptDraw. Business-processes it allows to describe functional blocks, for example production and marketing. ConceptDraw lets creation of business processes description using IDEF0 and IDEF2 methods.
 ConceptDraw Solution Park
ConceptDraw Solution Park collects graphic extensions, examples and learning materials
- Pyramid Diagram | 4 Level pyramid model diagram - Information ...
- Value Stream Mapping | Data Driven Model Diagram In Mis
- 4 Level pyramid model diagram - Information systems types | Value ...
- Data Flow Diagram Model | Lean Manufacturing Diagrams | Value ...
- Best Value Stream Mapping mac Software | Circuits and Logic ...
- Entity-Relationship Diagram (ERD) | Value Stream Mapping ...
- Pyramid Diagram | Process Flowchart | Value Stream Mapping ...
- Lean Manufacturing Diagrams | Value- Stream Mapping for ...
- Data Flow Diagram Streaming
- What is Value Stream Mapping? | Process Flowchart | Value Stream ...
- Business Process Modeling Software for Mac | Process Flowchart ...
- Best Value Stream Mapping mac Software | Process Flowchart ...
- Best Value Stream Mapping mac Software | Draw Fishbone Diagram ...
- Process Flowchart | Business Process Modeling | Business Models ...
- Process Flowchart | Pyramid Diagram | Value Stream Mapping ...
- Process Flowchart | Pyramid Diagram | Value Stream Mapping ...
- Pyramid Diagram | Value Stream Mapping | Process Flowchart | Mis ...
- Process Flowchart | Pyramid Diagram | Value Stream Mapping ...
- Lean Manufacturing Diagrams | Lean Six Sigma Diagram Software ...
- Process Flowchart | Pyramid Diagram | Value Stream Mapping ...


