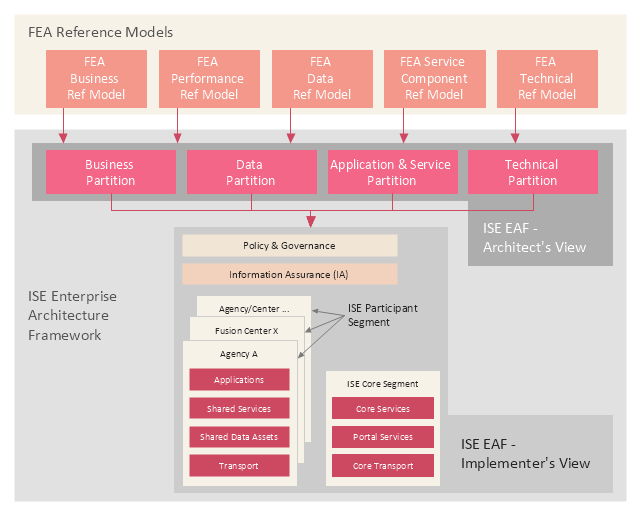
This enterprise architecture diagram example was drawn on the base of the figure illustrating the webpage "ISE Enterprise Architecture Framework 2007" from the Semantic Community website. "The ISE Enterprise Architecture Framework.
As Figure ... depicts, the Federal Enterprise Architecture (FEA) Reference Models (RMs) provide the basis for the ISE EAF. All elements of the ISE EAF are mapped back to elements of the FEA RMs with the FEA management processes applied by the OMB leveraged in support of implementing the ISE. The four ISE EAF partitions are mapped to the five FEA RMs to enable tracking the development of the ISE EAF across agencies using standardized OMB policies and processes that structure EA development and budgeting processes. The ISE EAF also provides an overarching mapping of the ISE into not only Federal civil systems, but also national security systems. ...
Two primary views are used to describe the ISE EAF: 1) the Architect’s View and 2) the Implementer’s View. While the term “view” is typically used to refer to different aspects of an architecture, the OMB suggested the term “partition” rather than the more common terms “architecture” or “view” to differentiate the ISE approach as a framework from the approach typically used in departmental and agency EAs. The Architect’s View comprises four partitions:
1) Business,
2) Data,
3) Application and Service, and
4) Technical.
The Architect’s View is used to provide structural alignment of the ISE architectural components into the FEA structure to ensure strategies, business processes, investments, data, systems, and technologies within the ISE are integrated and compatible with those across the Federal government."
[semanticommunity.info/ Information_ Sharing_ Environment/ ISE_ Enterprise_ Architecture_ Framework_ 2007#Figure_ ES-2._ The_ ISE_ Enterprise_ Architecture_ Framework_ Is_ Defined_ by_ Two_ Views_ and_ Four_ Partitions]
The diagram example "The ISE Enterprise Architecture Framework" was created using the ConceptDraw PRO diagramming and vector drawing software extended with the Enterprise Architecture Diagrams solution from the Management area of ConceptDraw Solution Park.
Product Overview
ConceptDraw PRO offers a wide choice of powerful and easy-to-use tools for quickly creating all kinds of charts and diagrams. Even if you've never used a drawing tool before, it's very easy to create high-quality professional graphic documents with ConceptDraw PRO.The Best Flowchart Software Available
ConceptDraw gives the ability to draw Flowchart documents. Flowcharts solutionis a powerful tool that extends ConceptDraw application for drawing business flowcharts. ConceptDraw PRO vector diagramming and business graphics software enhanced with with templates, green and interactive flowchart makers, samples and stencil libraries from ConceptDraw Solution Park which all focused to help with drawing flowcharts, block diagrams, bar charts, histograms, pie charts, divided bar diagrams, line graphs, area charts, scatter plots, circular arrows diagrams, Venn diagrams, bubble diagrams, concept maps, and others.
Good Flow Chart app for Mac
The ConceptDraw PRO is a good flow chart app for Mac. Numerous vector stencils, samples and templates created by designers allows you to draw any type of flowchart.The vector stencils library "Workflow finance" contains 12 financial icons.
Use it to design your business process workflow diagrams with ConceptDraw PRO software.
"Corporate finance is the area of finance dealing with the sources of funding and the capital structure of corporations and the actions that managers take to increase the value of the firm to the shareholders, as well as the tools and analysis used to allocate financial resources. The primary goal of corporate finance is to maximize or increase shareholder value. ...
Investment analysis (or capital budgeting) is concerned with the setting of criteria about which value-adding projects should receive investment funding, and whether to finance that investment with equity or debt capital. Working capital management is the management of the company's monetary funds that deal with the short-term operating balance of current assets and current liabilities; the focus here is on managing cash, inventories, and short-term borrowing and lending (such as the terms on credit extended to customers)." [Corporate finance. Wikipedia]
The icons example "Design elements - Workflow finance" is included in the Business Process Workflow Diagrams solution from the Business Processes area of ConceptDraw Solution Park.
HelpDesk
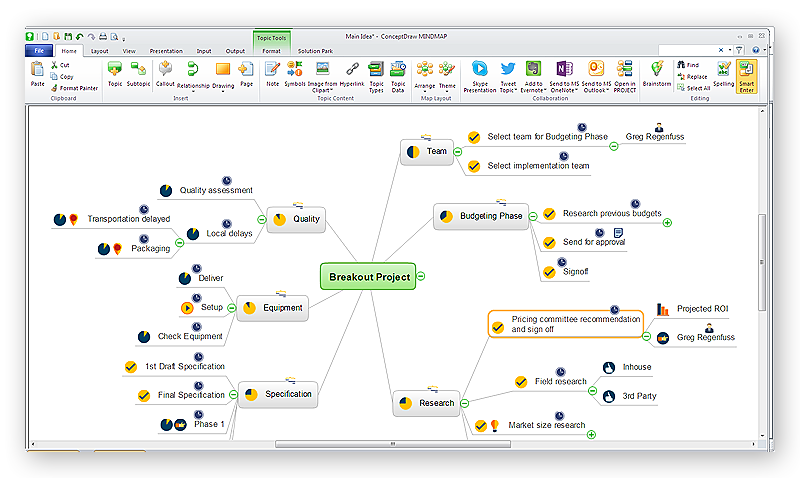
How to Draw a Mind Map on PC Using ConceptDraw MINDMAP
Mind maps are useful forcapturing ideas, organizing and structuring information in a visual form, that is easier to understand, and easier to explain to others. Mind map consists of a general Main Idea surrounded by other related topics and subtopics, which are displayed in a radial hierarchical structure. Read this step-by-step guide on how to create a mind map using ConceptDraw MINDMAP for Windows.
PERT Chart Software
PERT Chart Software - Activity Network and Project Evaluation and Review Technique, or PERT, charts are a way of documenting and analyzing the tasks in a project. ConceptDraw PRO is a powerful diagramming and vector drawing software for designing professional looking PERT Charts quick and easy.Create a Presentation Using a Design Template
The intuitive interface of ConceptDraw MINDMAP and the Functional Tools overview below will guide you in creating and demonstrating powerful mind map presentations using template. An advanced tool allows you effectively generate, change, and update your presentation.Gant Chart in Project Management
Gantt Chart is a graphical representation of tasks as segments on a time scale. It helps plan and monitor project development or resource allocation. There are list of tasks, project milesones and stages. The horizontal axis is a time scale, expressed either in absolute or relative time. Gantt chart can be used for planning in virtually any industry. There are major project planning tools using gantt chart for creating project plan. For instance, using ConceptDraw PROJECT together with ConceptDraw MINDMAP for planning marketing actions is very effective way. It makes ConceptDraw Office best marketing project management software for gantt chart planning marketing message, scheduling stages when to send massive text messages or when use email marketing services in specific projects. There are simple steps on how to use project management software for marketing, sales actions and product support. This is simple all in one toolbox for managers who need best project management software for small business as for planning and brainstorming as for reporting at project execution stage. Using gantt charts together with mindmap visuals and professional presentations charts make it excellent creative project management software. ConceptDraw PROJECT is portfolio project management software it allows manage many projects with multi gantt chart.
How to Discover Critical Path on a Gantt Chart
ConceptDraw PROJECT is the Gantt chart software that implements critical path method to provide the user with a wide set of project management tools.Internet solutions with ConceptDraw PRO
ConceptDraw is a good means of visualization of information of any kind as it features powerful graphic capabilities. The conception of using ConceptDraw and open formats by the programs that work with Internet can be used for displaying any data and any structure in Internet.HelpDesk
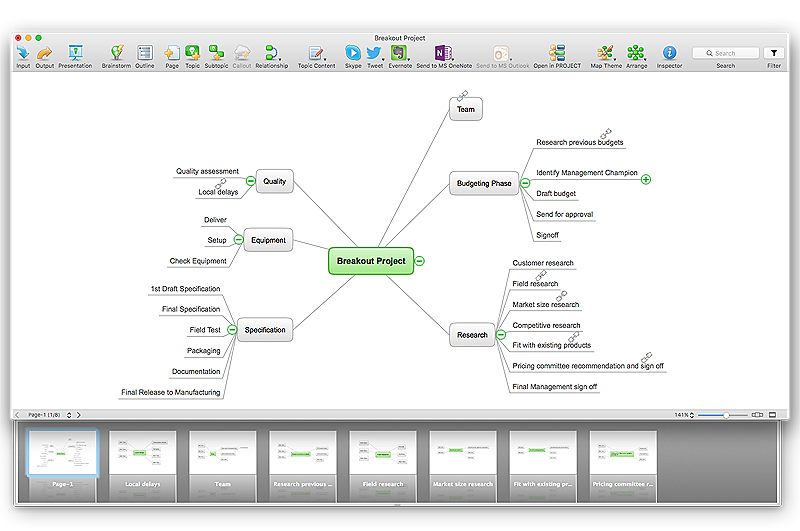
How to Import Text to ConceptDraw MINDMAP
Mind mapping is a quick and efficient way to start up project. When you create a mind map, it might be necessary to use a previously recorded files, notes, or text outlines. The importing capabilities of ConceptDraw MINDMAP allows you to easily convert text into a mind map. You can quickly turn your TXT file to the hierarchical structure of mind map. You can convert the entire TXT file as well as a selected part. ConceptDraw MINDMAP supports the ability to convert text in both single-page and multi-page mind map.You can create a multiple page project mind map quickly, using various text work-pieces. Read this article to find out how to create your multi page mind map from a text outline.How To Do A Mind Map In PowerPoint
ConceptDraw MINDMAP - an excellent tool for exporting mind maps to PowerPoint to visualize and presenting your project. You can simply generate, change, update your mindmap and then make a presentation in PowerPoint.Business Productivity - Management
The widespread of Mind Maps in the field of management is justified and very convenient. The managers and leaders work with large amount of information and data, and need the useful tools for its structuring and systemizing. They prefer to use the powerful Mind Mapping software that gives them a lot of benefits. ConceptDraw MINDMAP is professional software for management, business planning, strategic planning, business productivity and development. It provides the powerful tools which help managers to be effective and improve their productivity, supports them in easy visual documenting and communication the management information. Use ConceptDraw MINDMAP to build the Management Diagrams (Matrices, Organizational Charts, Deployment Charts, Timelines, Cause & Effect (Fishbone) Diagrams) and key management Mind Maps (SWOT analysis, problem solving, decision making, business planning, scheduling, thinking ideas, company organizing, preparing and holding the meetings and presentations) quickly and easily.- Which Structural Diagram Helps In Budgeting
- Draw The Diagram Of Budget System
- Dfd Diagram For Budgetary Control System
- Structural Diagram For Bugeting Hardware
- Pyramid Structural Drawing
- Structure Of Budget Through A Flow Chart
- What Is Budget System Diagram
- Dfd Diagram For Budget Mansgement System
- Budget Management Dfd Diagram
- Level Diagram Dfd For Budget Planner
- Block Diagram Of Bajat
- Which Strutural Diagram Helps In Budgetinh Hardware
- The Diagram Of A Structure Of A Project
- Data Flow Diagram Symbols. DFD Library | Data Flow Diagram ...
- Design elements - Workflow finance | Investment Structure Fund
- The ISE Enterprise Architecture Framework | USDA's Enterprise ...
- Process Flowchart | The ISE Enterprise Architecture Framework ...
- Design elements - Workflow finance
- Finance Office Structure And Workflow
- Process Flowchart | Design elements - Workflow finance | Basic ...


