 SWOT and TOWS Matrix Diagrams
SWOT and TOWS Matrix Diagrams solution extends ConceptDraw DIAGRAM and ConceptDraw MINDMAP software with features, templates, samples and libraries of vector stencils for drawing SWOT and TOWS analysis matrices and mind maps.
Chemical Engineering
ConceptDraw DIAGRAM is a powerful diagramming and vector drawing software. Extended with Chemical and Process Engineering Solution from the Industrial Engineering Area of ConceptDraw Solution Park, it became the best Chemical Engineering software.Swot Analysis Examples
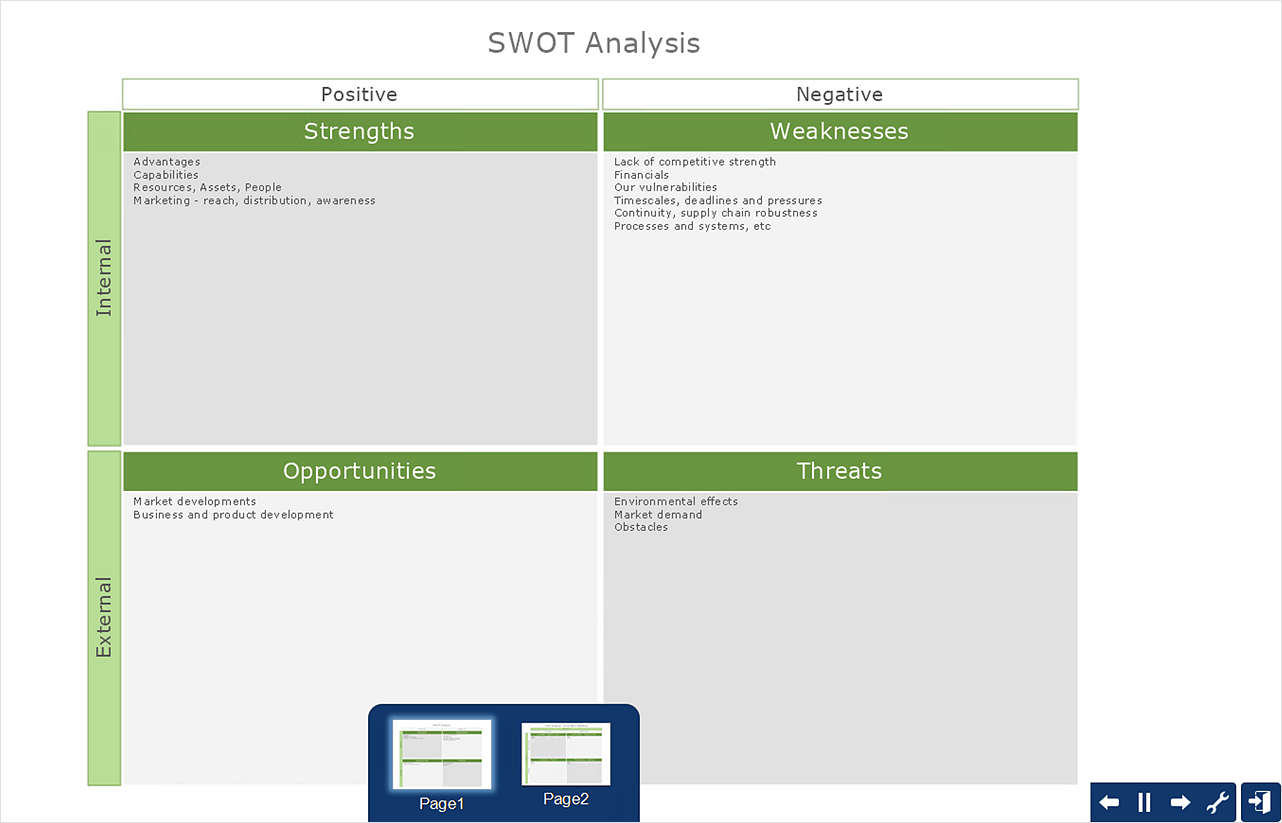
SWOT analysis is an advanced plan making methodology for detection the Strengths and Weaknesses, Opportunities and Threats, that are involved in a project. SWOT analysis possesses a wide variety of real and potential applications and is a key part of any business planning and analysis. SWOT analysis uses as a visual tool the SWOT diagrams and SWOT matrices. ConceptDraw DIAGRAM software with SWOT and TOWS Matrix Diagrams solution provides a lot of SWOT analysis examples and samples, and also numerous collection of built-in SWOT templates, which will be the good start in your self-depending drawing and the perfect source of inspiration. You can always start to design your SWOT diagrams from the blank sheet using the included predesigned vector objects, but in many cases to save the time and efforts for SWOT diagramming would be preferable to use the ready example the most appropriate to your needs. Customizing the proposed SWOT diagrams you will achieve a great success in drawing SWOT matrices of any style and complexity.The Sales Process
The Sales Process is a complex approach for selling a product or service which assumes many steps including the sales planning, realization of the sales marketing and management strategies, sales process analysis, etc. Now we have a ConceptDraw DIAGRAM software extended with unique Sales Flowcharts solution from the Marketing area of ConceptDraw Solution Park which ideally suits for the planning and realization the company's sales process.How to Collaborate in Business via Skype
Collaboration software for small and medium business allows communicate with partners around the globe via Skype.
SWOT Analysis Solution - Strategy Tools
The condition and successful development of the company depends on how efficiently it is able to react on different outside influences. Analysis and interrelated consideration of external factors and the company's capabilities allow effectively solve appearing problems. One of the most common methods of evaluation together internal and external factors influencing the company's development is SWOT analysis elaborated for business and industry. It is a necessary element of researches and obligatory preliminary stage at the preparation of strategic and marketing plans of the company. Upon the results of SWOT analysis, we can assess does the company have the internal forces and resources to realize the existing opportunities and resist external threats, and what internal deficiencies require the prompt rectification. ConceptDraw DIAGRAM software enhanced with SWOT Analysis solution offers powerful drawing and strategy tools for effective execution the SWOT and TOWS analysis for your company with a goal of effectively realizing strategic planning and correct decision-making.
 SWOT Analysis
SWOT and TOWS Matrix Diagrams solution extends ConceptDraw DIAGRAM and ConceptDraw MINDMAP software with features, templates, samples and libraries of vector stencils for drawing SWOT and TOWS analysis matrices and mind maps.
How to Make SWOT Analysis in a Word Document
A SWOT Analysis is a popular tool of the strategic planning which is used to evaluate the Strengths, Weaknesses, Opportunities, and Threats that are involved in any businesses. Use of mind maps allows you to collect a lot of information used for SWOT Analysis, visually structure it and also identify the relationships between different parts of this information. SWOT and TOWS Matrix Diagrams solution for ConceptDraw Solution Park combines professional visual advantages of ConceptDraw MINDMAP software and presentation capabilities of ConceptDraw DIAGRAM , which together provide a complete work solution. The SWOT and TOWS diagrams, matrices or mind maps produced in ConceptDraw DIAGRAM using the predesigned vector objects or filling the ready templates, can be then easily exported to Microsoft Word, Microsoft Visio, Microsoft PowerPoint, Adobe PDF, and many other electronic file formats. The possibility of export makes easy the use of SWOT diagrams designed in ConceptDraw DIAGRAM and lets you efficiently collaborate even with people who maybe don't have this software.HelpDesk
How to Create a SWOT Matrix Quickly
ConceptDraw DIAGRAM allow create SWOT Matrix in just one click for presenting analysis results preformed in mimd map structure using ConceptDraw MINDMAP.SWOT Analysis
When starting a new business project or business venture and making the strategic decisions, you need to attach all strengths, utilize all opportunities to eliminate weaknesses and to avoid potential threats. All these actions look like hard, but it is not so when is applied a SWOT Analysis method. The main goal of this method is to help develop a strong business strategy, its major tools are SWOT Matrix and SWOT Mind Map that help you define the internal strengths and weaknesses, and also external opportunities and threats that you may face. The Mind Map is a unique visual tool, which lets you see immediately the key points and gaps, and to establish the links between seemingly unrelated information. ConceptDraw MINDMAP software is effective to save your time and efforts when carrying out a SWOT Analysis. The SWOT and TOWS Matrix Diagrams solution, that is available from ConceptDraw Solution Park, contains easy-to-use Mind Map templates to help you identify the Strengths, Weaknesses, Opportunities, and Threats, and represent the SWOT analysis results on the professionally-looking Mind Map.How to Create a PowerPoint Presentation from a SWOT Analysis Mindmap
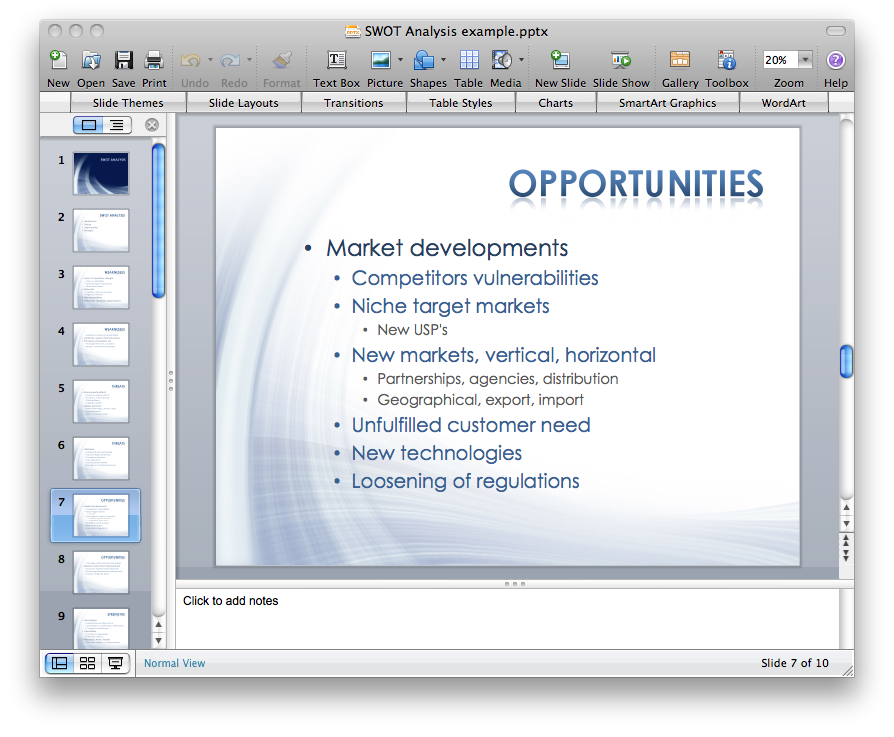
You can use SWOT analysis PowerPoint presentation to represent strengths, weakness, opportunities, and threats involved in your SWOT matrix.IDEF1 standard
Use Case Diagrams technology. Using visual graphical objects IDEF1 standard allows to model information interrelations.Gant Chart in Project Management
Gantt Chart is a graphical representation of tasks as segments on a time scale. It helps plan and monitor project development or resource allocation. There are list of tasks, project milesones and stages. The horizontal axis is a time scale, expressed either in absolute or relative time. Gantt chart can be used for planning in virtually any industry. There are major project planning tools using gantt chart for creating project plan. For instance, using ConceptDraw PROJECT together with ConceptDraw MINDMAP for planning marketing actions is very effective way. It makes ConceptDraw Office best marketing project management software for gantt chart planning marketing message, scheduling stages when to send massive text messages or when use email marketing services in specific projects. There are simple steps on how to use project management software for marketing, sales actions and product support. This is simple all in one toolbox for managers who need best project management software for small business as for planning and brainstorming as for reporting at project execution stage. Using gantt charts together with mindmap visuals and professional presentations charts make it excellent creative project management software. ConceptDraw PROJECT is portfolio project management software it allows manage many projects with multi gantt chart.
Workflow Application
ConceptDraw DIAGRAM application is perfect for creating workflow diagrams. This application contains specific features and technologies designed to draw diagrams faster, such as RapidDraw and Arrows10. ConceptDraw DIAGRAM software extended with the Workflow Diagrams solution gives you a flexible tool to draw any kind of workflow.- Swot Analysis In Software Engineering
- Example Of Swot Analysis For Maintenance Engineer
- Swot Analysis Example For Software Engineer
- Swot Analysis Example For Chemical Engineer
- Example Student Software Engineer Personal Swot Analysis
- Swot Analysis For Mechanical Engineering Student
- SWOT Analysis | Mind Maps for Business - SWOT Analysis | How to ...
- Engineering Swot Analysis Example
- Swot Analysis For Software Engineer
- PM Agile | Marketing | Software Development | Swot Analysis Of
- Swot Analysis Opportunity For Engineering Student
- Swot Analysis Of Engineer
- Examples Of Swot Analysis According To Software Engineering
- SWOT Analysis Solution - Strategy Tools | Swot Analysis Examples ...
- Entity Relationship Diagram Software Engineering | Functional ...
- Personal Swot Analysis Examples Of Mechanical Engineers
- SWOT Analysis | Swot Analysis Examples | SWOT and TOWS Matrix ...
- Engineering Student Personal Swot Analysis Sample
- Personal Swot Analysis Report For Mechanical Engineering Student


