SWOT Analysis
Most of the data needed for market analysis (demand, prices, volume of sales, etc.) are undefined, and in future are possible their changes as in the worst and the best side. SWOT analysis is effective method for prediction these processes and decision making for organizations that function in a competitive environment. It allows you to see the whole situation, to identify the strengths and weaknesses of organization (advantages and disadvantages), as well as opportunities and threats of external environment. The results of SWOT analysis are the basis for optimization the business processes, for development by the leading specialists in organization of interrelated complex of strategies and competitive activities. ConceptDraw DIAGRAM software enhanced with SWOT and TOWS Matrix Diagrams Solution will effectively help you in strategic planning for your company, department, project, in development marketing campaign, in identification of four categories of factors of internal and external environment of organization, and construction professional-looking SWOT and TOWS matrices.SWOT Analysis
When starting a new business project or business venture and making the strategic decisions, you need to attach all strengths, utilize all opportunities to eliminate weaknesses and to avoid potential threats. All these actions look like hard, but it is not so when is applied a SWOT Analysis method. The main goal of this method is to help develop a strong business strategy, its major tools are SWOT Matrix and SWOT Mind Map that help you define the internal strengths and weaknesses, and also external opportunities and threats that you may face. The Mind Map is a unique visual tool, which lets you see immediately the key points and gaps, and to establish the links between seemingly unrelated information. ConceptDraw MINDMAP software is effective to save your time and efforts when carrying out a SWOT Analysis. The SWOT and TOWS Matrix Diagrams solution, that is available from ConceptDraw Solution Park, contains easy-to-use Mind Map templates to help you identify the Strengths, Weaknesses, Opportunities, and Threats, and represent the SWOT analysis results on the professionally-looking Mind Map.SWOT Template
The SWOT and TOWS Matrix Diagrams solution from the ConceptDraw Solution Park gives a simple visual support for all steps of a SWOT analysis process, which is a popular strategic planning method used to evaluate the Strengths, Weaknesses, as well as Opportunities and Threats facing a project. Strengths are the project's characteristics giving it the advantages over the others, weaknesses are the characteristics placing the team at the disadvantage relatively to others, opportunities are the elements that the project can exploit to its advantage and threats are the elements that can cause the troubles. The results of a correctly performed SWOT analysis help to achieve effectively the main objective. The SWOT templates included to SWOT and TOWS Matrix Diagrams solution for ConceptDraw DIAGRAM isually support the identifying of internal and external factors that are favorable or unfavorable. Making the SWOT analysis and completing the SWOT Matrix by simple filling a SWOT template, you can then export it to large variety of available formats: PowerPoint presentation, PDF, image files, and others.SWOT Matrix
SWOT matrix is a structured planning method used to evaluate the strengths, weaknesses, opportunities and threats involved in a project or in a business venture. ConceptDraw DIAGRAM diagramming and vector drawing software extended with SWOT and TOWS Matrix Diagrams Solution from the Management Area will help you design SWOT Matrix of any complexity quick and easy.Quality visualization in your company
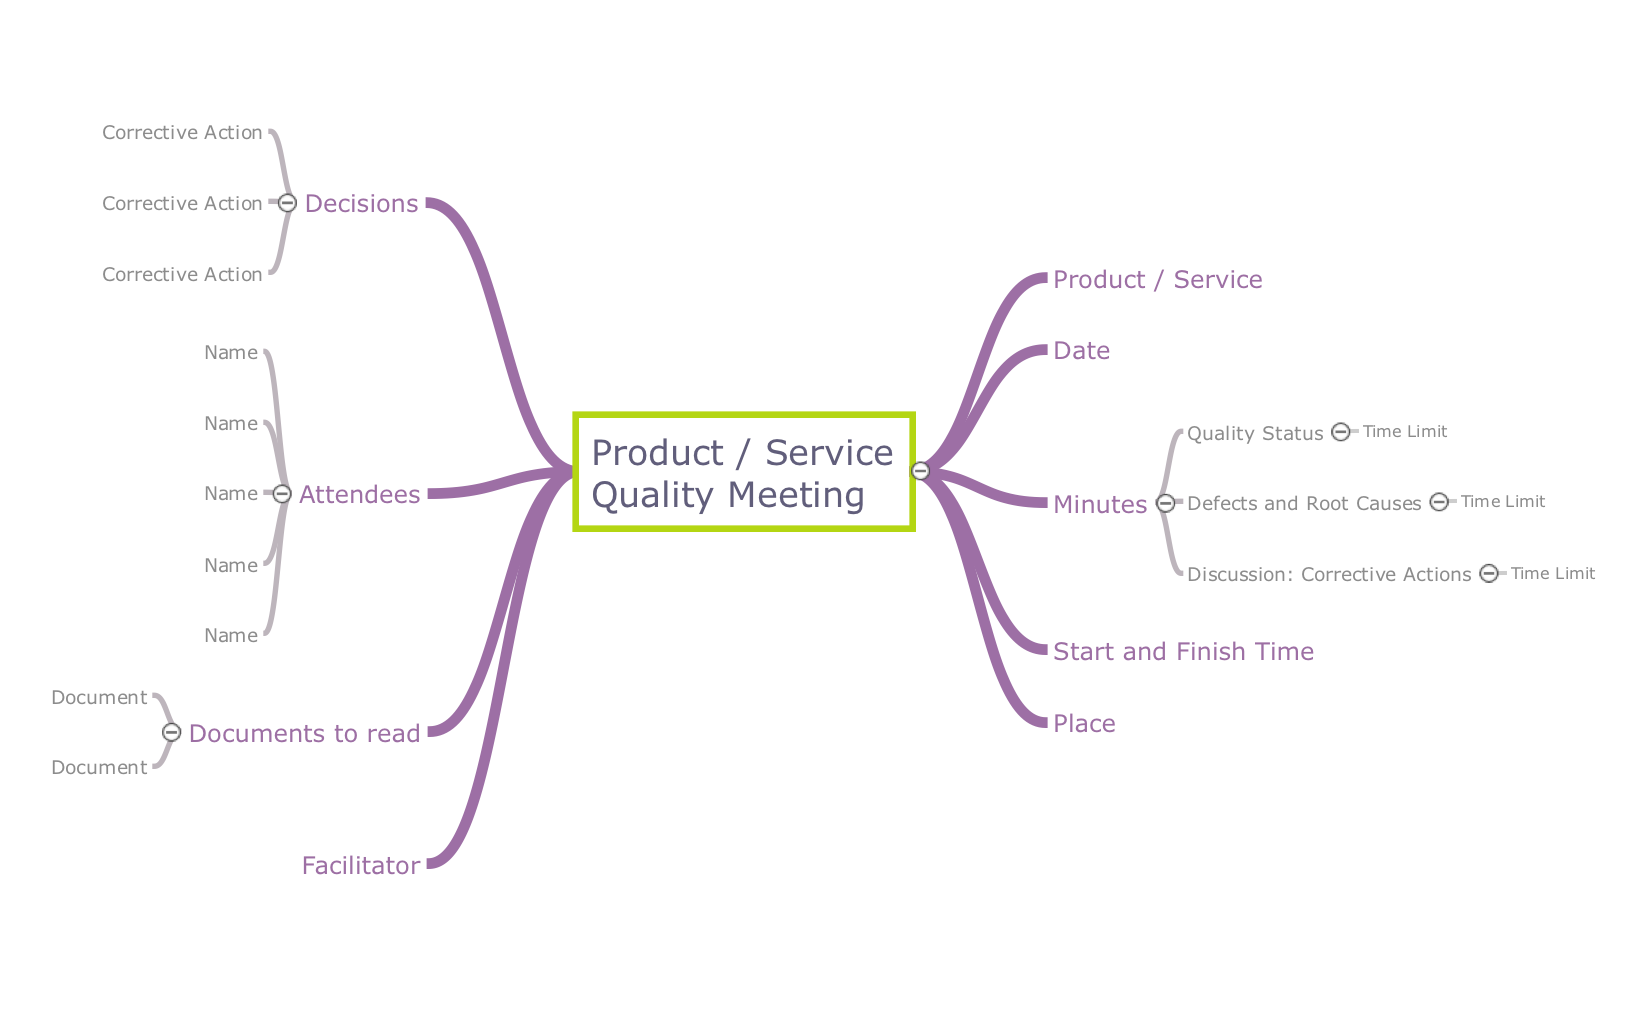
Using ConceptDraw quality mind maps is a perfect addition to quality visualization in your company.ConceptDraw MINDMAP : Brainstorming, Mind Mapping for macOS and Windows
ConceptDraw MINDMAP is a powerful business and personal productivity software application that provides visual organization and access to information for individuals and organizations.
 SWOT and TOWS Matrix Diagrams
SWOT and TOWS Matrix Diagrams solution extends ConceptDraw DIAGRAM and ConceptDraw MINDMAP software with features, templates, samples and libraries of vector stencils for drawing SWOT and TOWS analysis matrices and mind maps.
Remote Projects in Corporate Strategy
Communication is the main challenge and the key success factor for organizational project management in company with remote projects. Communicating visually via Skype you bring all projects together to achieve corporate goals.
Total Quality Management Business Diagram
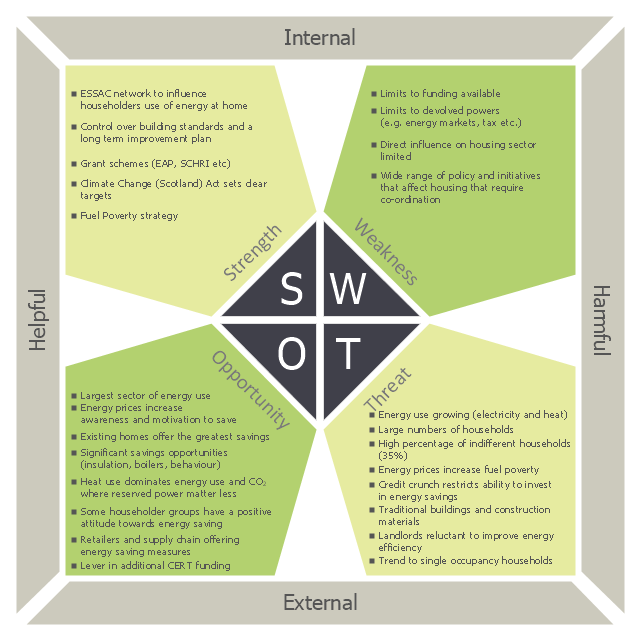
The Total Quality Management Diagram solution helps you and your organization visualize business and industrial processes. Create Total Quality Management diagrams for business process with ConceptDraw software.This sample was created on the base of the SWOT matrix illustrating the webpage "SWOT Analysis" of "Scottish Energy Study Volume 4: Issues, Opportunities and Barriers" from the website of the Scottish Government. [scotland.gov.uk/ Publications/ 2009/ 09/ 24094712/ 6]
The diagram example "Domestic sector SWOT" was created using the ConceptDraw PRO diagramming and vector drawing software extended with the SWOT Analysis solution from the Management area of ConceptDraw Solution Park.
The diagram example "Domestic sector SWOT" was created using the ConceptDraw PRO diagramming and vector drawing software extended with the SWOT Analysis solution from the Management area of ConceptDraw Solution Park.
Basic Flowchart Examples
ConceptDraw DIAGRAM is a business flowchart software includes the wide flowchart examples package.Authority Matrix Diagram Software
You need to draw Authority Matrix Diagram quick and easy? Design it with ConceptDraw DIAGRAM ! ConceptDraw DIAGRAM extended with Seven Management and Planning Tools solution from the Management Area is the best Authority Matrix Diagram Software.PROBLEM ANALYSIS. Prioritization Matrix
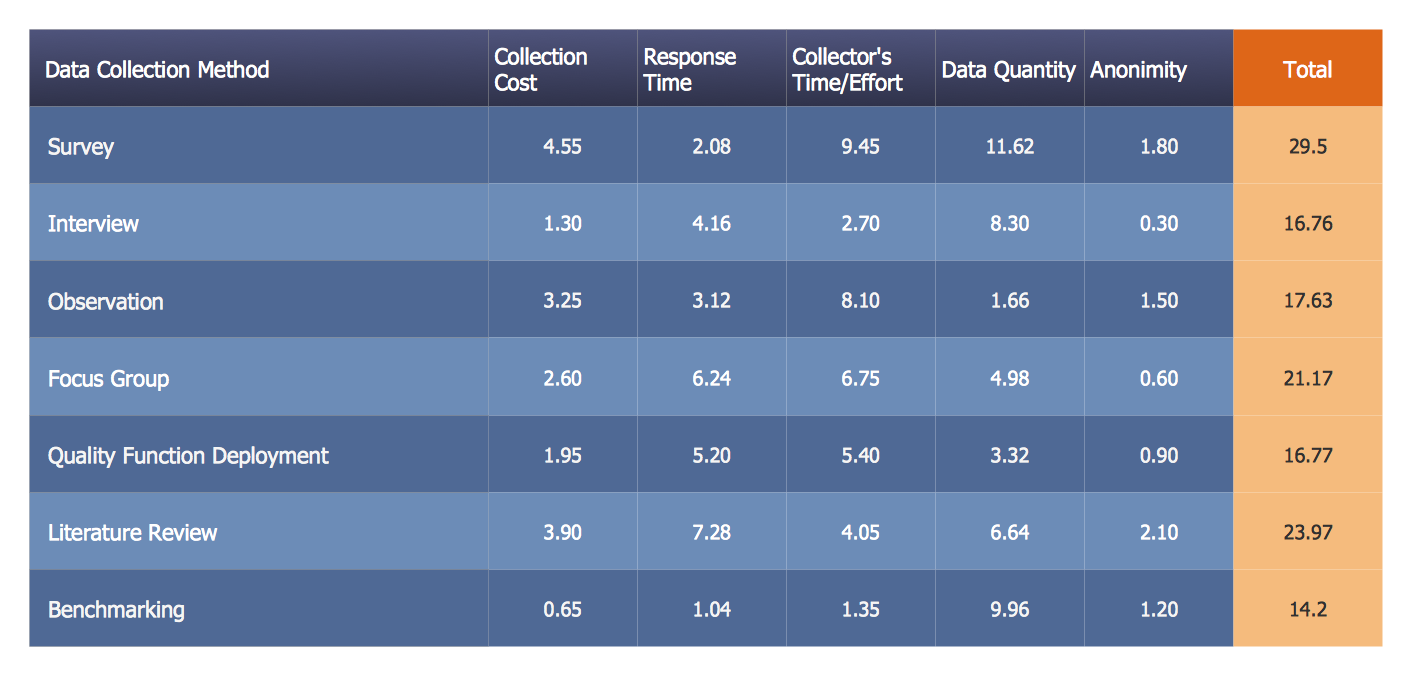
ConceptDraw OFFICE suite is a software for Prioritization Matrix diagram making. This diagram ranks the drivers’ factors to determine priority. It identifies the factors of the first priority for analysis of possible corrective actions. It assesses the weight of each factor for each criterion and specifies it in the Prioritization Matrix. The total sum of weights for a factor’s criteria indicates its priority.
Pyramid Chart Examples
Pyramid Charts and Triangle Diagrams are used to visually structure the topics and progressively order the quantitative data. They allow to illustrate hierarchical structure of the topics, proportional, interconnected and containment relations among the topics. The multilevel Pyramids and Triangle diagrams are constructed oriented up or down and divided into several horizontal slices. They are effectively used to represent marketing strategies, social strategies, information systems, market value, etc., to illustrate presentations, websites, documents, reports in business, finances, sales, management, marketing, media, training, consulting, and many other fields. To maximize the efficiency in drawing the Pyramid Charts, use the ConceptDraw DIAGRAM diagramming and vector drawing software extended with Pyramid Diagrams solution from Marketing area, which contains the set of Pyramid Chart examples, samples, templates and vector design elements of triangular diagrams and pyramids with different quantity of levels for various needs.House of Quality Matrix Software
House of Quality Matrix Software - Use the predesigned objects from the Involvement Matrix Objects Library from the Seven Management and Planning Tools Solution to create professional looking House of Quality Matrices in minutes.- Software for Creating SWOT Analysis Diagrams | SWOT analysis ...
- SWOT Analysis | What is SWOT Analysis in Marketing | Mind Maps ...
- BPR Diagram. Business Process Reengineering Example | SWOT ...
- Process Improvement | Quality visualization in your company ...
- Matrix On The Internal And External Environment
- SWOT Analysis | Competitor Analysis | What is SWOT Analysis ...
- Cause and Effect Analysis - Fishbone Diagrams for Problem Solving ...
- SWOT Analysis
- Competitive strategy matrix - Template | SWOT Analysis Solution ...
- SWOT Analysis | SWOT analysis Software & Template for Macintosh ...
- SWOT Analysis | Basic Flowchart Examples | SWOT analysis for a ...
- Ansoff's product / market matrix | SWOT analysis matrix diagram ...
- SWOT Analysis | SWOT analysis for a small independent bookstore ...
- SWOT Analysis Solution - Strategy Tools | SWOT analysis matrix ...
- SWOT Analysis Solution - Strategy Tools | Small business ...
- SWOT Analysis | SWOT Analysis Solution - Strategy Tools | How to ...
- Environmental Swot Analysis
- Software for Creating SWOT Analysis Diagrams | What is SWOT ...
- Software for Creating SWOT Analysis Diagrams | SWOT Matrix ...
- SWOT Analysis | What is SWOT Analysis? | Competitor Analysis ...


