SWOT Matrix Blue Theme
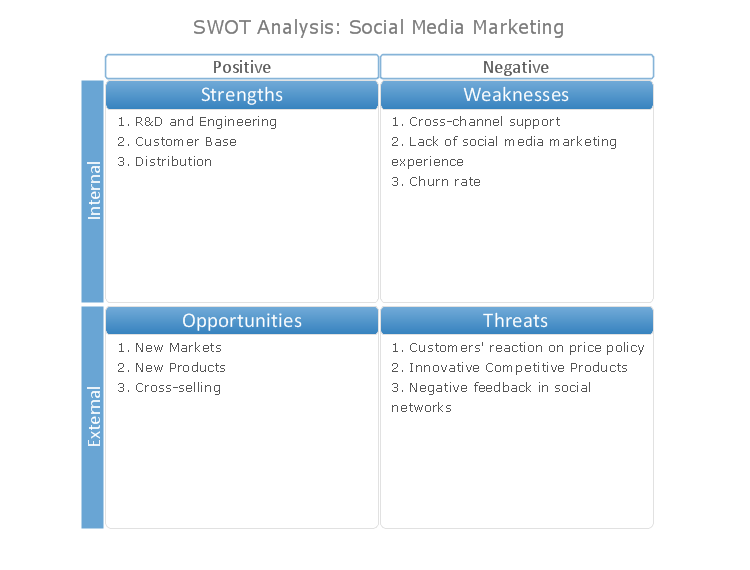
SWOT analysis is a strategic planning method, which is applied to evaluate the Strengths, Weaknesses, Opportunities, and Threats of project or business. TOWS analysis is a variation of SWOT analysis, that is more focused on external factors and action planning. The SWOT and TOWS Matrix Diagrams solution offered by the Management area of ConceptDraw Solution Park gives a simple visual support for all steps of a SWOT analysis process. This solution supports the ConceptDraw users with predesigned vector matrix objects for SWOT analysis, SWOT and TOWS samples and templates for ConceptDraw PRO and mind map templates for ConceptDraw MINDMAP. These templates are fully ready for visual identifying internal and external factors, which are favorable and unfavorable, for planning strategic actions for your team, project, process, company, department, or even self-improvement. Completing the SWOT analysis, you can then output your resulting matrix to a variety of formats, such as PDF, image files, PowerPoint presentation, etc. Besides, the ConceptDraw products give you the possibility to create the SWOT and TOWS matrices of any style and design. The offered SWOT Matrix sample is designed as a SWOT Matrix Blue Theme."SWOT Analysis.
A tool that identifies the strengths, weaknesses, opportunities and threats of an organization. Specifically, SWOT is a basic, straightforward model that assesses what an organization can and cannot do as well as its potential opportunities and threats. The method of SWOT analysis is to take the information from an environmental analysis and separate it into internal (strengths and weaknesses) and external issues (opportunities and threats). Once this is completed, SWOT analysis determines what may assist the firm in accomplishing its objectives, and what obstacles must be overcome or minimized to achieve desired results." [investopedia.com/ terms/ s/ swot.asp]
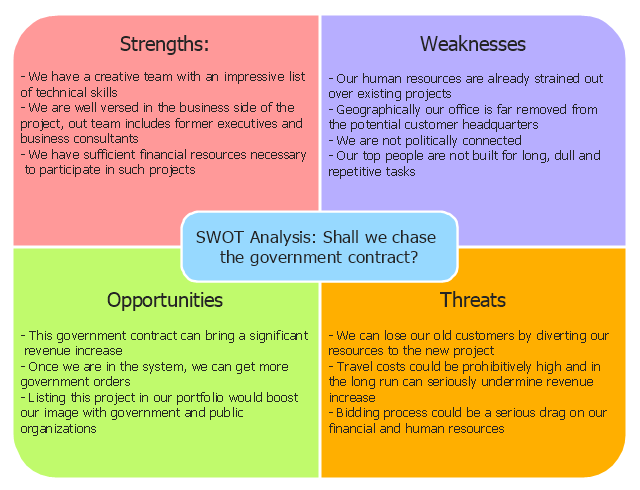
The SWOT matrix example "Government contract" was created using the ConceptDraw PRO diagramming and vector drawing software extended with the SWOT Analysis solution from the Management area of ConceptDraw Solution Park.
Presentation in MINDMAP All in One
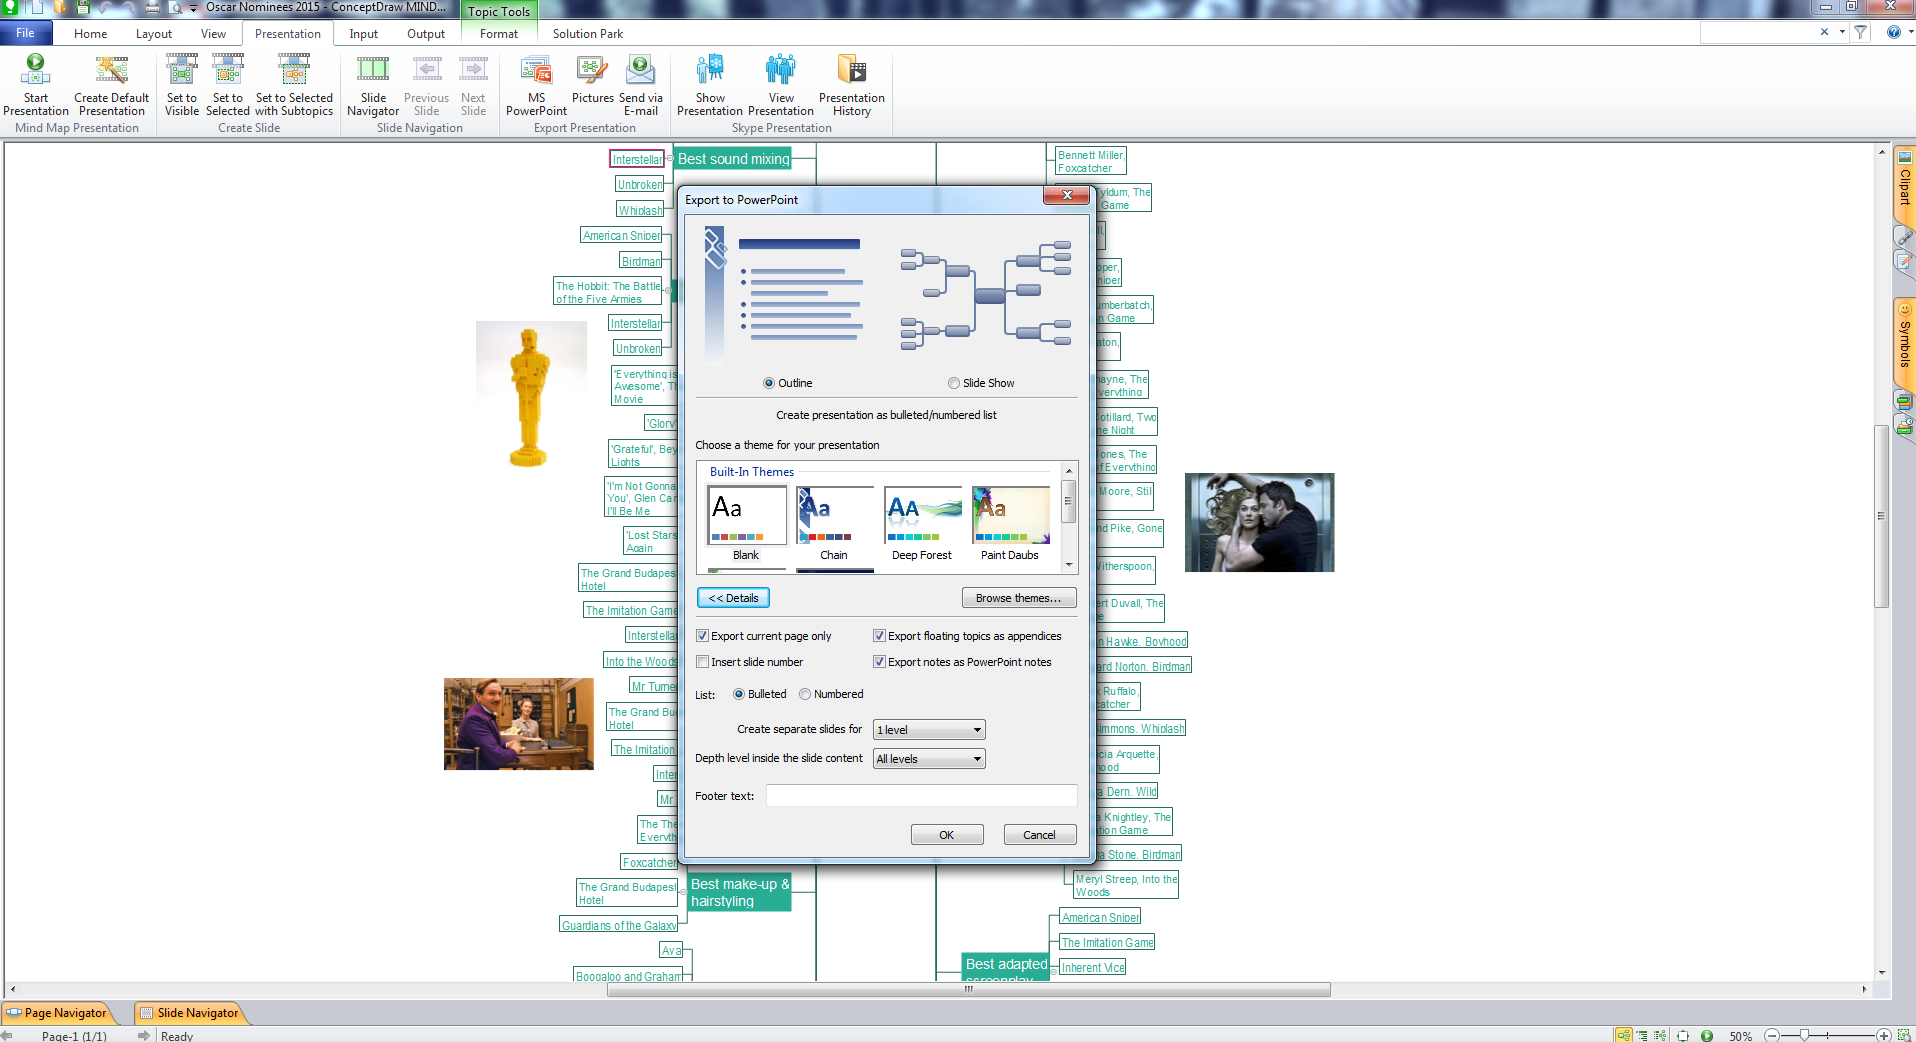
When planning to create a neat presentation out of lot of data, try mind mapping. It is handy, especially when you want to represent pictures and text on the same page. With the Presentation Exchange solution you can easily extract the content from a PowerPoint presentation to see how it all fits together in a single view. You can review slide content, see how the slides support one another, and refine the story.
HelpDesk
How to Deliver a Presentation on Mac Using Two Monitors
ConceptDraw PRO supports multiple monitors. You can to edit a presentation and then display it on separate monitors.
 Pie Charts
Pie Charts are extensively used in statistics and business for explaining data and work results, in mass media for comparison (i.e. to visualize the percentage for the parts of one total), and in many other fields. The Pie Charts solution for ConceptDraw PRO v10 offers powerful drawing tools, varied templates, samples, and a library of vector stencils for simple construction and design of Pie Charts, Donut Chart, and Pie Graph Worksheets.
 Health Food
The Health Food solution contains the set of professionally designed samples and large collection of vector graphic libraries of healthy foods symbols of fruits, vegetables, herbs, nuts, beans, seafood, meat, dairy foods, drinks, which give powerful possi
 Universal Diagramming Area
This area collects solutions for drawing diagrams, charts, graphs, matrices, geographic and road maps for education, science, engineering, business.
 Bubble Diagrams
Bubble diagrams have enjoyed great success in software engineering, architecture, economics, medicine, landscape design, scientific and educational process, for ideas organization during brainstorming, for making business illustrations, presentations, planning, design, and strategy development. They are popular because of their simplicity and their powerful visual communication attributes.
 Sales Dashboard
Sales Dashboard solution extends ConceptDraw PRO software with templates, samples and library of vector stencils for drawing the visual dashboards of sale metrics and key performance indicators (KPI).
HelpDesk
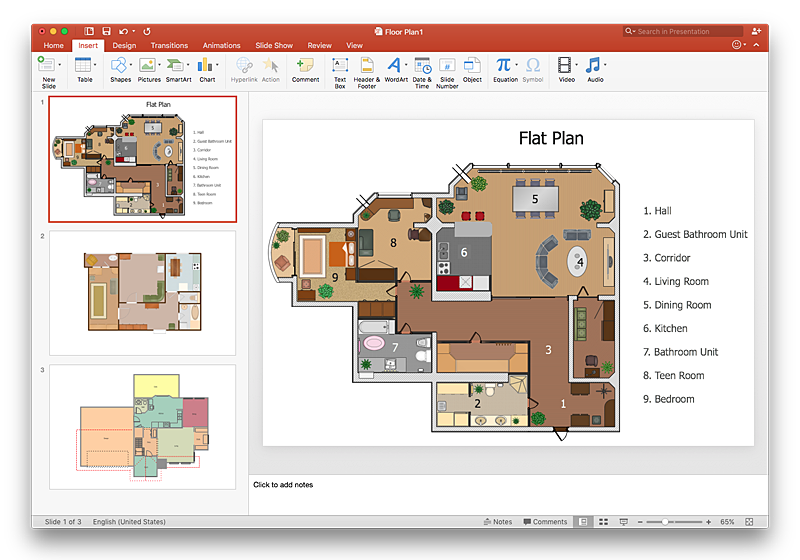
How To Make a PowerPoint Presentation of a Floor Plan Using ConceptDraw PRO
You can use ConceptDraw PRO to perform amazing PowerPoint presentation of the floor plan that includes the sizes, corners, squares and other important technical and design details.
 Metro Map
Metro Map solution extends ConceptDraw PRO software with templates, samples and library of vector stencils for drawing the metro maps, route maps, bus and other transport schemes, or design tube-style infographics.
 MindTweet
This solution extends ConceptDraw MINDMAP software with the ability to brainstorm, review and organize the sending of Tweets.
 Specification and Description Language (SDL)
For people in the field of systems engineering or system design, working with specification and description language (sdl) and finite state machines (fsm).
 Accounting Flowcharts
Accounting Flowcharts solution extends ConceptDraw PRO software with templates, samples and library of vector stencils for drawing the accounting flow charts.
- SWOT Analysis | SWOT Analysis | Swot Analysis Examples ...
- SWOT Matrix Template
- Seating Plans | Interior Design Office Layout Plan Design Element ...
- SWOT Analysis | How to Create an Enterprise Architecture Diagram ...
- Software for Creating SWOT Analysis Diagrams | SWOT matrix ...
- SWOT Analysis Solution - Strategy Tools | Design elements - SWOT ...
- SWOT Analysis | SWOT analysis for a small independent bookstore ...
- Small Office Design | Data Flow Diagram Model | SWOT analysis for ...
- Swot Analysis Of An It Firm
- Fishbone Diagram | SWOT Analysis | Hierarchical Network Topology ...
- Swot Weakness Examples
- Mind Maps for Business - SWOT Analysis | Marketing | What is ...
- Bar Chart Template for Word | SWOT analysis matrix diagram ...
- Fishbone Diagram Template | SWOT Analysis | How to Create an ...
- Life cycle analysis - Ring chart | SWOT matrix - Government contract ...
- Environmental Swot Analysis
- SWOT matrix - Government contract | Software for Creating SWOT ...
- SWOT Sample in Computers | SWOT Analysis | SWOT Matrix ...
- Basic Flowchart Symbols and Meaning | SWOT Matrix Template ...
- SWOT Matrix Template | SWOT analysis positioning matrix ...


