ERD Symbols and Meanings


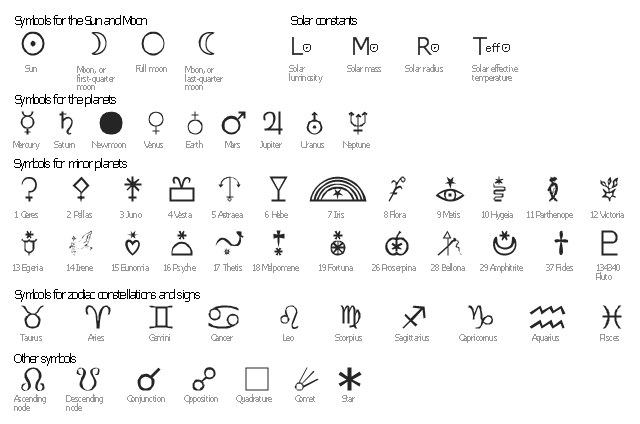
The vector stencils library "Astronomical symbols" contains 58 astronomical symbols and astrological signs of Solar system planets, stars, Sun, Moon, Earth, constellations, Mercury, Venus, Mars, Saturn, Jupiter, Uranus, Neptune, comet, Zodiac signs.
"Astronomical symbols are symbols used to represent various celestial objects, theoretical constructs and observational events in astronomy. The earliest forms of these symbols appear in Greek papyri of late antiquity. The Byzantine codices in which the Greek papyri were preserved continued and extended the inventory of astronomical symbols. New symbols were further invented to represent many just-discovered planets and minor planets discovered in the 18th-20th centuries.
All these symbols were once commonly used by professional astronomers, amateur astronomers, and astrologers. While they are still commonly used in almanacs and astrological publications, their occurrence in published research and texts on astronomy is relatively infrequent, with some exceptions such as the Sun and Earth symbols appearing in astronomical constants, and certain zodiacal signs used to represent the solstices and equinoxes." [Astronomical symbols. Wikipedia]
The pictograms example "Design elements - Astronomical symbols" was created using the ConceptDraw PRO diagramming and vector drawing software extended with the Astronomy solution from the Science and Education area of ConceptDraw Solution Park.
Astronomical signs
Flowchart design. Flowchart symbols, shapes, stencils and icons


Entity Relationship Diagram Symbols

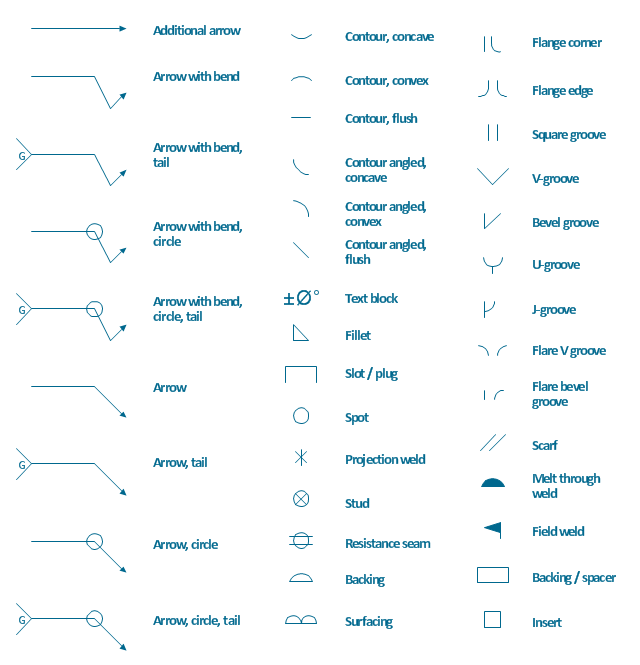
The vector stencils library "Welding" contains 38 welding joint symbols to identify fillets, contours, resistance seams, grooves, surfacing, and backing.
Use it to indicate welding operations on working drawings.
"Welding is a fabrication or sculptural process that joins materials, usually metals or thermoplastics, by causing coalescence. This is often done by melting the workpieces and adding a filler material to form a pool of molten material (the weld pool) that cools to become a strong joint, with pressure sometimes used in conjunction with heat, or by itself, to produce the weld. This is in contrast with soldering and brazing, which involve melting a lower-melting-point material between the workpieces to form a bond between them, without melting the workpieces.
Many different energy sources can be used for welding, including a gas flame, an electric arc, a laser, an electron beam, friction, and ultrasound.
Welds can be geometrically prepared in many different ways. The five basic types of weld joints are the butt joint, lap joint, corner joint, edge joint, and T-joint (a variant of this last is the cruciform joint). Other variations exist as well - for example, double-V preparation joints are characterized by the two pieces of material each tapering to a single center point at one-half their height. Single-U and double-U preparation joints are also fairly common - instead of having straight edges like the single-V and double-V preparation joints, they are curved, forming the shape of a U. Lap joints are also commonly more than two pieces thick - depending on the process used and the thickness of the material, many pieces can be welded together in a lap joint geometry." [Welding. Wikipedia]
The shapes example "Design elements - Welding" was created using the ConceptDraw PRO diagramming and vector drawing software extended with the Mechanical Engineering solution from the Engineering area of ConceptDraw Solution Park.
Welding joint symbols
SDL Flowchart Symbols

Campus Area Networks (CAN). Computer and Network Examples


Flowchart Definition

What is Entity-Relationship Diagram

Electrical Symbols, Electrical Diagram Symbols

- Basic Flowchart Symbols and Meaning | A Personal Stereo System ...
- Design elements - Welding | U Shaped Butt Welding Symbol
- U Symbol Chemistry
- U Shape Png
- Electrical Symbols , Electrical Diagram Symbols | Electrical Drawing ...
- Basic Flowchart Symbols and Meaning | HR arrows - Vector stencils ...
- Symbols U
- Astronomical Planet Symbol Picture U
- Basic Flowchart Symbols and Meaning | Flowcharts | U Shaped ...
- Mechanical Engineering | Butt weld geometry | Welding symbols ...