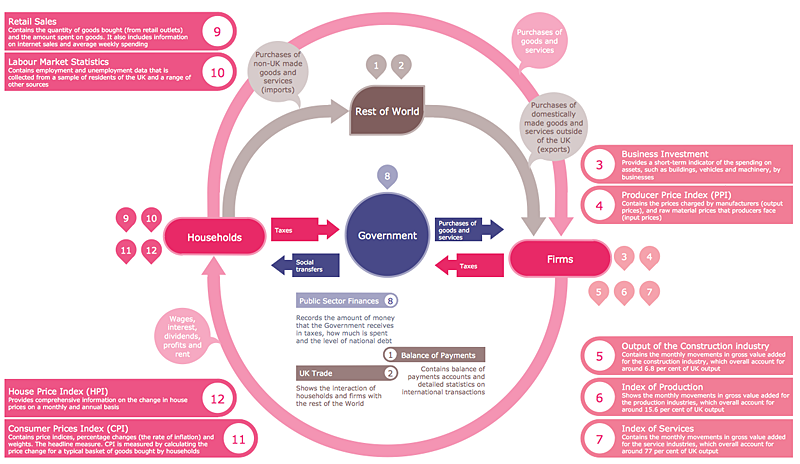
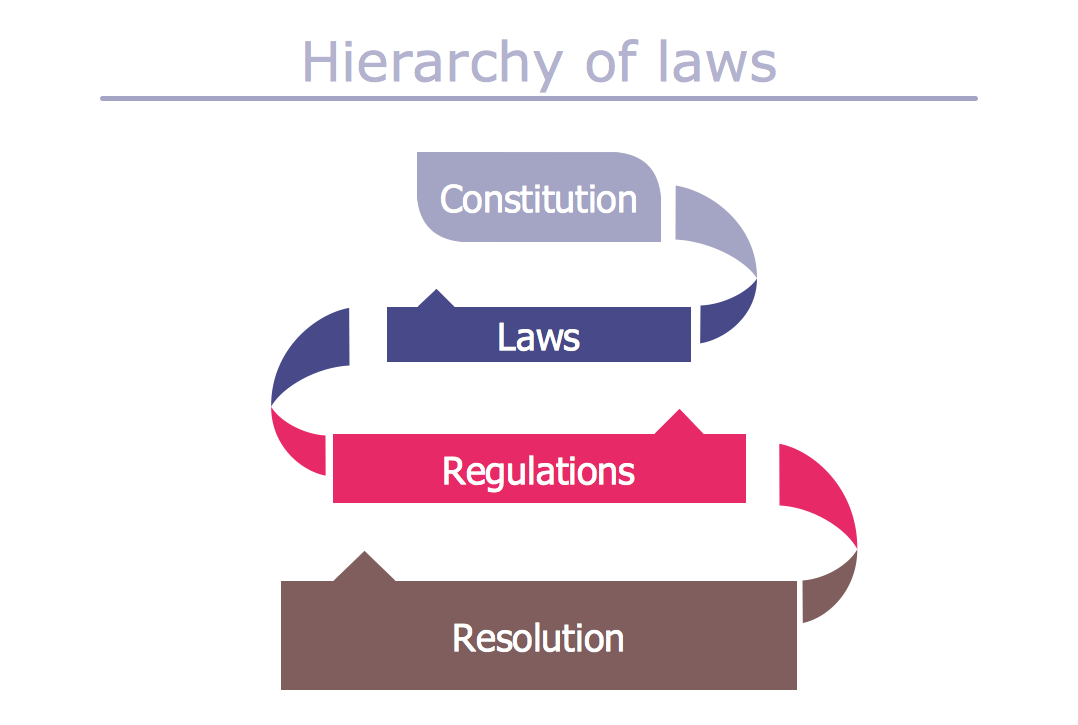
This typography infographics example was redesigned from the Wikimedia Commons file: P15.figure.jpg. [commons.wikimedia.org/ wiki/ File:P15.figure.jpg]
The example "Tables and figures show - Infographics" was created using the ConceptDraw PRO diagramming and vector drawing software extended with the Typography Infographics solition from the area "What is infographics" in ConceptDraw Solution Park.
The example "Tables and figures show - Infographics" was created using the ConceptDraw PRO diagramming and vector drawing software extended with the Typography Infographics solition from the area "What is infographics" in ConceptDraw Solution Park.
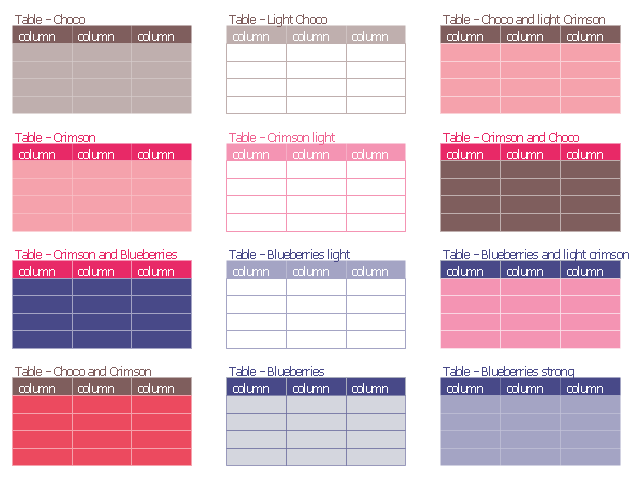
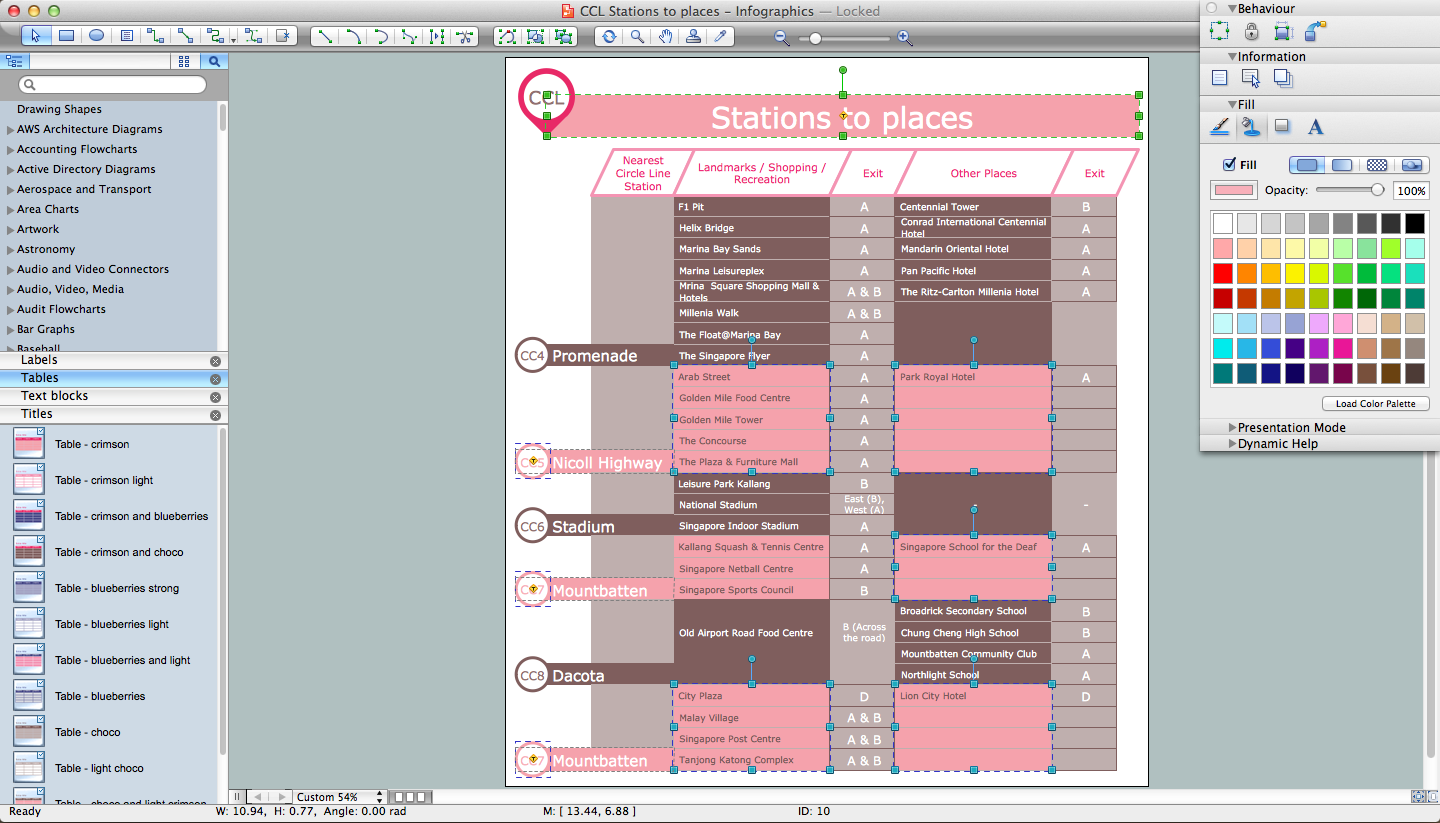
The vector stencils library "Tables" contains 12 table blocks. Use it to add typography elements into your infographics.
"A table is a means of arranging data in rows and columns. The use of tables is pervasive throughout all communication, research and data analysis. Tables appear in print media, handwritten notes, computer software, architectural ornamentation, traffic signs and many other places. The precise conventions and terminology for describing tables varies depending on the context. Further, tables differ significantly in variety, structure, flexibility, notation, representation and use. In books and technical articles, tables are typically presented apart from the main text in numbered and captioned floating blocks." [Table (information). Wikipedia]
The example "Design elements - Tables" was created using the ConceptDraw PRO diagramming and vector drawing software extended with the Typography Infographics solition from the area "What is infographics" in ConceptDraw Solution Park.
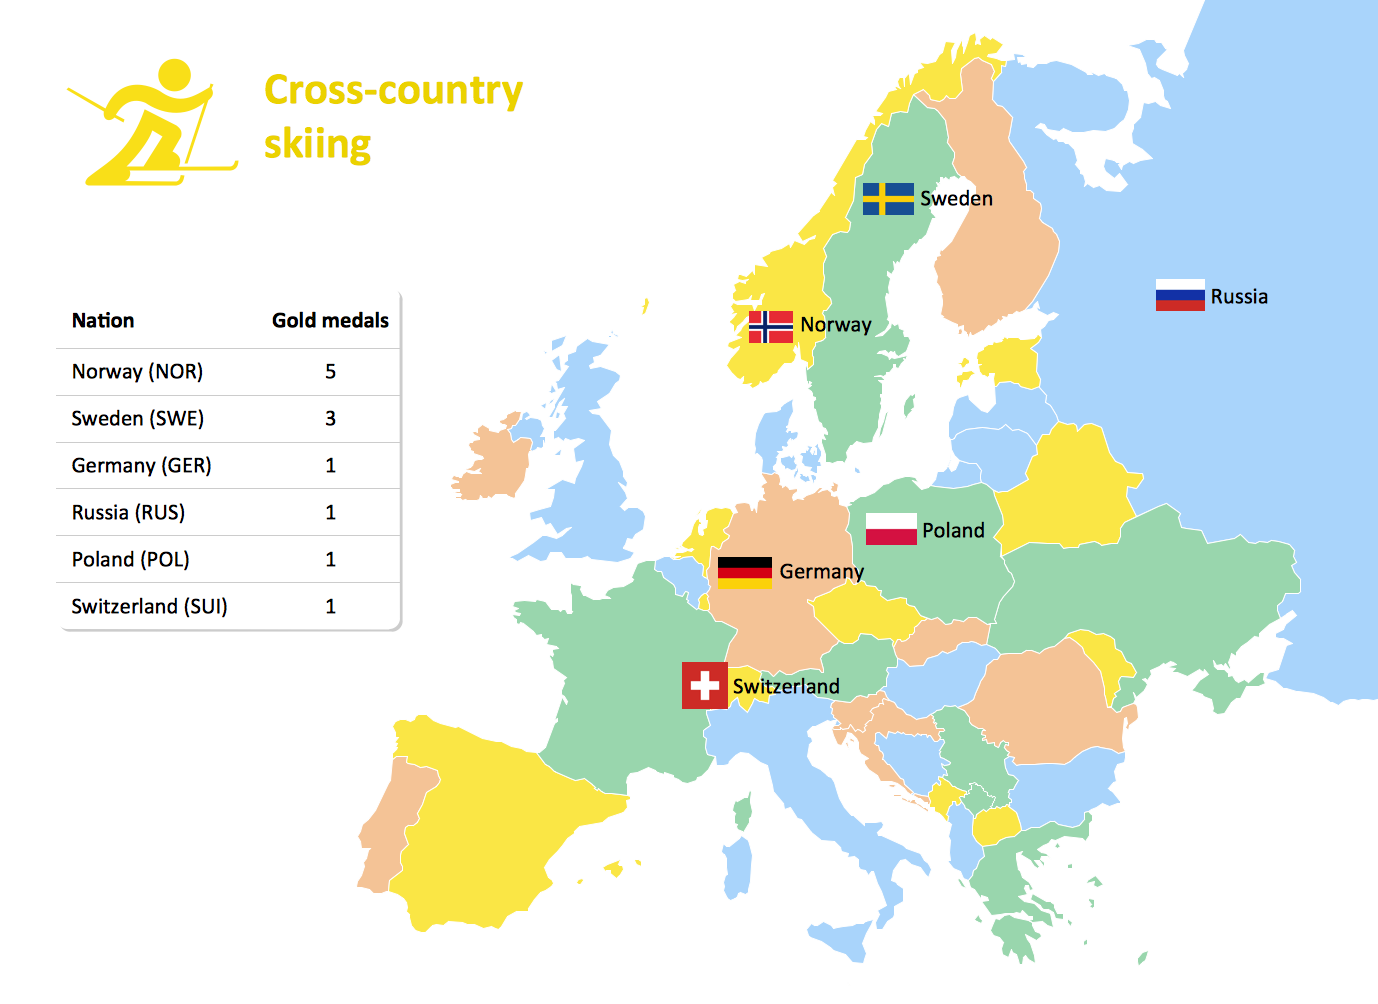
Winter Sports. Olympic Games Infographics. Medal Table
Visualizing data in infographics format is a modern way to represent any statistics related to global sporting events, such as Winter Olympic Games. ConceptDraw PRO software extended with the Winter Sports solution delivers a rich set of samples and templates helps you produce all kind of sporting information, such as tournament schedule or medal table.Basic Diagramming
Create flowcharts, organizational charts, bar charts, line graphs, and more with ConceptDraw PRO.
HelpDesk
How to Create a Typography Infographic Using ConceptDraw PRO
Infographics are a good way to visually share knowledge , to communicate information and illustrate a message. Typography Infographics can help to present at a glance a large pack of complex information in a clear and vivid manner. Designers use the elements of typography Infographics to compose a graphic presentation of an information that is intended to depict the information behind the numbers in a creative and interesting visual way. Each infographic element is used to depict and explain an idea of the current portion of information. Each infographic element must inform its message clearly. ConceptDraw PRO provides the ability to design different kinds of typography infographics. You can use ConceptDraw Typography Infographics solution to create typography infographics effortlessly and quickly using the special set of vector stencils libraries.This example was designed on the base of infographic "Lifestyle Analysis. Method of travel to school in 2011" from the CensusAtSchool Australia website of the Australian Bureau of Statistics (ABS). [abs.gov.au/ websitedbs/ cashome.nsf/ 4a256353001af3ed4b2562bb00121564/ 41b786978bda4617ca25795d0004f35b/ $FILE/ ATT1ZZFV.pdf/ 1infographic_ travel_ 2011.pdf]
"National Summary Tables.
These tables indicate the trends, habits, attitudes and lifestyles of Australian students; however, they don't represent all Australian students, just those who voluntarily completed questionnaires. ...
Tables ... have infographics that you can view and download." [abs.gov.au/ websitedbs/ cashome.nsf/ 4a256353001af3ed4b2562bb00121564/ 1b426c2827e1d7f9ca2578db0015e3b1!OpenDocument]
The infographic example "Lifestyle analysis - Method of travel to school" was created using the ConceptDraw PRO diagramming and vector drawing software extended with the Education Infographics solition from the area "Business Infographics" in ConceptDraw Solution Park.
Used Solutions
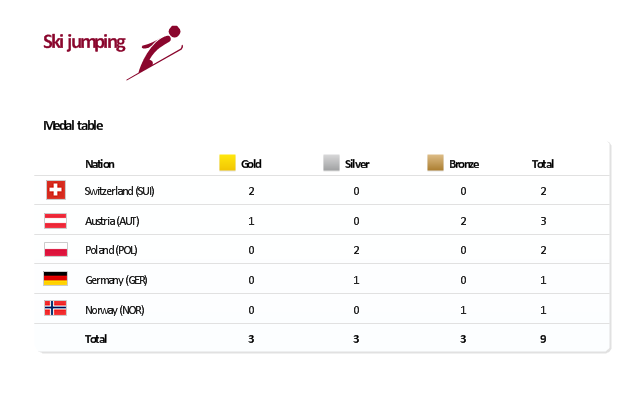
"The ski jumping competition of the Vancouver 2010 Olympics was held at Whistler Olympic Park between 12 and 22 February 2010. ...
For the three events, there are a maximum 70 athletes allowed to compete. No nation can have more than five skiers. For each event, a nation can enter four skiers in individual event or one team in the team event.
Host nation Canada is expected to enter skiers in all events. If no skier meets the qualification standards, they can enter one skier per event.
Quota allocation per nation is based on the World Ranking List (WRL) consisting of Ski Jumping World Cup and Grand Prix points, followed by Continental Cup Standings from the 2008-09 and 2009-10 Ski Jumping World Cup. This will be made by assigning one quota slot per skier from the top of the standings downwards until the maximum five slots have been reached, including host nation Canada." [Ski jumping at the 2010 Winter Olympics. Wikipedia]
This medal table example "Ski jumping at the 2010 Winter Olympics" is created using the ConceptDraw PRO diagramming and vector drawing software extended with the Winter Sports solution.
The Winter Sports solution from the Sport area of ConceptDraw Solution Park contains the vector stencils library "Winter sports pictograms" and examples of diagrams and infographics.
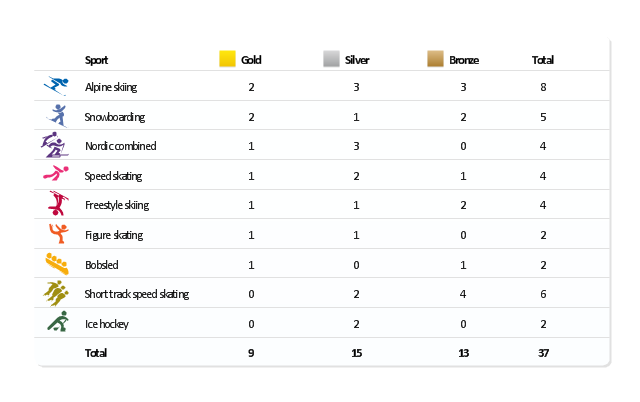
"The United States participated in the 2010 Winter Olympics in Vancouver, British Columbia, Canada. The U.S. team had a historic Winter Games, winning an unprecedented 37 medals. Team USA's medal haul, which included nine gold, marked the first time since the 1932 Lake Placid Games that the U.S. earned more medals than any other participant. ...
The United States finished the 2010 Olympic Games by setting a new record for the most medals won by a single country at a Winter Olympics. The previous record of 36 was set by Germany at the 2002 Winter Olympics; with the silver medal won by the men's hockey team in the final Olympic event of 2010, the U.S. earned their 37th medal of the Vancouver Games. In addition, the U.S. team set a Winter Games record for bronze medals with 13, and the 15 silver medals by the U.S. was second only to the record of 16 set by Germany in 2002." [United States at the 2010 Winter Olympics. Wikipedia]
This medal table example "US at the 2010 Winter Olympics" is created using the ConceptDraw PRO diagramming and vector drawing software extended with the Winter Sports solution.
The Winter Sports solution from the Sport area of ConceptDraw Solution Park contains the vector stencils library "Winter sports pictograms" and examples of diagrams and infographics.
Typography Infographic Software
ConceptDraw PRO supplied with Typography Infographics Solution from the “What are Infographics” Area is a powerful typography infographic software that provides a set of useful typography infographics tools. Use the Typography Infographics Solution for ConceptDraw PRO typography infographic software to create your own professional looking Typography Infographics of any complexity quick, easy and effective, and then successfully use them in various fields.Infographic Generator
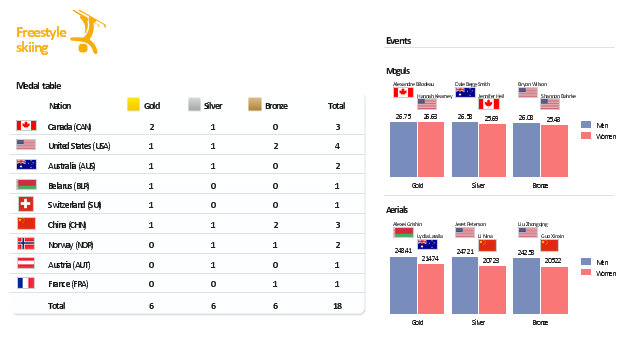
ConceptDraw PRO extended with Typography Infographics Solution from the “What are Infographics” Area is the best Infographic Generator. Make sure in it right now! Typography Infographics Solution offers you the best numerous collection of predesigned infographics examples and 9 libraries with large quantity of ready-to-use vector stencils that will help you design your own Typography Infographics of any complexity in minutes.."The freestyle skiing competition of the 2010 Winter Olympics was held at Cypress Mountain. The events took place between the 13 and 25 February 2010, and included a new event for these Olympics, ski cross. ...
For the six events, there are a maximum 180 athletes allowed to compete. This includes a maximum of 30 in moguls, 25 in aerials, and 35 in ski cross, applicable for both genders. No nation can have more than 18 skiers with maximum of ten men or ten women per specific nation. For each event, no nation can enter more than four skiers per individual event.
Skiers are qualified if they have placed in the top 30 in an FIS World Cup event of FIS World Championships in the event concerned. A minimum of 100 FIS points in the respective event. Host nation Canada is expected to enter a skier in all events. If no skier meets the qualification standards, they can enter one skier per event.
Quota allocation will be given using the World Ranking List (WRL) for the twelve-month period of World Cup Standings from the 2008-09 and 2009-10 Freestyle World Cup and the FIS Freestyle World Ski Championships 2009. It will be assigned one slot per skier from the top the WRL downwards. When a nation has the maximum four skiers per event, the next eligible nation on the WRL will be given a slot until the maximum total per event in moguls, aerials, and ski cross per gender has been reached." [Freestyle skiing at the 2010 Winter Olympics. Wikipedia]
This medal table example "Medal summary - Freestyle skiing at the 2010 Winter Olympics" is created using the ConceptDraw PRO diagramming and vector drawing software extended with the Winter Sports solution.
The Winter Sports solution from the Sport area of ConceptDraw Solution Park contains the vector stencils library "Winter sports pictograms" and examples of diagrams and infographics.
Infographic Tools
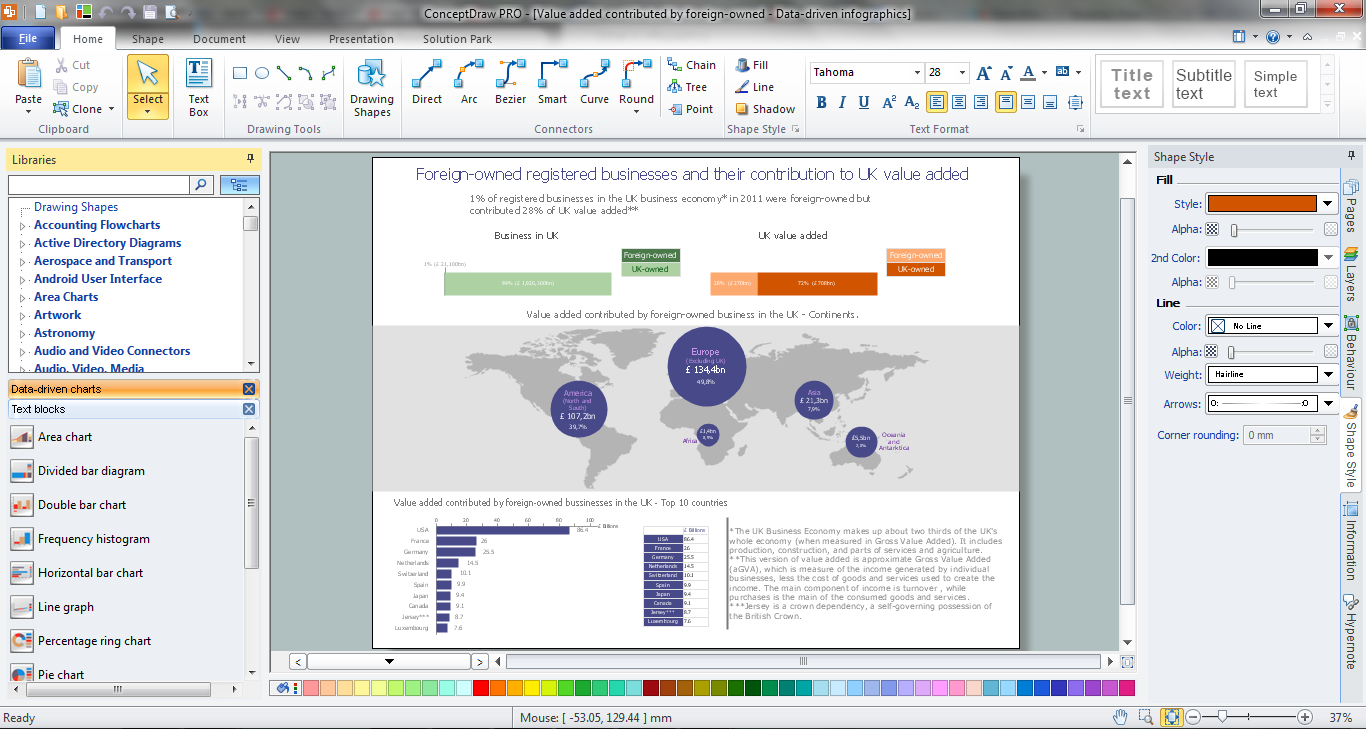
ConceptDraw PRO diagramming and vector drawing software offers the best infographic tools - Data-driven Infographics Solution from the “What are Infographics” Area of ConceptDraw Solution Park.Typography Art
Typography Infographics Solution for ConceptDraw Solution Park is the best answer on the question “How to create an Infographic?”. The Typography Infographics created in ConceptDraw PRO using the Typography Infographics Solution are the real typography art.- Winter Sports. Olympic Games Infographics . Medal Table | Design ...
- Winter Sports. Olympic Games Infographics . Medal Table | How to ...
- Winter Sports. Olympic Games Infographics . Medal Table ...
- Basic Diagramming | Winter Sports. Olympic Games Infographics ...
- Design elements - Tables | How to Create a Typography Infographic ...
- Design elements - Callouts | Tables and figures show - Infographics ...
- Winter Sports. Olympic Games Infographics . Medal Table ...
- Winter Sports. Olympic Games Infographics . Medal Table | Winter ...
- Table Clip Art
- Design elements - Tables | Tables ' Beauty | Tables - Vector stencils ...
- Winter Sports. Olympic Games Infographics . Medal Table | Sport ...
- Winter Sports. Olympic Games Infographics . Medal Table | Medals ...
- Winter Sports. Olympic Games Infographics . Medal Table | Winter ...
- Design elements - Tables | Table Seating Chart Template | Symbol ...
- Winter Sports | Winter Sports. Olympic Games Infographics . Medal ...
- Winter Sports. Olympic Games Infographics . Medal Table | Business ...
- Education Infographics | Educational Technology Tools | Make an ...
- Winter Sports. Olympic Games Infographics . Medal Table | Spatial ...
- Design elements - Periodic table of chemical elements | Chemistry ...
- Winter Sports. Olympic Games Infographics . Medal Table | Area ...

