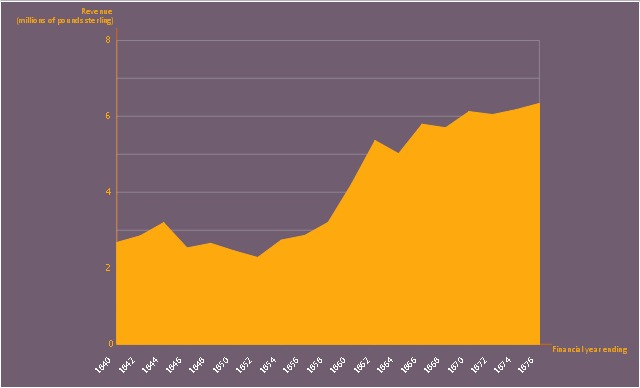
This area chart sample shows the revenue collected by the East India Company (after 1858 the British government) from salt (including inland and port taxes and sale of government salt). It was designed on the base of the Wikimedia Commons file: British India salt revenue 1840-1877.png.
[commons.wikimedia.org/ wiki/ File:British_ India_ salt_ revenue_ 1840-1877.png]
This file is licensed under the Creative Commons Attribution-Share Alike 3.0 Unported license. [creativecommons.org/ licenses/ by-sa/ 3.0/ deed.en]
"The Inland Customs Line which incorporated the Great Hedge of India (or Indian Salt Hedge[1]) was a customs barrier built by the British across India primarily to collect the salt tax. The customs line was begun while India was under the control of the East India Company but continued into the period of direct British rule. The line had its beginnings in a series of customs houses that were established in Bengal in 1803 to prevent the smuggling of salt to avoid the tax. These customs houses were eventually formed into a continuous barrier that was brought under the control of the Inland Customs Department in 1843." [Inland Customs Line. Wikipedia]
The area graph example "British India salt revenue 1840-1877" was created using the ConceptDraw PRO diagramming and vector drawing software extended with the Area Charts solution from the Graphs and Charts area of ConceptDraw Solution Park.
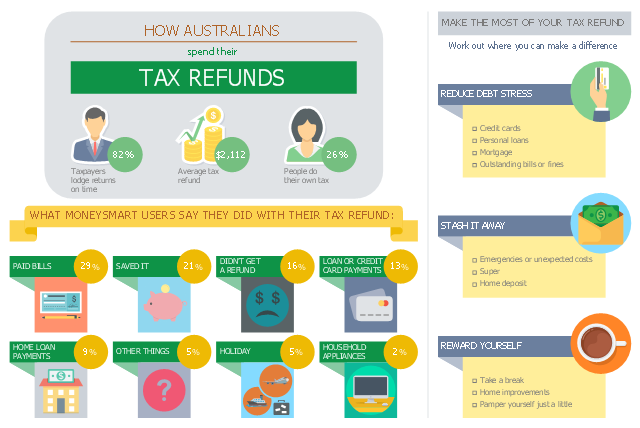
This business infographic sample shows the average tax refund and how people say they spent last year's tax refund. It was designed on the base of the infographic "How Australians spend their tax refunds" from the MoneySmart website of the Australian Securities and Investments Commission (ASIC).
[moneysmart.gov.au/ managing-your-money/ income-tax/ how-australians-spend-their-tax-refunds]
"A tax refund or tax rebate is a refund on taxes when the tax liability is less than the taxes paid. Taxpayers can often get a tax refund on their income tax if the tax they owe is less than the sum of the total amount of the withholding taxes and estimated taxes that they paid, plus the refundable tax credits that they claim. (Tax refunds are money given back at the end of the financial year.)" [Tax refund. Wikipedia]
The business infographic example "How Australians spend their tax refunds" was designed using ConceptDraw PRO diagramming and vector drawing software extended with the Business and Finance solution from Illustration area of ConceptDraw Solution Park.
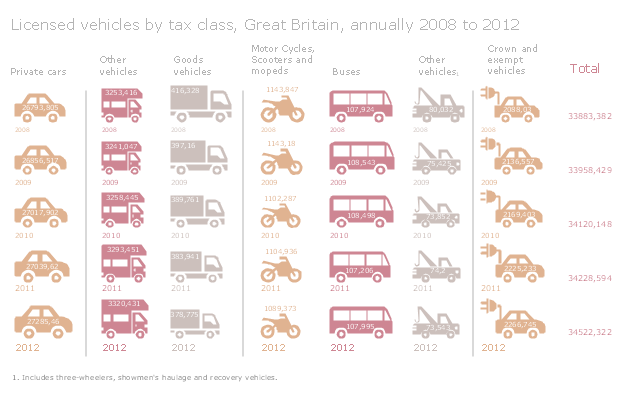
This infographic sample was created on the base of "Transport Statistics Great Britain 2013" from the website of UK Department for Transport. [gov.uk/ government/ publications/ transport-statistics-great-britain-2013]
The infographics example "Licensed vehicles by tax class, Great Britain, annually: 2008 to 2012" was created using the ConceptDraw PRO diagramming and vector drawing software extended with the Pictorial Infographic solition from the area "What is infographics" in ConceptDraw Solution Park.
The infographics example "Licensed vehicles by tax class, Great Britain, annually: 2008 to 2012" was created using the ConceptDraw PRO diagramming and vector drawing software extended with the Pictorial Infographic solition from the area "What is infographics" in ConceptDraw Solution Park.
The vector stencils library "HR workflow" contains 60 HR workflow symbols.
Use this HR icon set to draw your HR flowcharts, workflow diagrams and process charts with the ConceptDraw PRO diagramming and vector drawing software.
The HR pictograms library "HR workflow" is included in the HR Flowcharts solution from the Management area of ConceptDraw Solution Park.
Use this HR icon set to draw your HR flowcharts, workflow diagrams and process charts with the ConceptDraw PRO diagramming and vector drawing software.
The HR pictograms library "HR workflow" is included in the HR Flowcharts solution from the Management area of ConceptDraw Solution Park.
Scatter Graph Charting Software
ConceptDraw provides some interactive xy chart and scatter graph symbols that offers advanced features yet is simple to use."Household income is a measure of the combined incomes of all people sharing a particular household or place of residence. It includes every form of income, e.g., salaries and wages, retirement income, near cash government transfers like food stamps, and investment gains.
Average household income can be used as an indicator for the monetary well-being of a country's citizens. Mean or median net household income, after taxes and mandatory contributions, are good indicators of standard of living, because they include only disposable income and acknowledge people sharing accommodation benefit from pooling at least some of their living costs.
Average household incomes need not map directly to measures of an individual's earnings such as per capita income as numbers of people sharing households and numbers of income earners per household can vary significantly between regions and over time." [Household income. Wikipedia]
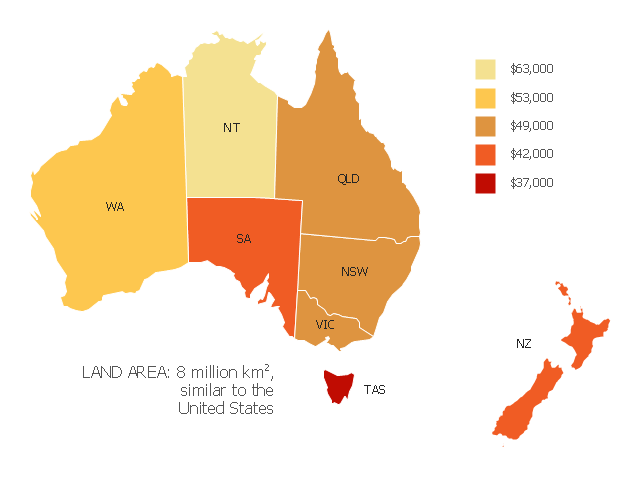
This map example shows 2007 median household incomes in the states and mainland territories of the Commonwealth of Australia.
The thematic map example "Map of median household income in Australia" was redesigned from the Wikimedia Commons file: Map of median household income in Australia.PNG.
[commons.wikimedia.org/ wiki/ File:Map_ of_ median_ household_ income_ in_ Australia.PNG]
The example "Map of median household income in Australia" was created using the ConceptDraw PRO diagramming and vector drawing software extended with the Continent Map solution from the Maps area of ConceptDraw Solution Park.
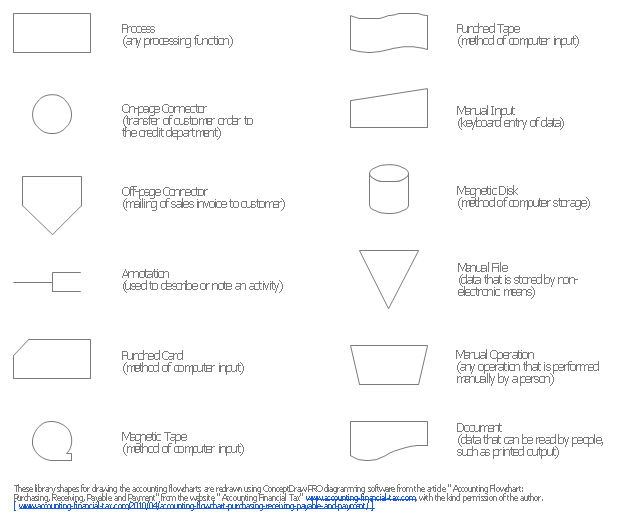
The vector stencils library "Accounting flowcharts" contains 14 flow chart symbols.
This library was created according the article " Accounting Flowchart: Purchasing, Receiving, Payable and Payment"
http:/ / accounting-financial-tax.com/ 2010/ 04/ accounting-flowchart-purchasing-receiving-payable-and-payment/
from the website " Accounting Financial Tax" http:/ / accounting-financial-tax.com , with the kind permission of the author.
Use this library for drawing the accounting flowcharts in the ConceptDraw PRO software extended with the Accounting Flowcharts solution from the Finance and Accounting area of ConceptDraw Solution Park.
www.conceptdraw.com/ solution-park/ finance-accounting-flowcharts
The vector stencils library "Accounting flowcharts" contains 14 symbols for drawing accounting flow charts.
This library was created according the article " Accounting Flowchart: Purchasing, Receiving, Payable and Payment"
http:/ / accounting-financial-tax.com/ 2010/ 04/ accounting-flowchart-purchasing-receiving-payable-and-payment/
from the website " Accounting Financial Tax" http:/ / accounting-financial-tax.com , with the kind permission of the author.
The example "Design elements - Accounting flowcharts" was created using the ConceptDraw PRO diagramming and vector drawing software extended with the Accounting Flowcharts solution from the Finance and Accounting area of ConceptDraw Solution Park.
Bar Diagrams for Problem Solving. Create economics and financial bar charts with Bar Graphs Solution
Create bar graphs for visualizing economics problem solving and financial data comparison using the ConceptDraw PRO diagramming and vector drawing software extended with the Bar Graphs Solution from the Graphs and Charts area of ConceptDraw Solition Park.This accounting flowchart example was redrawn from the article "Accounting flowchart: Purchasing, Receiving, Payable and Payment" from the website "Accounting Financial Tax" www.accounting-financial-tax.com , with the kind permission of the author.
[ www.accounting-financial-tax.com/ 2010/ 04/ accounting-flowchart-purchasing-receiving-payable-and-payment/ ]
The example "Payment flowchart (for treasurer)" was created using the ConceptDraw PRO software extended with the Accounting Flowcharts solution from the Finance and Accounting area of ConceptDraw Solution Park.
Chart Templates
Easy charting software comes with beautiful chart templates and examples. This makes it easy to create professional charts without prior experience.Chart Examples
Easy charting software comes with beautiful chart templates and examples. This makes it easy to create professional charts without prior experience.
 Accounting Flowcharts
Accounting Flowcharts solution extends ConceptDraw PRO software with templates, samples and library of vector stencils for drawing the accounting flow charts.
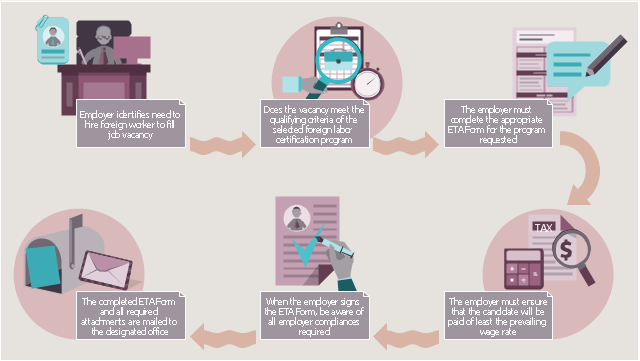
This HR infographics example was designed on the base of workflow diagram in the webpage "About Foreign Labor Certification" from the website of the U.S. Department of Labor.
"Hiring foreign workers for employment in the U.S. normally requires approval from several government agencies. ...
Although each foreign labor certification program is unique, there are similar requirements that the employer must complete prior to the issuance of a labor certification. In general, the employer will be required to complete these basic steps to obtain a labor certification:
1. The employer must ensure that the position meets the qualifying criteria for the requested program.
2. The employer must complete the ETA form designated for the requested program. This may include the form and any supporting documentation (e.g., job description, resume of the applicant, etc.).
3. The employer must ensure that the wage offered equals or exceeds the prevailing wage for the occupation in the area of intended employment.
4. The employer must ensure that the compliance issues effected upon receipt of a foreign labor certification are completely understood.
5. The completed ETA form is submitted to the designated Department of Labor office for the requested program (e.g., SWA, processing center or the national office).
6. The employer is notified of the determination of the Department of Labor."
[foreignlaborcert.doleta.gov/ about.cfm]
The HR infographics example "Foreign labor certification workflow" was created using the ConceptDraw PRO diagramming and vector drawing software extended with the HR Flowcharts solution from the Management area of ConceptDraw Solution Park.
 Pie Charts
Pie Charts are extensively used in statistics and business for explaining data and work results, in mass media for comparison (i.e. to visualize the percentage for the parts of one total), and in many other fields. The Pie Charts solution for ConceptDraw PRO v10 offers powerful drawing tools, varied templates, samples, and a library of vector stencils for simple construction and design of Pie Charts, Donut Chart, and Pie Graph Worksheets.
- Vector Tax Png
- Effects of taxes and benefits | Cause and effect diagram - Increase in ...
- Accounting Png Clipart
- Licensed vehicles by tax class, Great Britain, annually: 2008 to 2012 ...
- Abstract Png
- Organizational Socialization Png
- Job Employee Succes Png
- Types of Flowchart - Overview | Non It Recruitment Clipart Color Png
- Humen Awards Png
- Truck Png Top
- Award Png Images
- Icon Job Disk Png
- Spending Icon Png
- Hiring Vector Png
- Exhibition Vector Png
- Socialization Png
- Employment Clipart Png
- Site Plans | Vector Post Van Png
- Png Job Vacancy
- Award Logo Vector Png


-hr-workflow---vector-stencils-library.png--diagram-flowchart-example.png)




-hr-workflow---vector-stencils-library.png--diagram-flowchart-example.png)






.png--diagram-flowchart-example.png)


