Total Quality Management Value

The vector stencils library "Cause-and-effect diagram" contains 13 elements of fishbone diagram.
Use it to design your Ishikawa diagrams with ConceptDraw PRO diagramming and vector drawing software.
"Ishikawa diagrams (also called fishbone diagrams, herringbone diagrams, cause-and-effect diagrams, or Fishikawa) are causal diagrams created by Kaoru Ishikawa (1968) that show the causes of a specific event. Common uses of the Ishikawa diagram are product design and quality defect prevention to identify potential factors causing an overall effect. Each cause or reason for imperfection is a source of variation. Causes are usually grouped into major categories to identify these sources of variation. ...
The basic concept was first used in the 1920s, and is considered one of the seven basic tools of quality control." [Ishikawa diagram. Wikipedia]
The example of fishbone diagram shapes "Design elements - Cause-and-effect diagram" is included in the Seven Basic Tools of Quality solution from the Quality area of ConceptDraw Solution Park.
Fishbone diagram elements

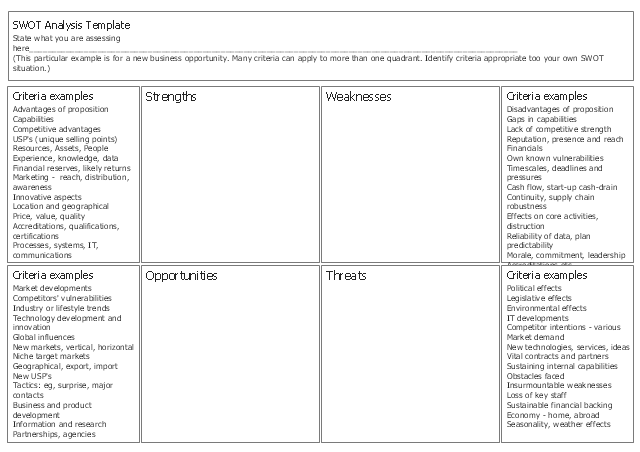
"SWOT Analysis.
A way to identify and analyze a company's goals by assessing its strength, weaknesses, opportunities, and threats. An advantage to SWOT analysis is that it separates internal factors (strengths and weaknesses) from external ones (opportunities and threats). This allows the company to match what it could do in theory with what is possible in reality. Another advantage is the fact that conducting SWOT analysis is straightforward if the company conducting it is honest with itself." [financial-dictionary.thefreedictionary.com/ SWOT+Analysis]
This form template "New business opportunity SWOT analysis matrix" for the ConceptDraw PRO diagramming and vector drawing software is included in the SWOT Analysis solution from the Management area of ConceptDraw Solution Park.
SWOT matrix template
- Cause and Effect Diagrams | How Do Fishbone Diagrams Solve ...
- Draw Fishbone Diagram on MAC Software | Cause and Effect ...
- Cause and Effect Diagrams | Cause and Effect Analysis - Fishbone ...
- Cause and Effect Analysis - Fishbone Diagrams for Problem Solving ...
- How Do Fishbone Diagrams Solve Manufacturing Problems | TQM ...
- Total Quality Management Value | Seven Basic Tools of Quality ...
- How To Convert a Fishbone Diagram to Adobe PDF Using ...
- How Do Fishbone Diagrams Solve Manufacturing Problems | Basic ...
- Probability Quality Control Tools | Total Quality Management Value ...
- Total Quality Management Value | Cause and effect diagram ...
- Total Quality Management TQM Diagrams | Process Flowchart ...
- Fishbone diagram - Causes of low-quality output | Design elements ...
- How to Construct a Fishbone Diagram | Cause and Effect Diagram ...
- Seven Management and Planning Tools | Seven Management and ...
- 7 Management & Planning Tools | Process Flowchart | Basic ...
- Seven Basic Tools of Quality - Histogram | House of Quality Matrix ...
- Cause and Effect Diagram | How Do Fishbone Diagrams Solve ...
- Cause and Effect Diagram | Cause and Effect Analysis | Cause and ...
- Process Flowchart | TQM Software — Build Professional TQM ...
- Total Quality Management Value | Fishbone Diagram Problem ...