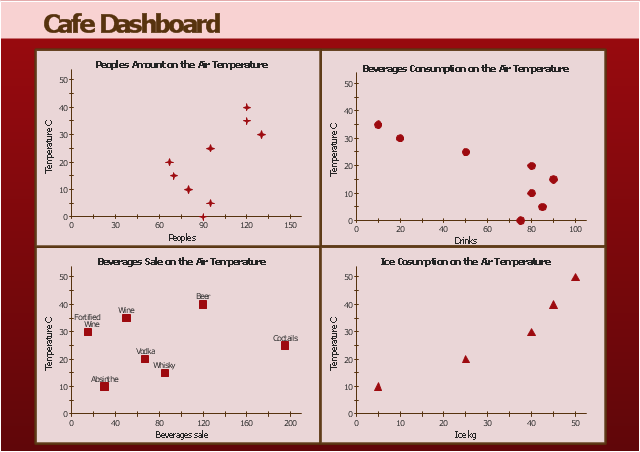
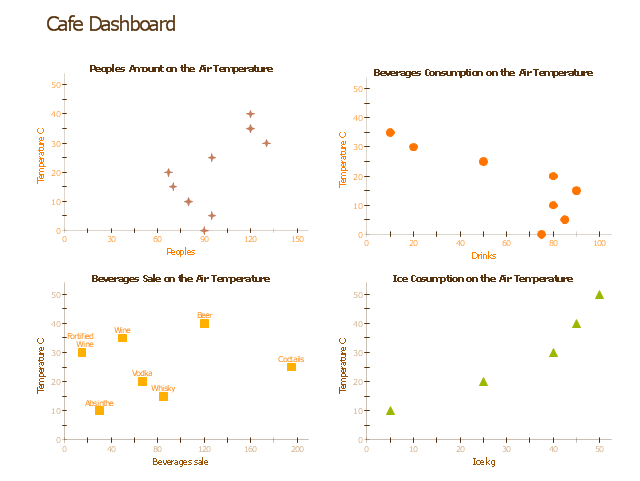
The scatter plots in this example of visual dashboard are used to visualize correlations between the air temperature and the cafe business metrics: visitors number, beverage consumption, beverage sale, ice consumption.
"In statistics, dependence is any statistical relationship between two random variables or two sets of data. Correlation refers to any of a broad class of statistical relationships involving dependence. ...
Correlations are useful because they can indicate a predictive relationship that can be exploited in practice. ...
Formally, dependence refers to any situation in which random variables do not satisfy a mathematical condition of probabilistic independence. In loose usage, correlation can refer to any departure of two or more random variables from independence, but technically it refers to any of several more specialized types of relationship between mean values." [Correlation and dependence. Wikipedia]
The example "Air temperature correlations - Cafe dashboard" was created using the ConceptDraw PRO diagramming and vector drawing software extended with the Corellation Dashboard solution from the area "What is a Dashboard" of ConceptDraw Solution Park.
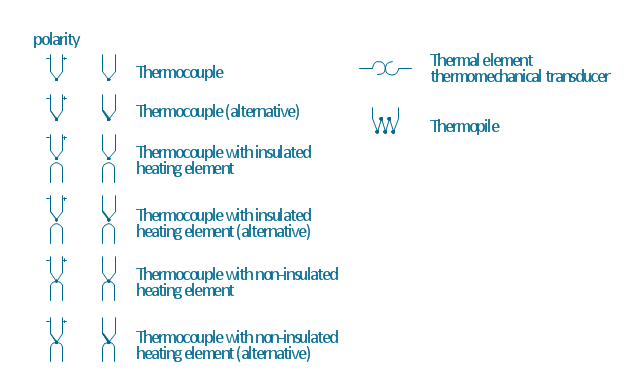
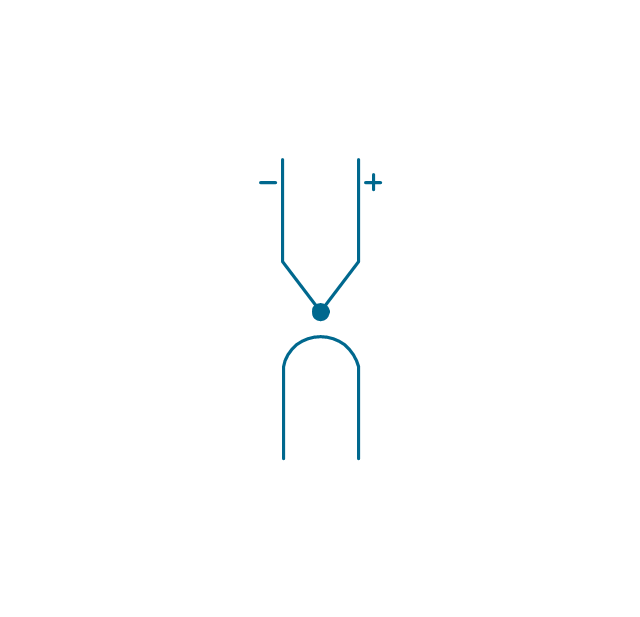
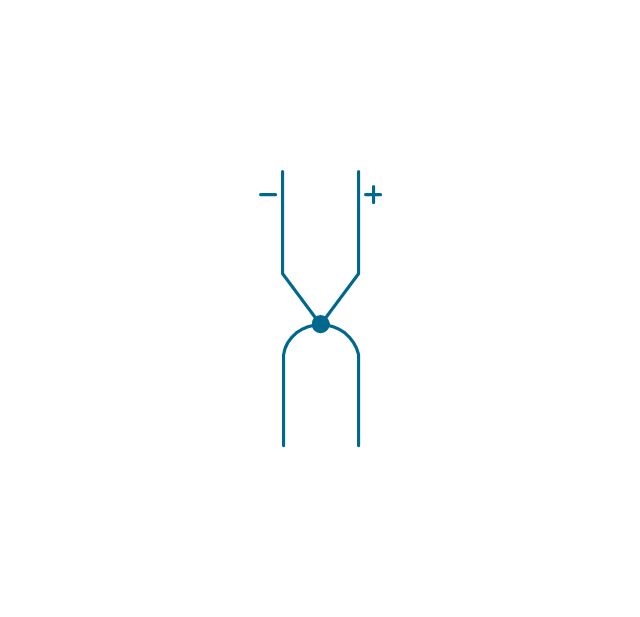
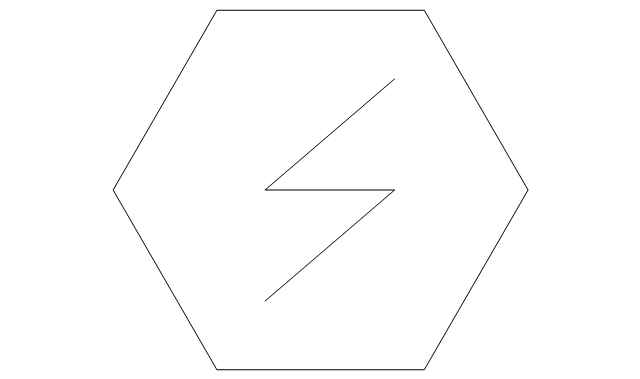
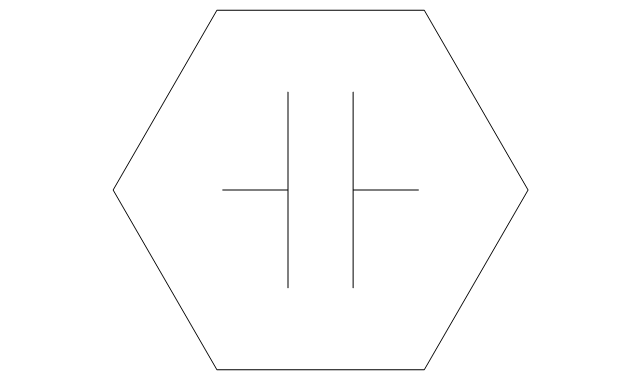
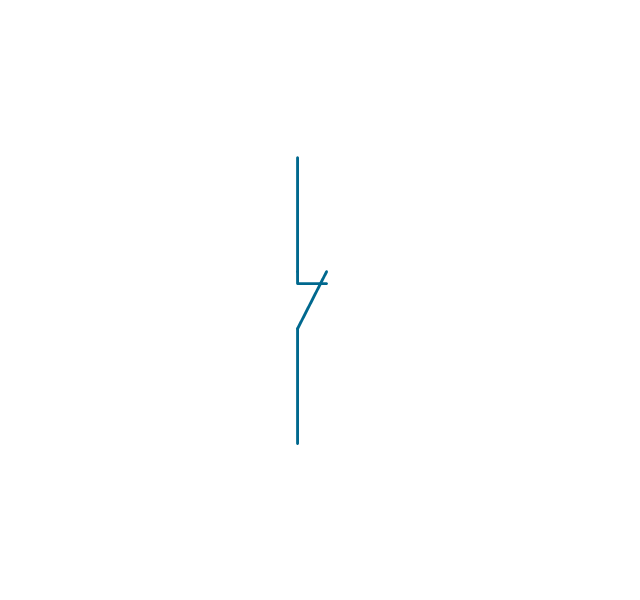
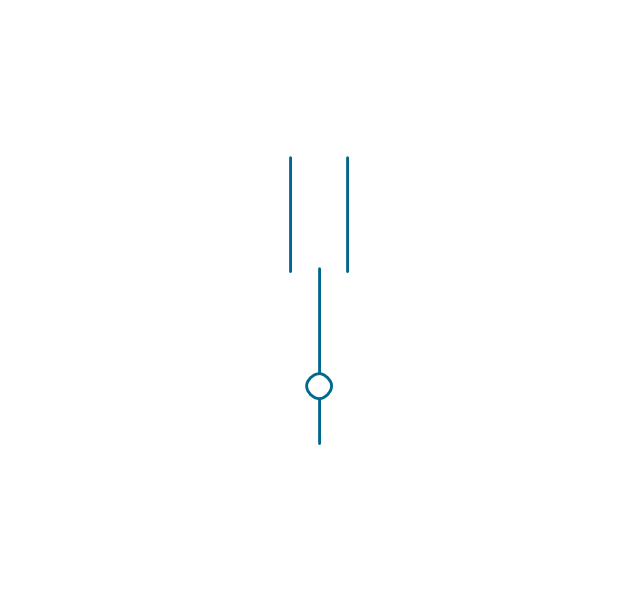
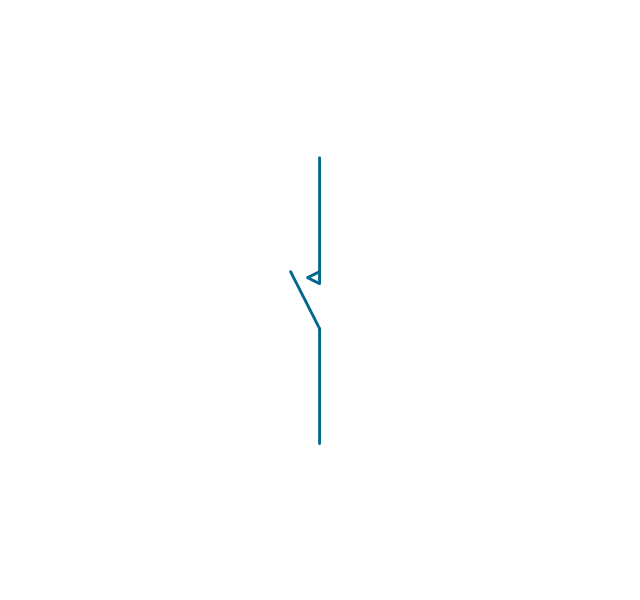
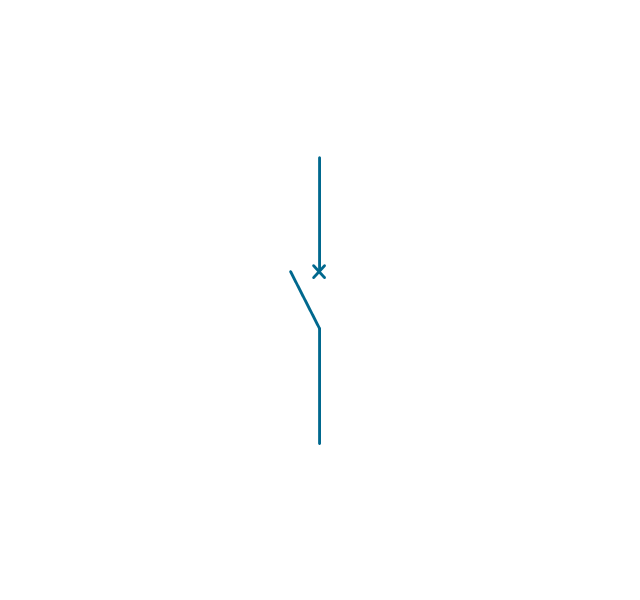
The vector stencils library "Thermo" contains 14 symbols of thermoelectric elements: thermal element, thermocouples with and without heating elements, thermoplile.
Use it for drawing electrical layouts, electronic schematics, and circuit diagrams.
"The thermoelectric effect is the direct conversion of temperature differences to electric voltage and vice versa. A thermoelectric device creates voltage when there is a different temperature on each side. Conversely, when a voltage is applied to it, it creates a temperature difference. At the atomic scale, an applied temperature gradient causes charge carriers in the material to diffuse from the hot side to the cold side.
This effect can be used to generate electricity, measure temperature or change the temperature of objects. Because the direction of heating and cooling is determined by the polarity of the applied voltage, thermoelectric devices can be used as temperature controllers.
The term "thermoelectric effect" encompasses three separately identified effects: the Seebeck effect, Peltier effect, and Thomson effect. Textbooks may refer to it as the Peltier–Seebeck effect. ...
Thermocouples and thermopiles are devices that use the Seebeck effect to measure the temperature difference between two objects, one connected to a voltmeter and the other to the probe. The temperature of the voltmeter, and hence that of the material being measured by the probe, can be measured separately using cold junction compensation techniques." [Thermoelectric effect. Wikipedia]
The shapes example "Design elements - Thermo" was drawn using the ConceptDraw PRO diagramming and vector drawing software extended with the Electrical Engineering solution from the Engineering area of ConceptDraw Solution Park.
"A performance metric is that which determines an organization's behavior and performance. Performance metrics measure of an organization's activities and performance. It should support a range of stakeholder needs from customers, shareholders to employees. While traditionally many metrics are finance based, inwardly focusing on the performance of the organization, metrics may also focus on the performance against customer requirements and value. In project management, performance metrics are used to assess the health of the project and consist of the measuring of seven criteria: safety, time, cost, resources, scope, quality, and actions. Developing performance metrics usually follows a process of: 1. Establishing critical processes/ customer requirements. 2. Identifying specific, quantifiable outputs of work. 3. Establishing targets against which results can be scored." [Performance metric. Wikipedia] The example "Cafe performance metrics vs. air temperature - Visual dashboard" was created using the ConceptDraw PRO diagramming and vector drawing software extended with the Corellation Dashboard solution from the area "What is a Dashboard" of ConceptDraw Solution Park.
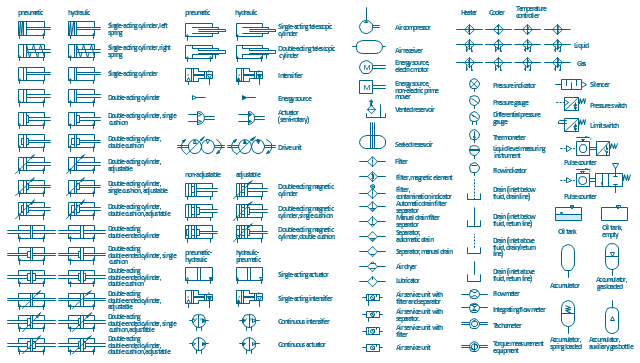
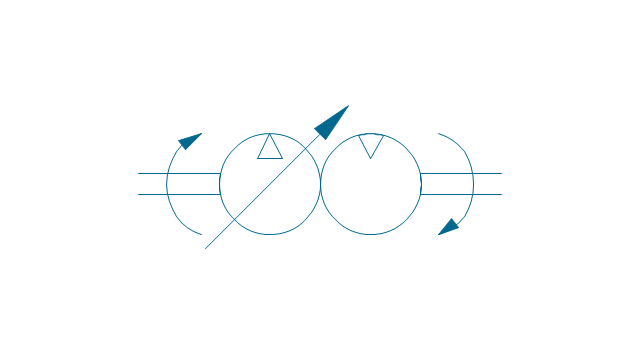
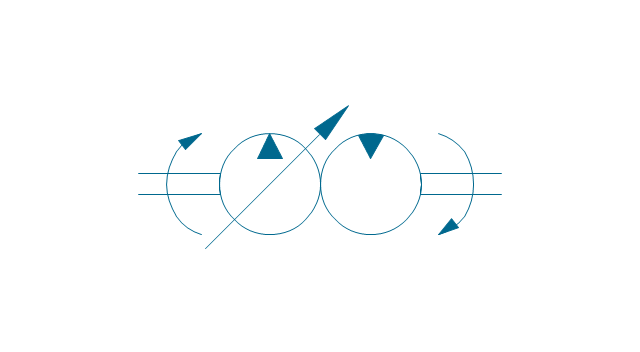
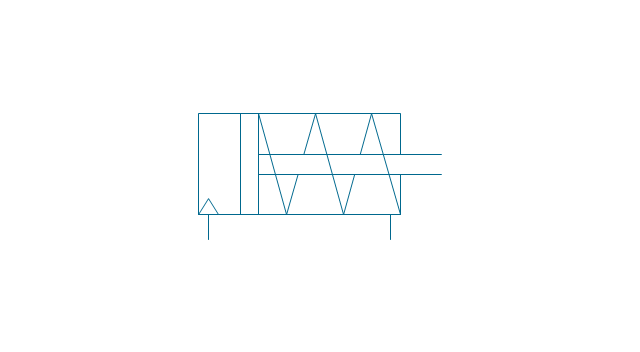
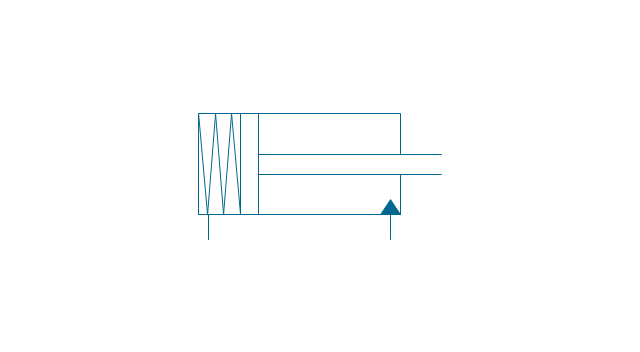
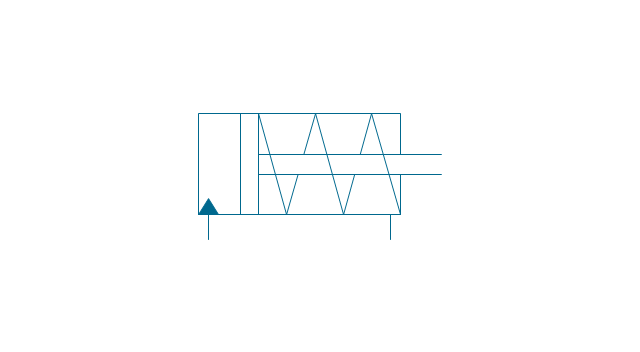
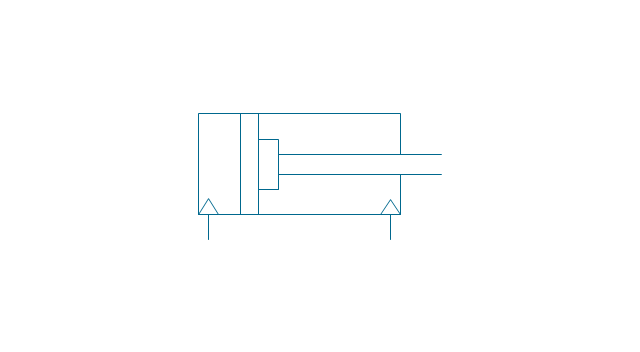
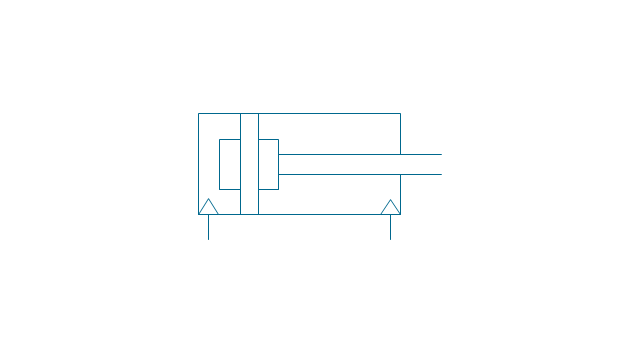
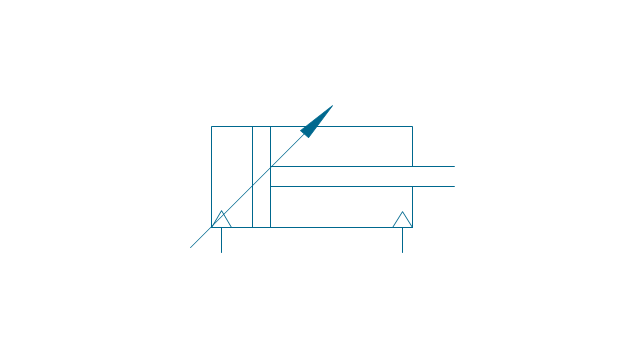
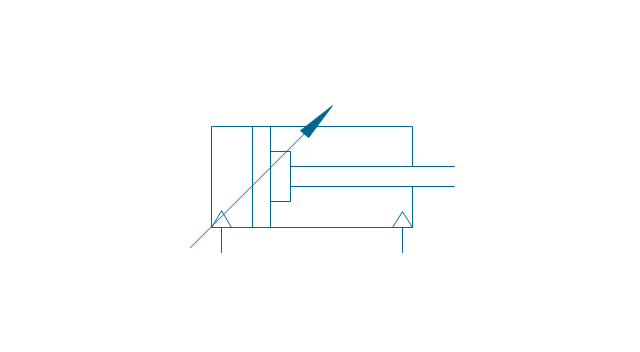
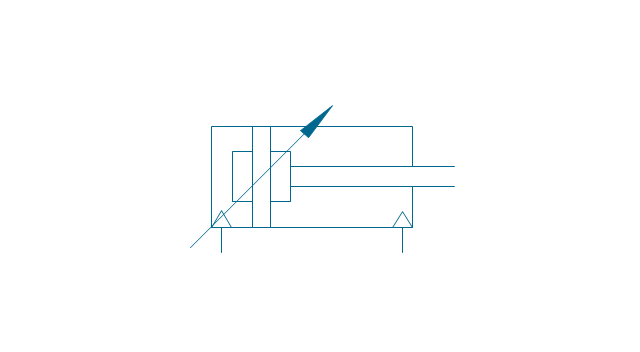
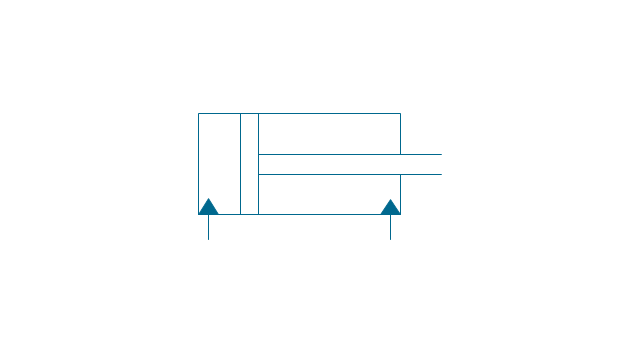
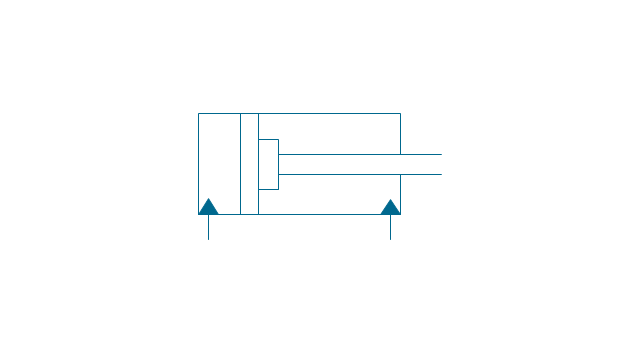
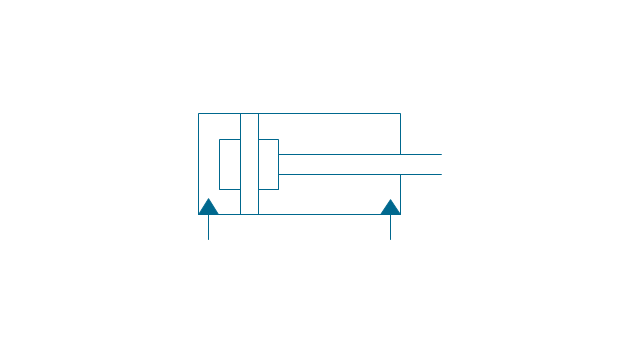
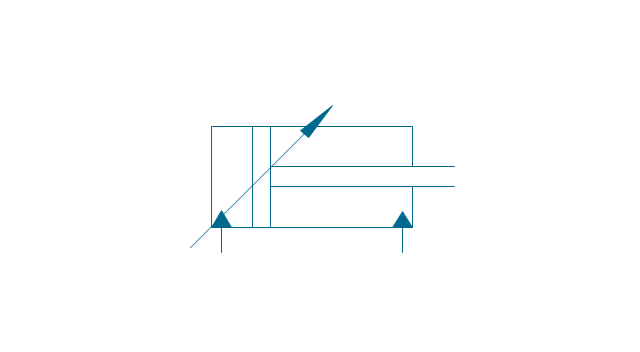
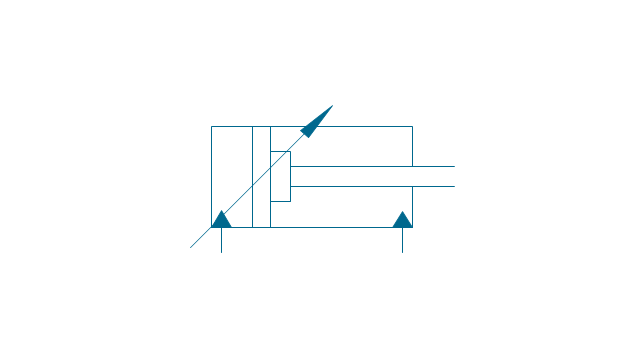
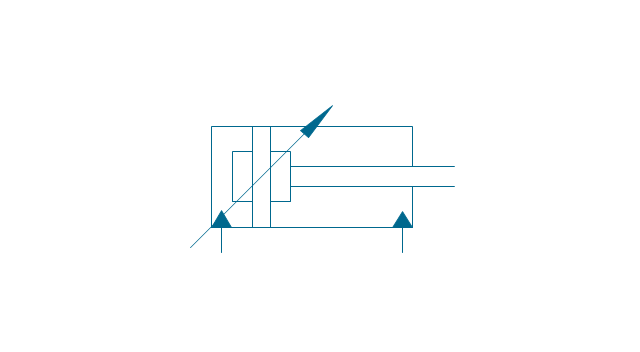
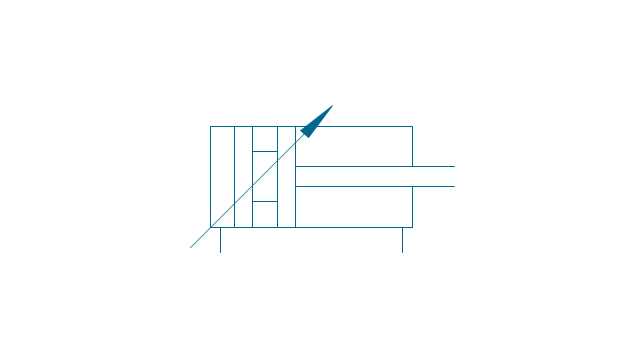
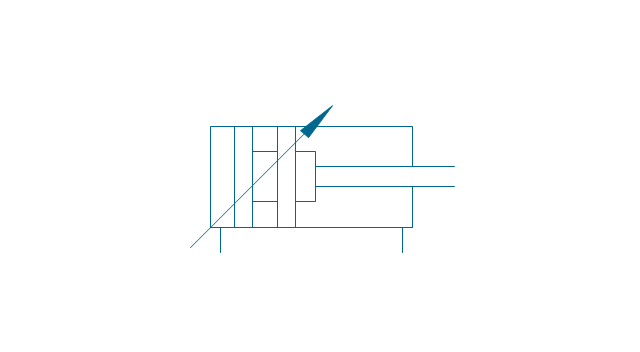
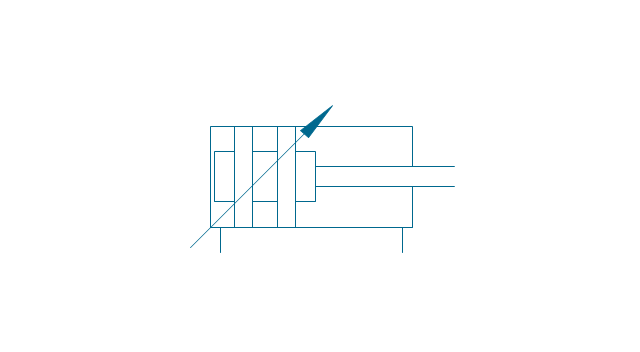
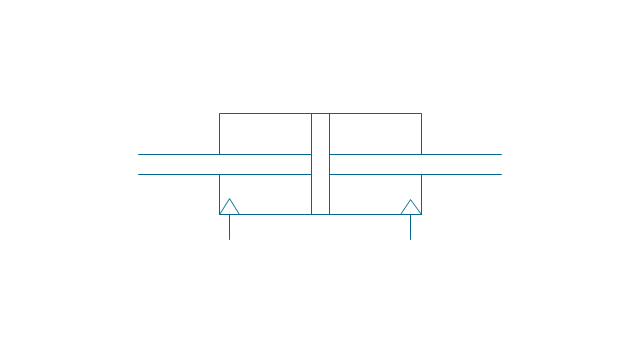
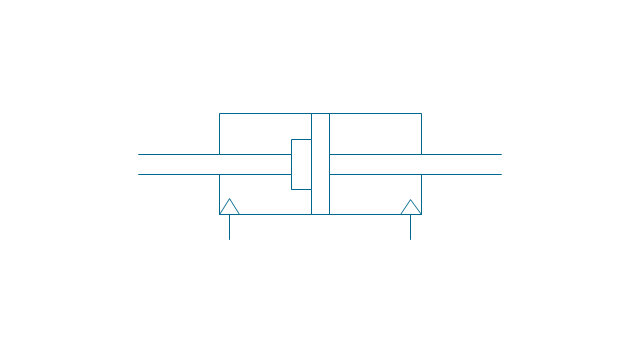
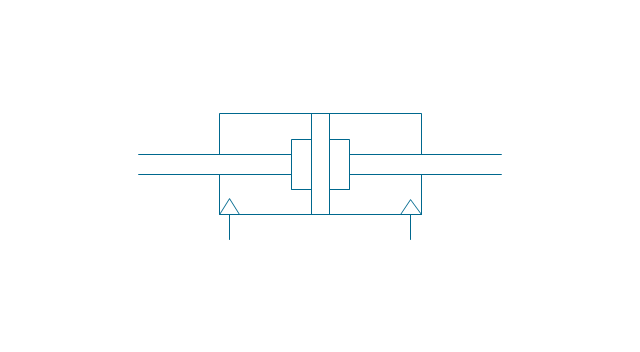
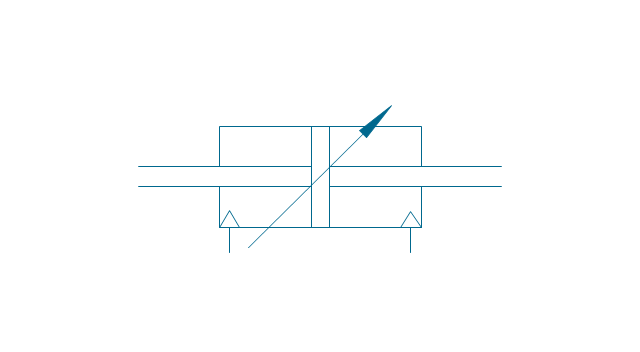
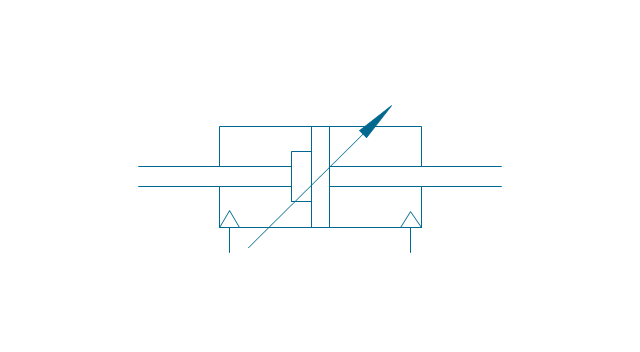
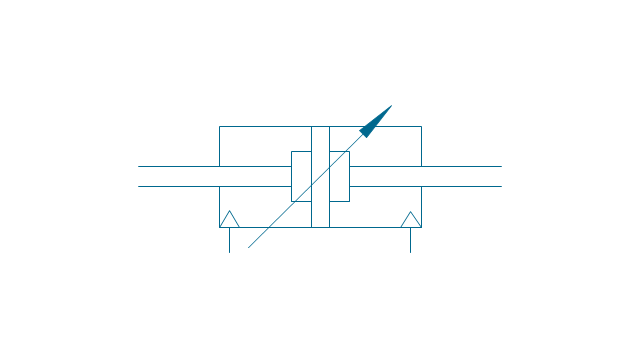
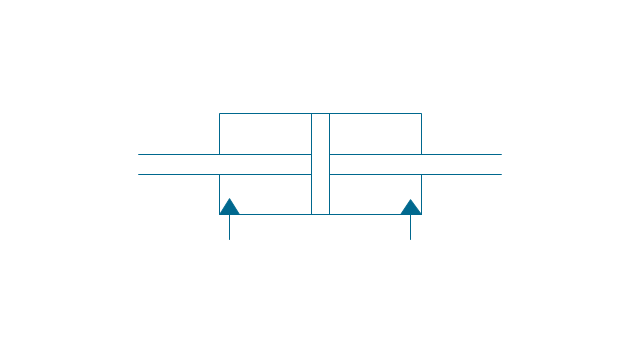
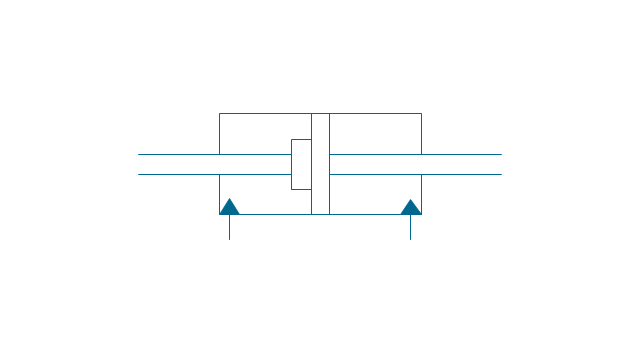
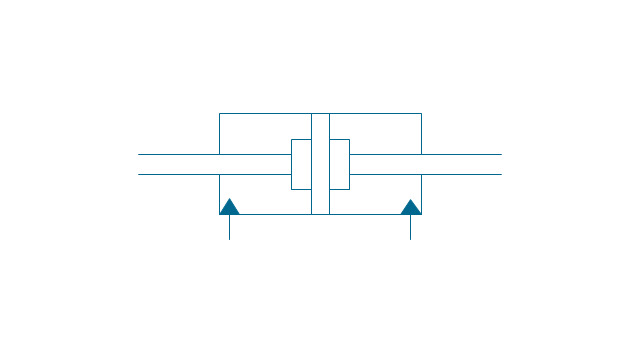
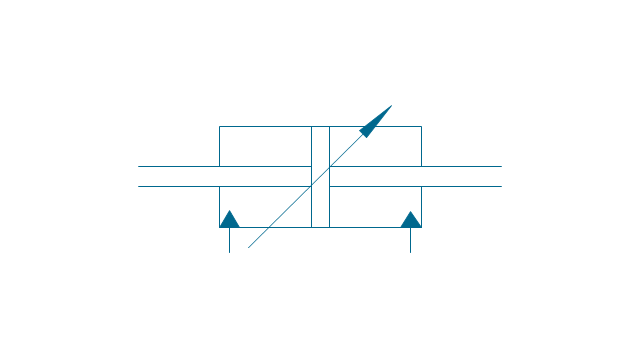
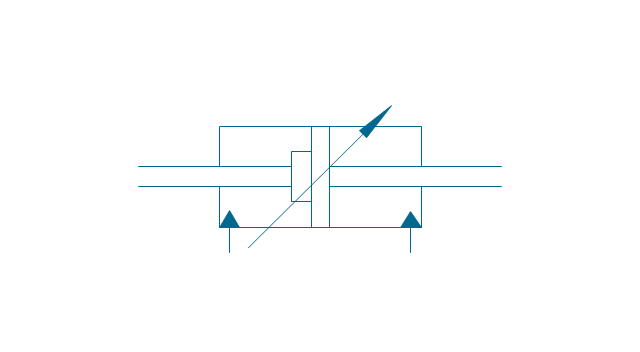
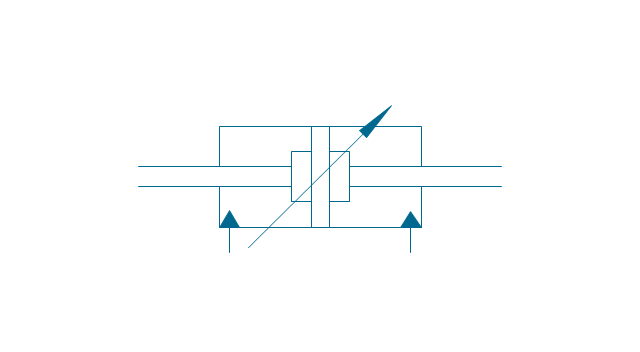
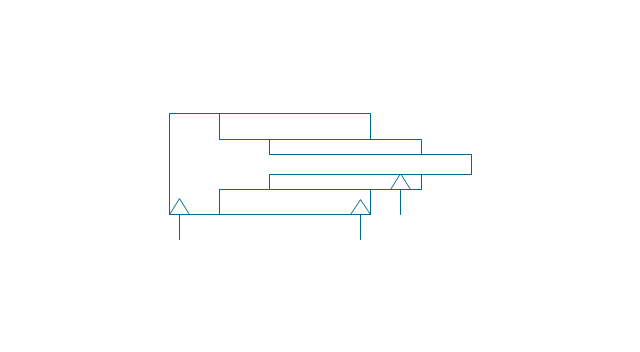
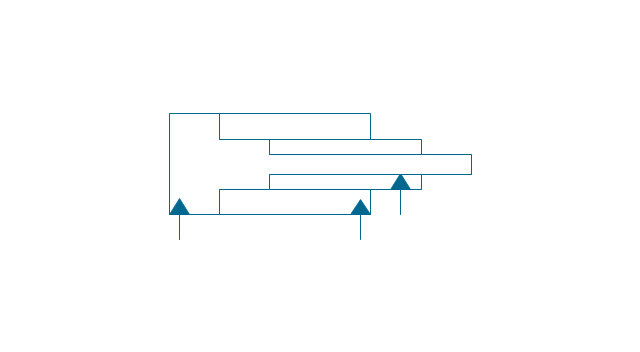
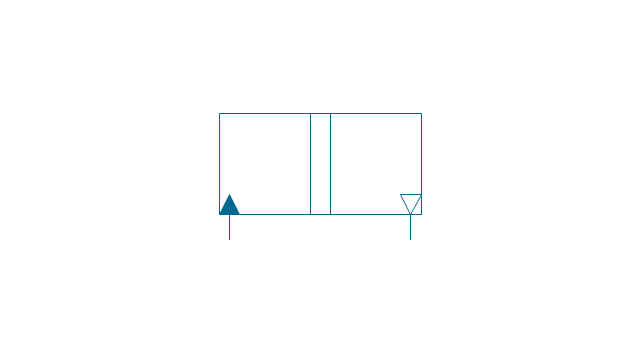
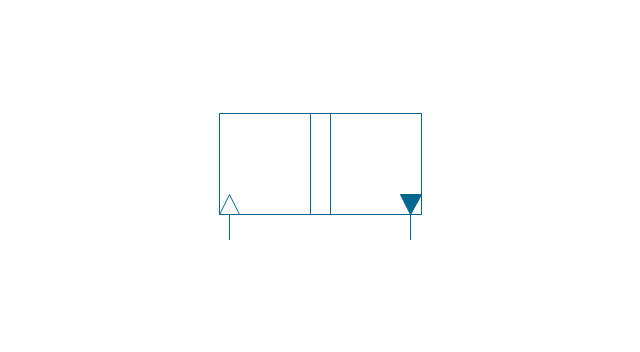
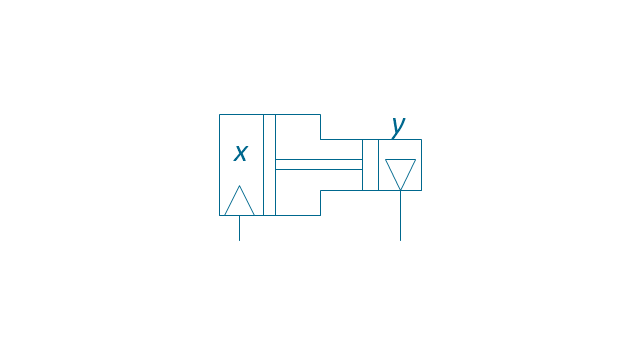
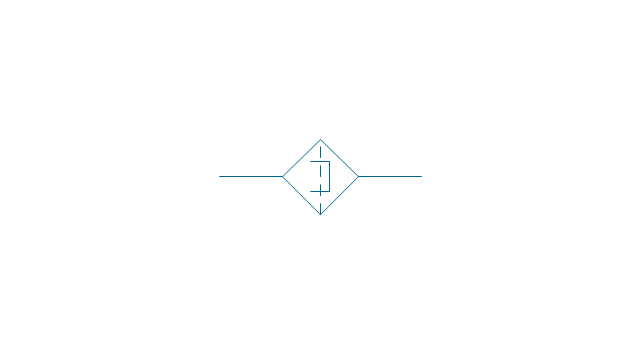
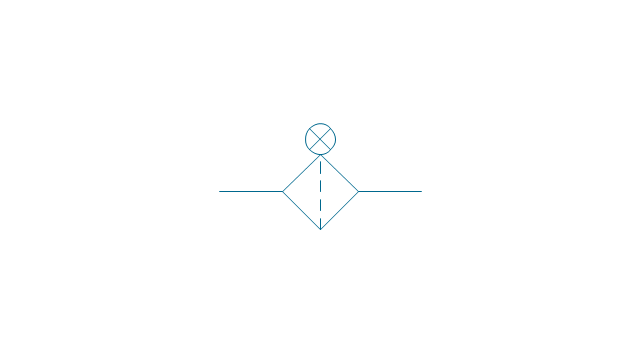
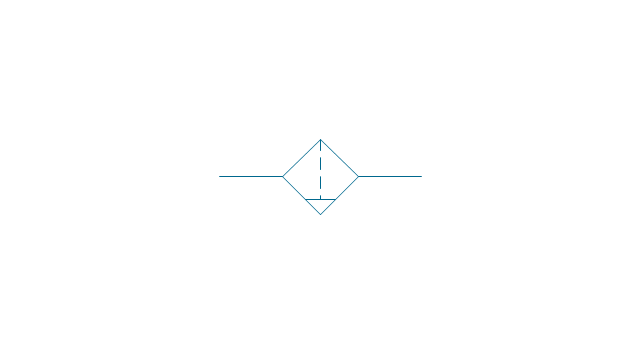
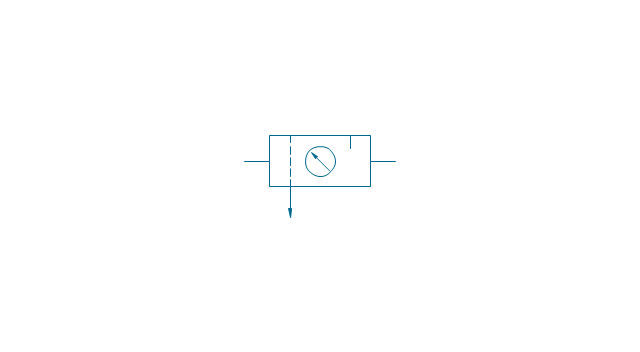
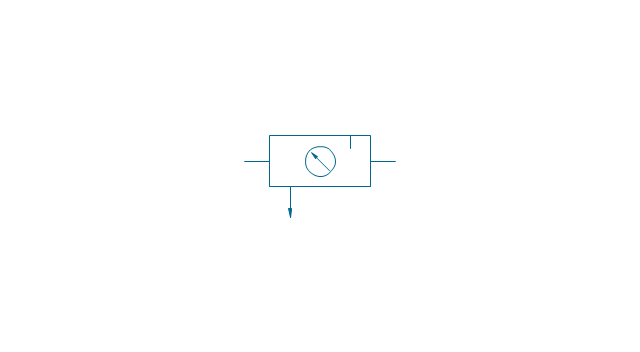
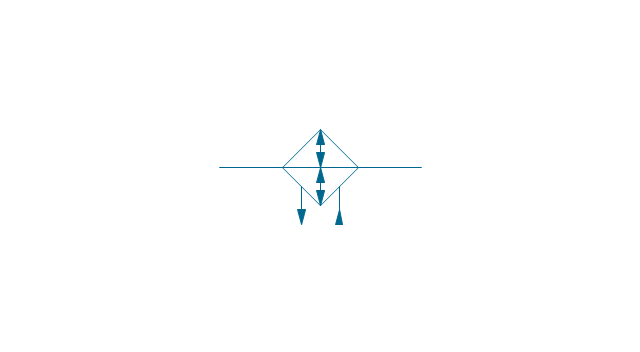
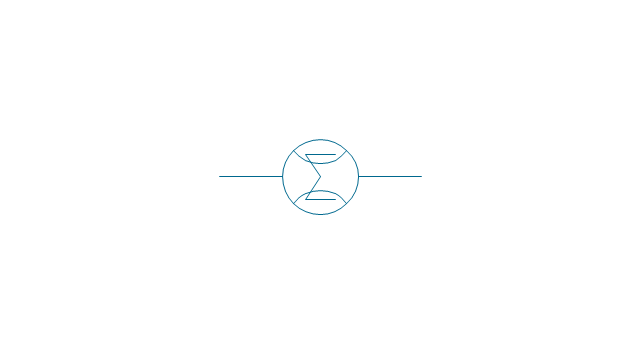
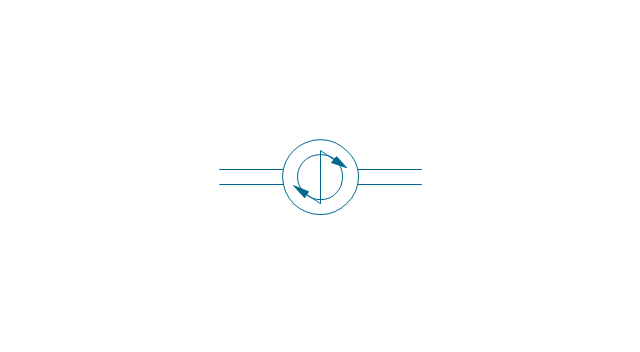
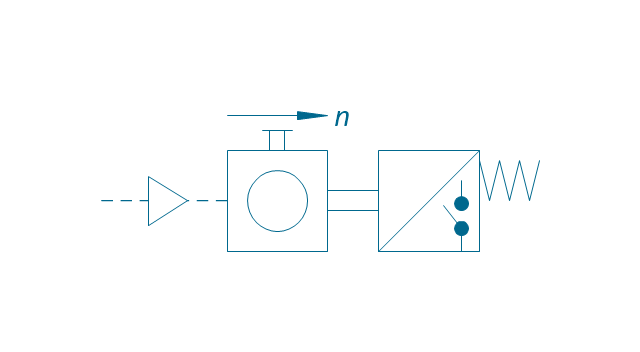
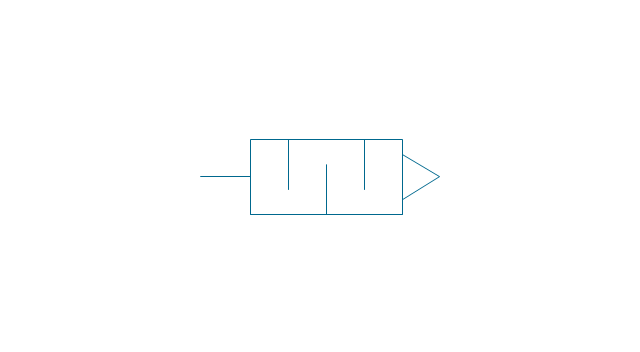
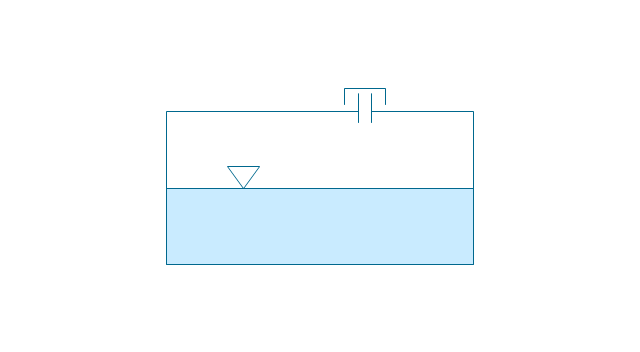
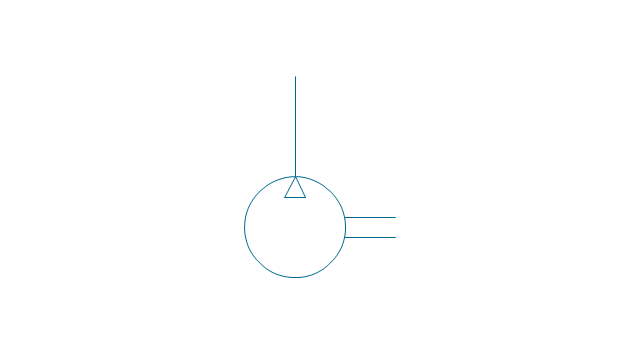
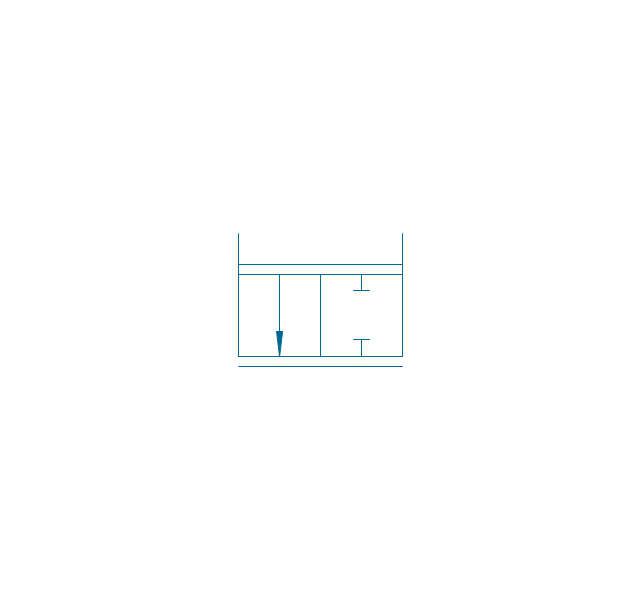
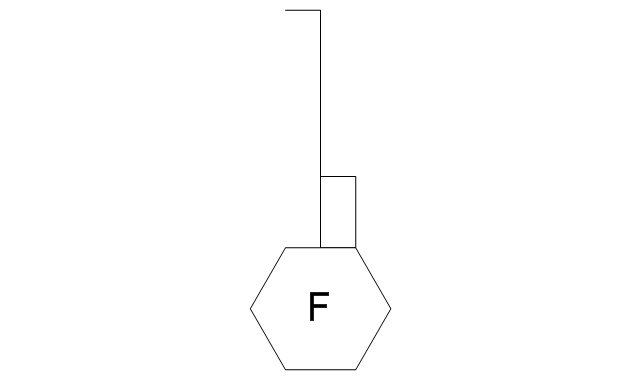
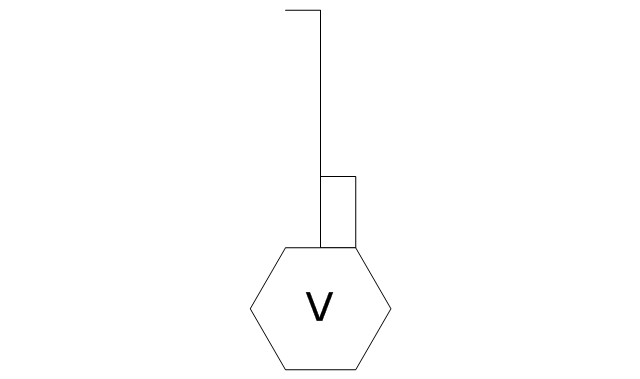
The vector stencils library "Fluid power equipment" contains 113 symbols of hydraulic and pneumatic equipment including pumps, motors, air compressors, cylinders, meters, gauges, and actuators.
Use it to design fluid power and hydraulic control systems in the ConceptDraw PRO diagramming and vector drawing software extended with the Mechanical Engineering solution from the Engineering area of ConceptDraw Solution Park.
www.conceptdraw.com/ solution-park/ engineering-mechanical
Use it to design fluid power and hydraulic control systems in the ConceptDraw PRO diagramming and vector drawing software extended with the Mechanical Engineering solution from the Engineering area of ConceptDraw Solution Park.
www.conceptdraw.com/ solution-park/ engineering-mechanical
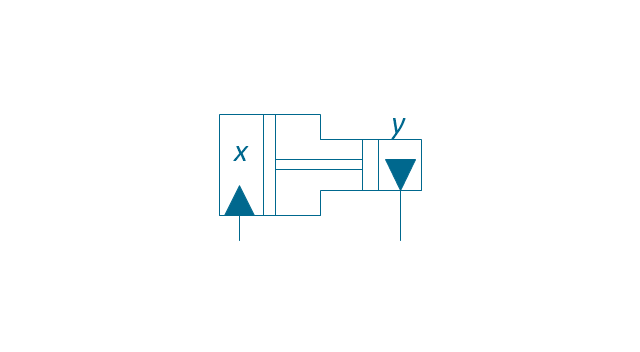
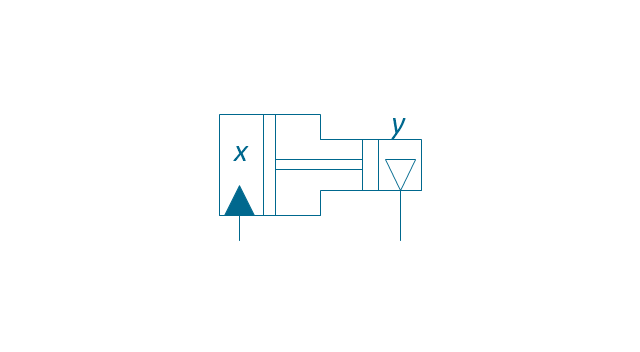
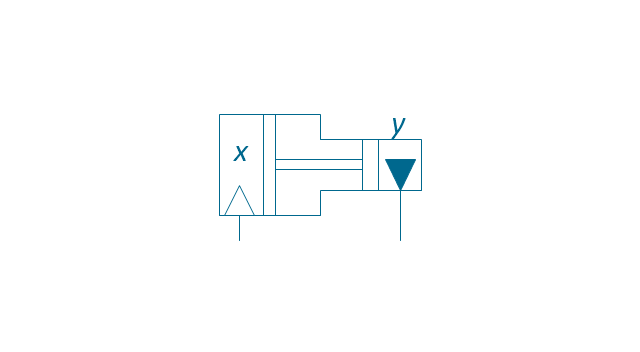
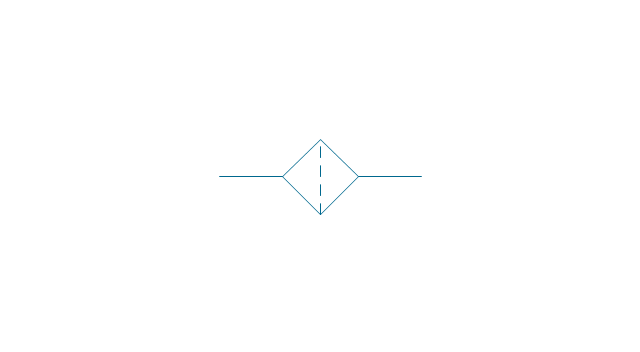
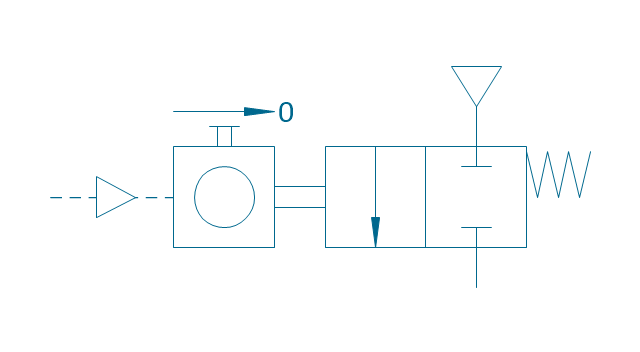
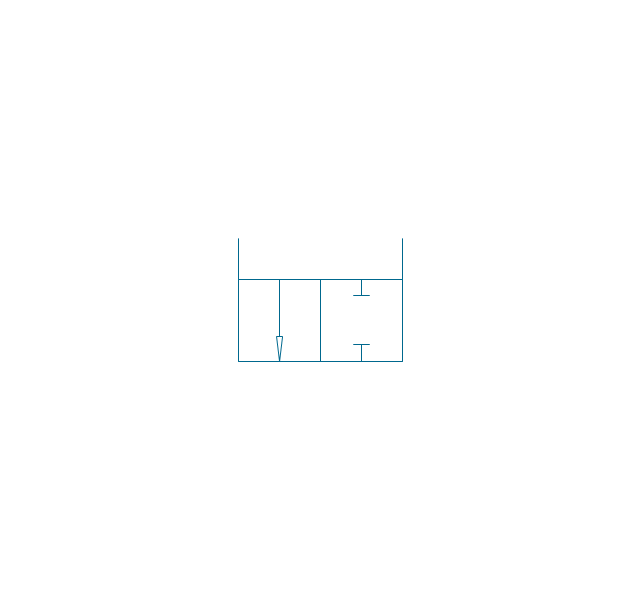
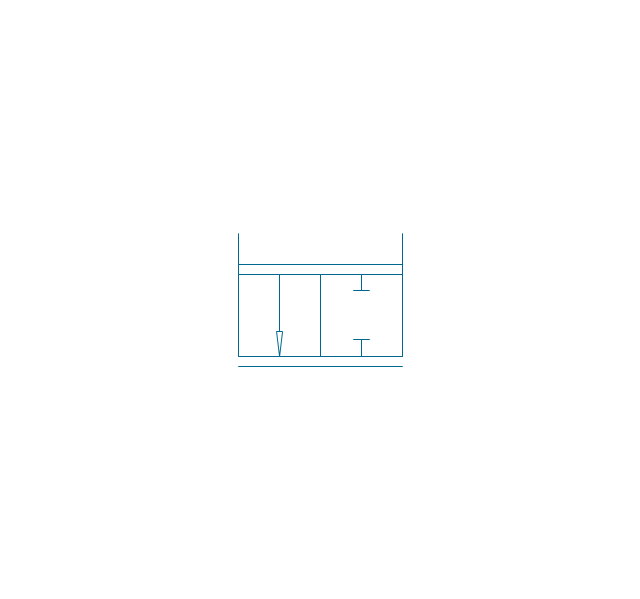
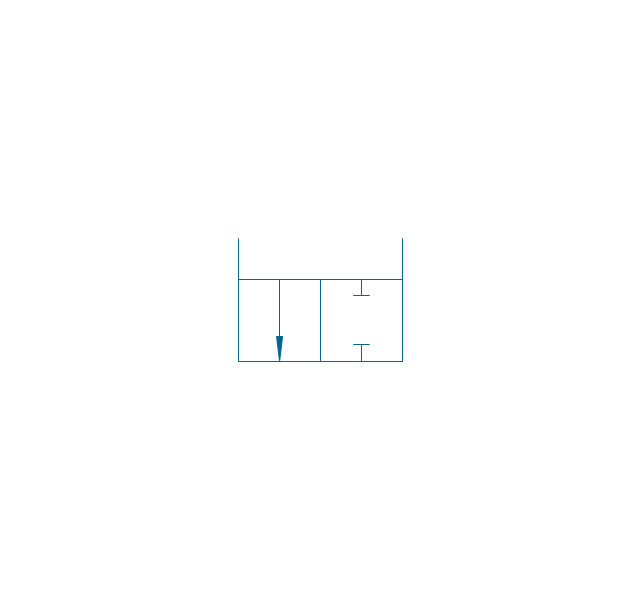
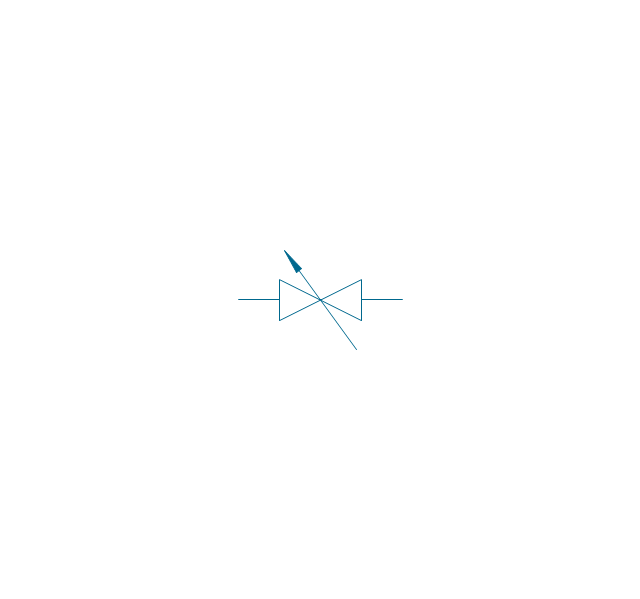
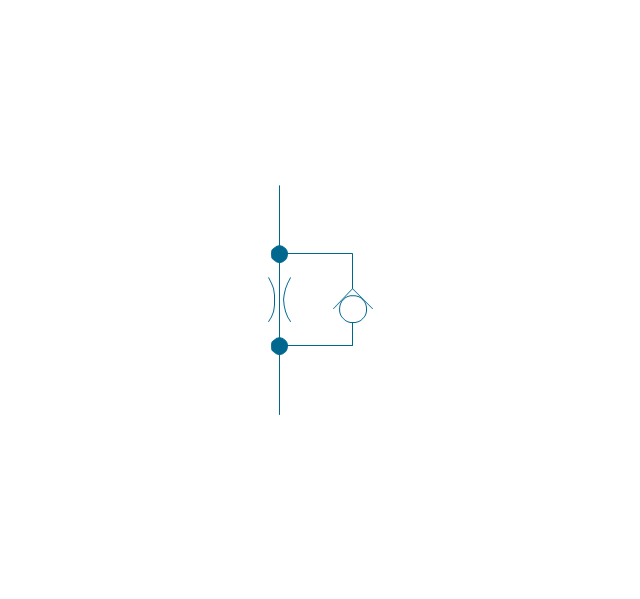
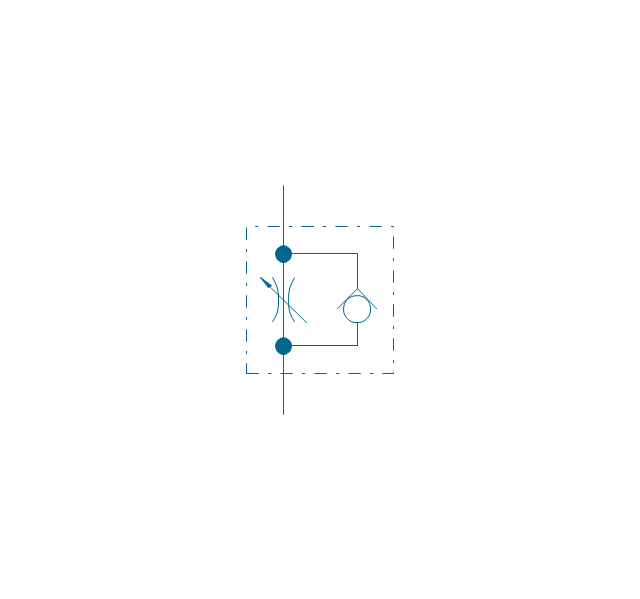
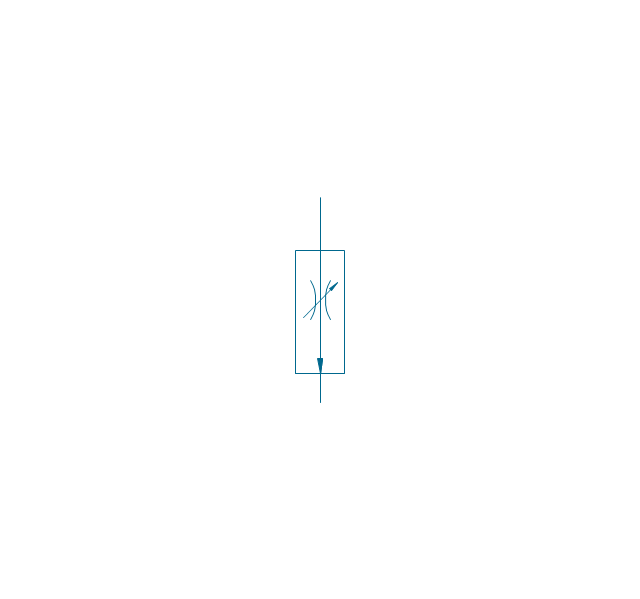
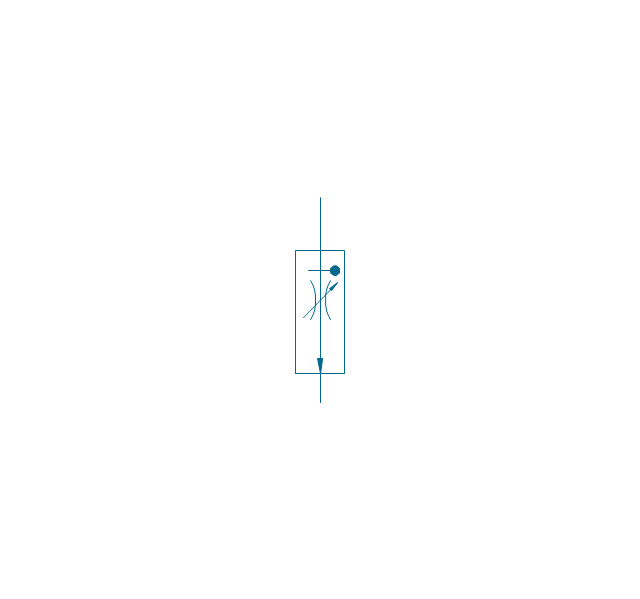
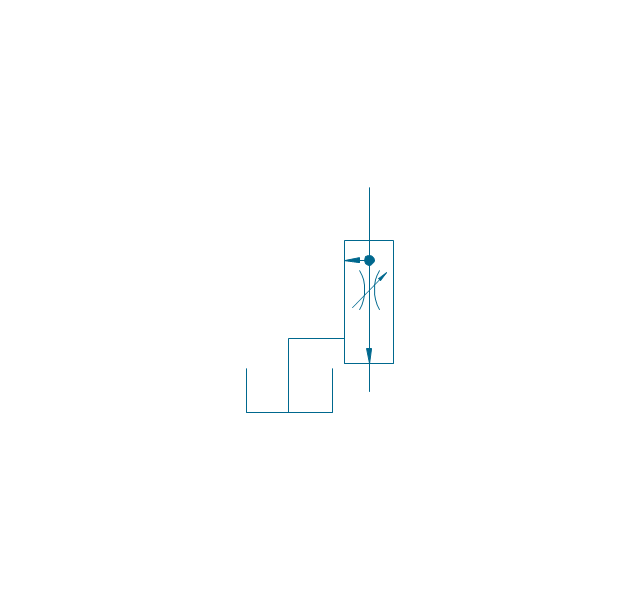
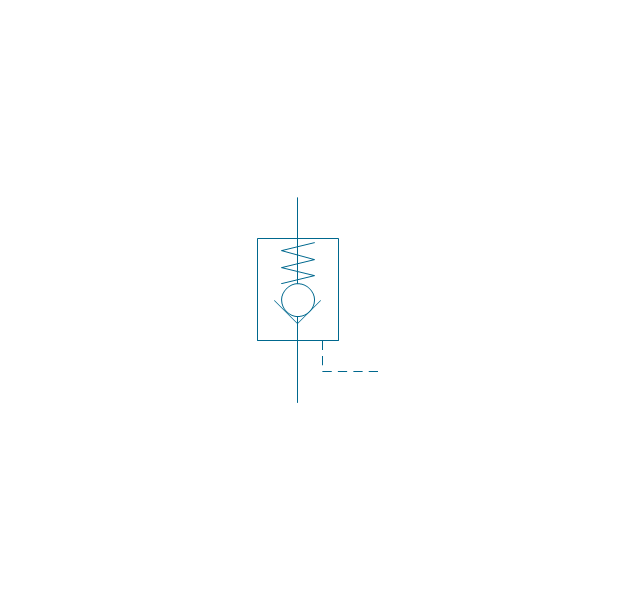
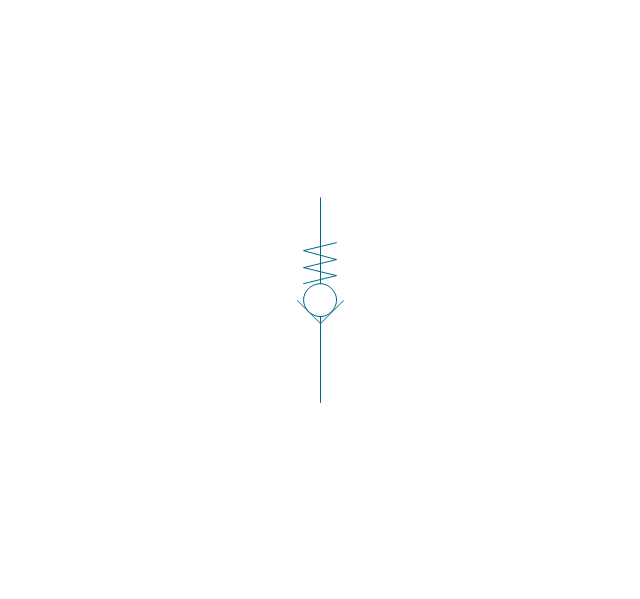
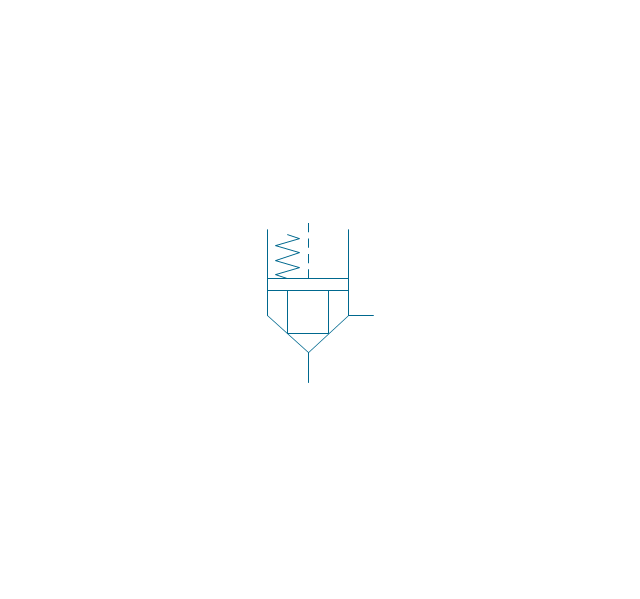
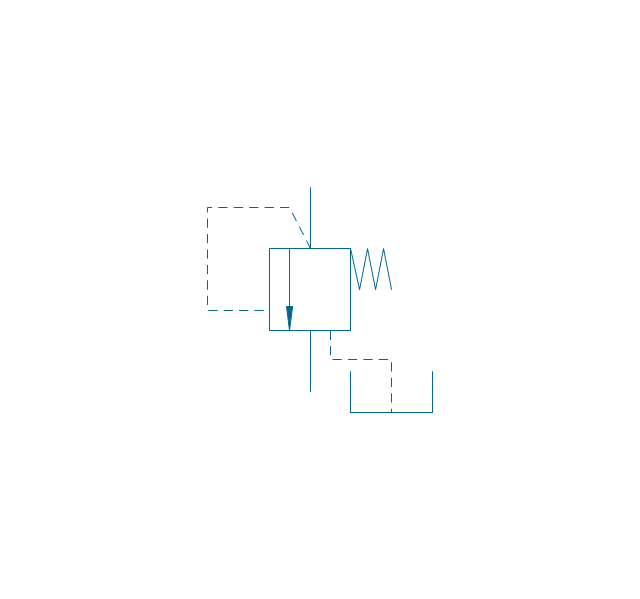
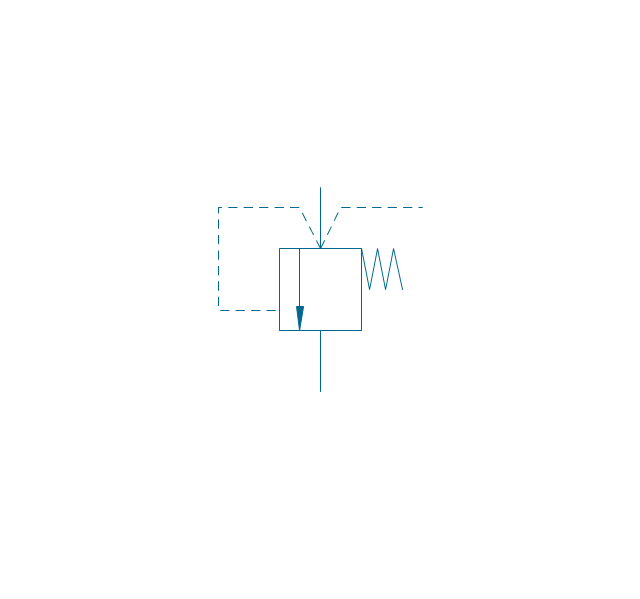
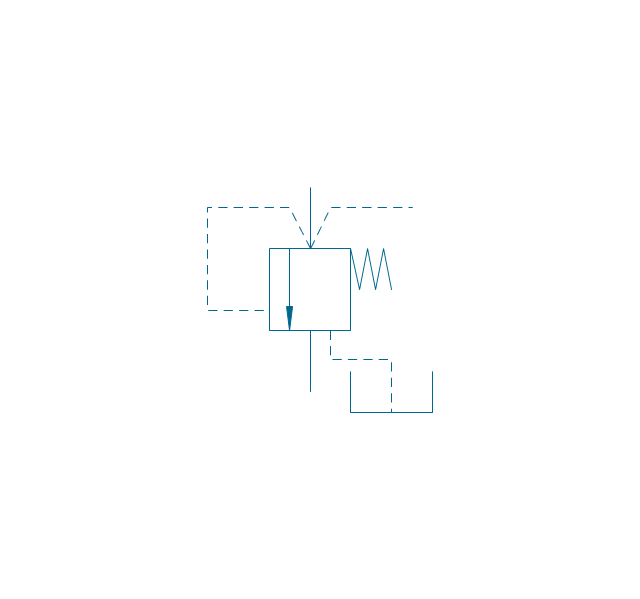
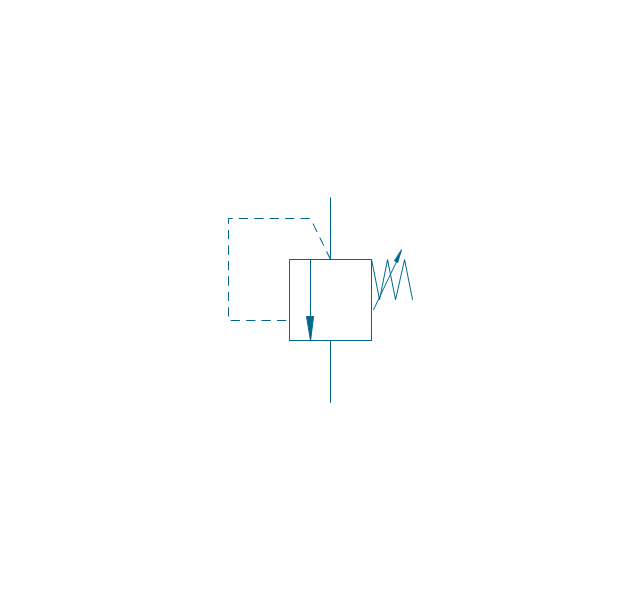
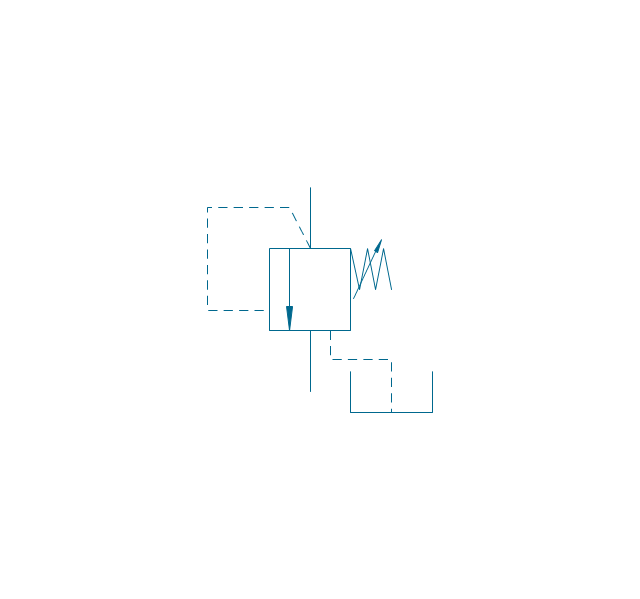
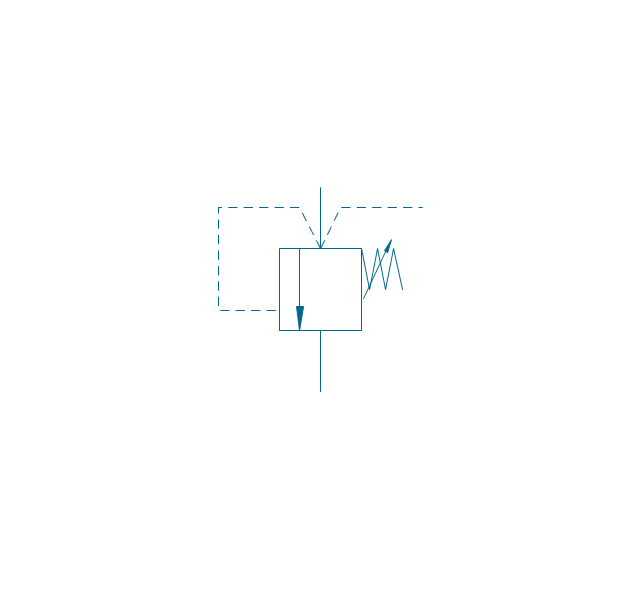
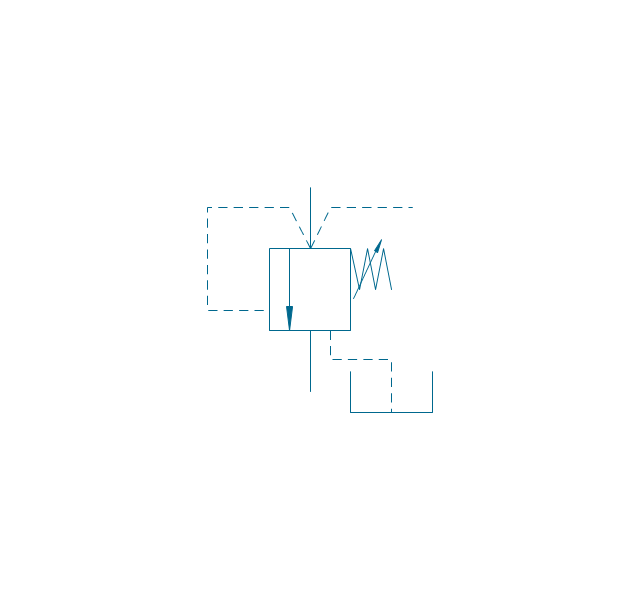
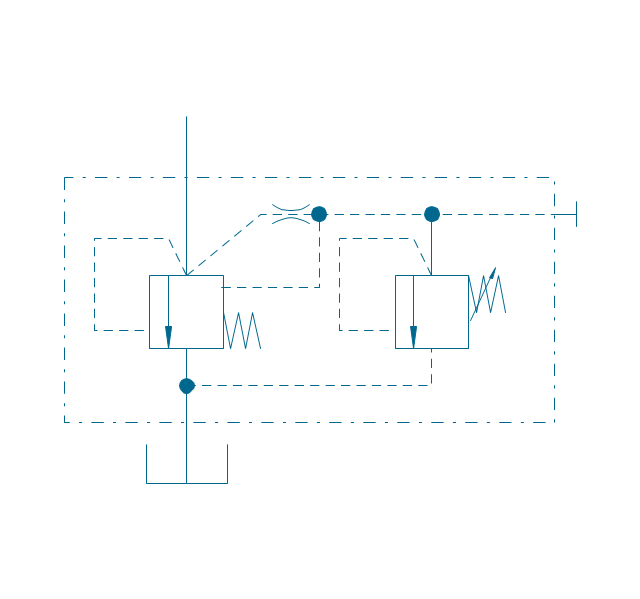
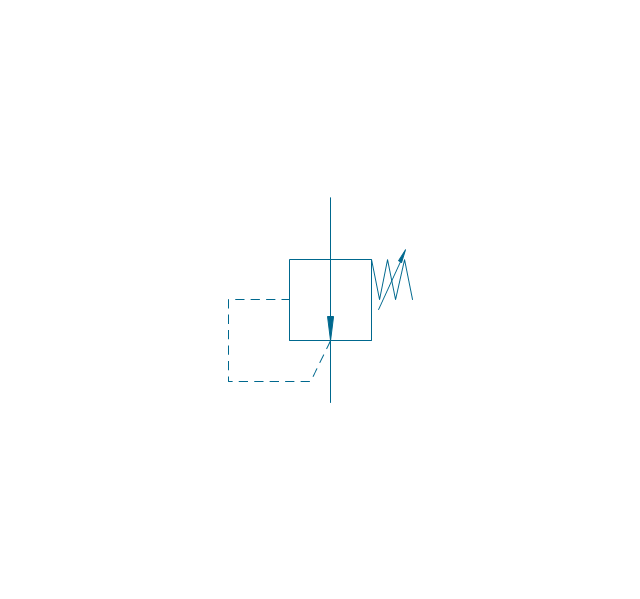
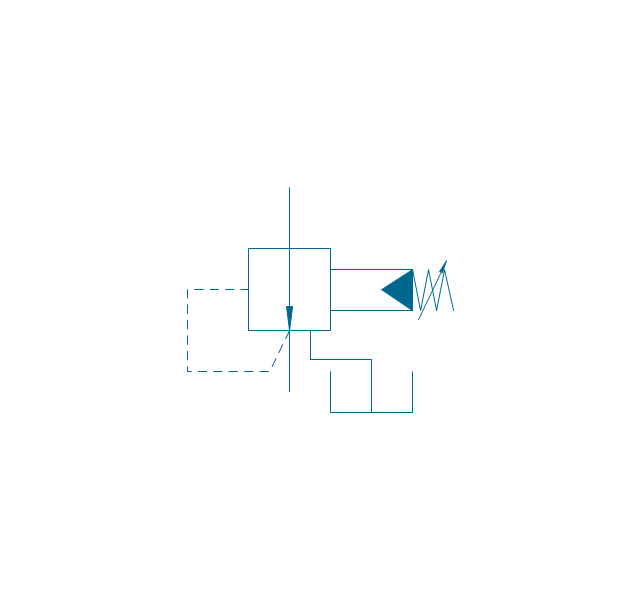
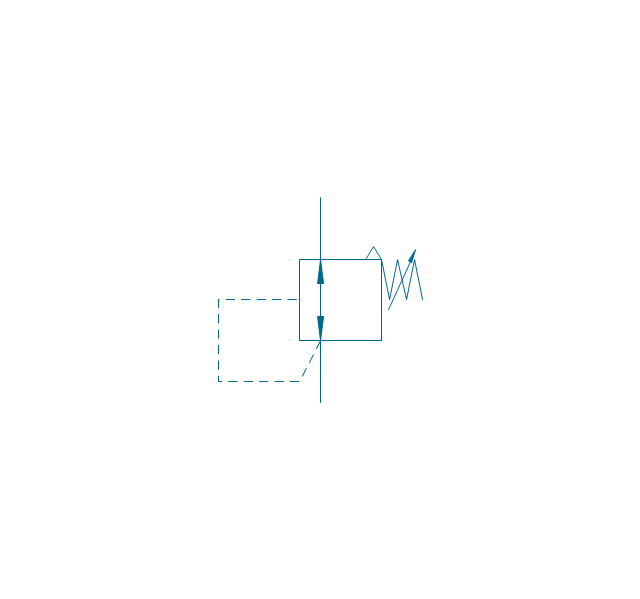
The vector stencils library "Fluid power valves" contains 93 symbols of pre-made hydraulic and pneumatic valves, including directional control valves, flow control valves, pressure control valves, and electrohydraulic and electropneumatic valves.
Use these shapes to design fluid power diagrams in the ConceptDraw PRO diagramming and vector drawing software extended with the Mechanical Engineering solution from the Engineering area of ConceptDraw Solution Park.
www.conceptdraw.com/ solution-park/ engineering-mechanical
Use these shapes to design fluid power diagrams in the ConceptDraw PRO diagramming and vector drawing software extended with the Mechanical Engineering solution from the Engineering area of ConceptDraw Solution Park.
www.conceptdraw.com/ solution-park/ engineering-mechanical
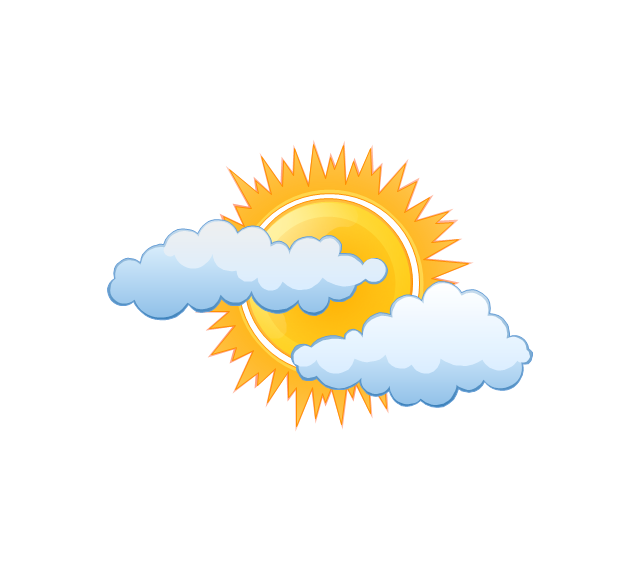
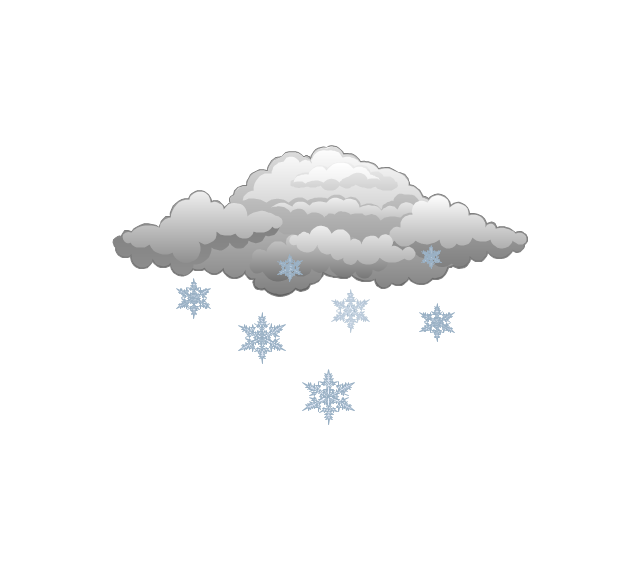
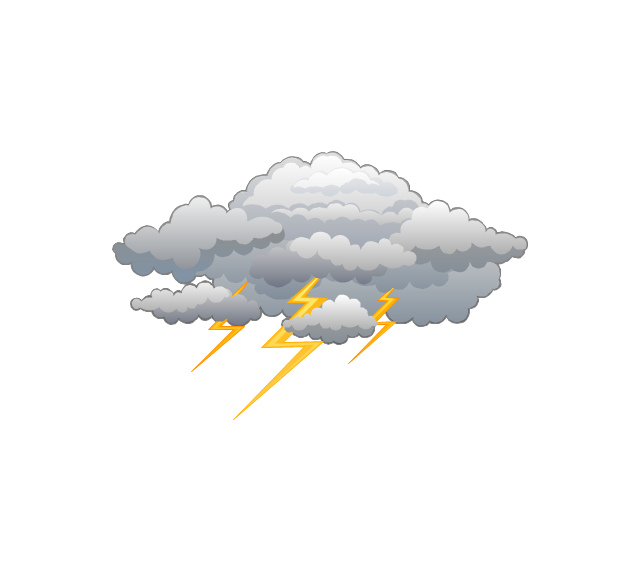
The vector stencils library "Weather" contains 17 weather clipart images for drawing illustrations on climate to show cloudiness, air temperature, precipitation, wind.
"Weather is the state of the atmosphere, to the degree that it is hot or cold, wet or dry, calm or stormy, clear or cloudy. Most weather phenomena occur in the troposphere, just below the stratosphere. Weather generally refers to day-to-day temperature and precipitation activity, whereas climate is the term for the average atmospheric conditions over longer periods of time. When used without qualification, "weather", is generally understood to mean the weather of Earth.
Weather is driven by air pressure (temperature and moisture) differences between one place and another. These pressure and temperature differences can occur due to the sun angle at any particular spot, which varies by latitude from the tropics. The strong temperature contrast between polar and tropical air gives rise to the jet stream. Weather systems in the mid-latitudes, such as extratropical cyclones, are caused by instabilities of the jet stream flow. Because the Earth's axis is tilted relative to its orbital plane, sunlight is incident at different angles at different times of the year. On Earth's surface, temperatures usually range ±40°C (−40°F to 100°F) annually. Over thousands of years, changes in Earth's orbit affect the amount and distribution of solar energy received by the Earth and influence long-term climate and global climate change." [Weather. Wikipedia]
The clip art example "Weather - Vector stencils library" was created using the ConceptDraw PRO diagramming and vector drawing software extended with the Nature solution from the Illustration area of ConceptDraw Solution Park.
www.conceptdraw.com/ solution-park/ illustrations-nature
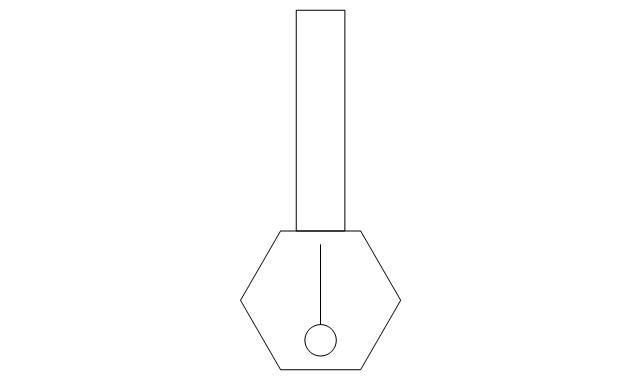
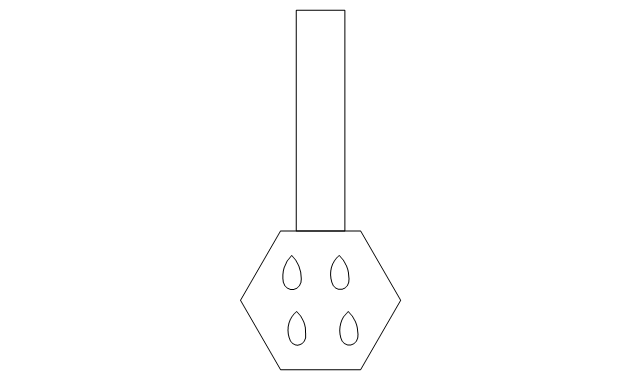
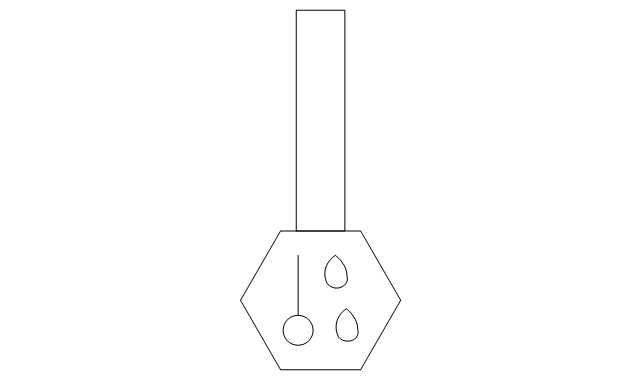
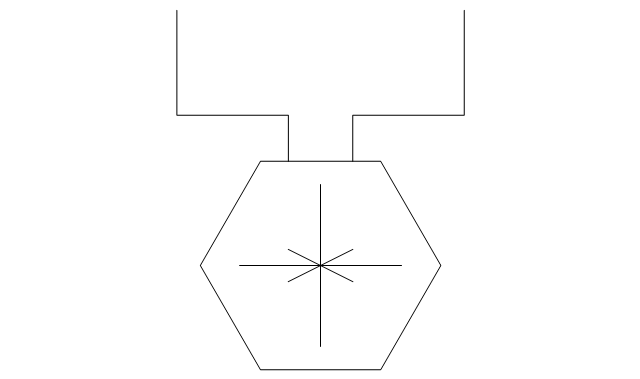
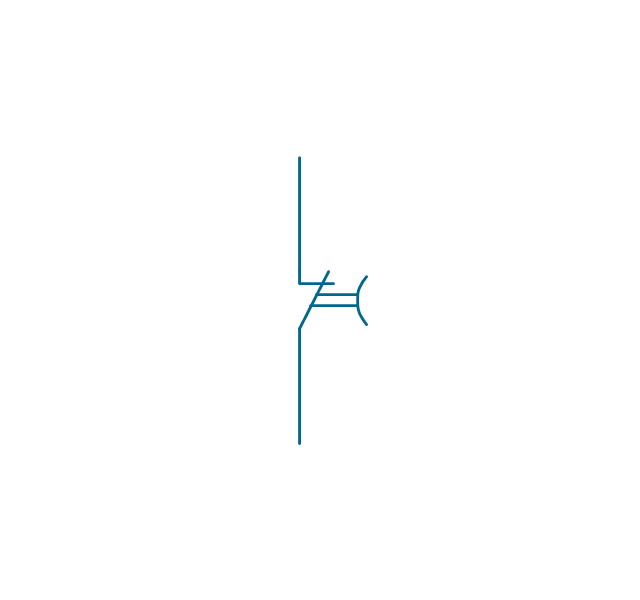
The vector stencils library "Thermo" contains 14 symbols of thermoelectric elements.
Use these shapes for drawing electrical layouts, electronic schematics, and circuit diagrams in the ConceptDraw PRO diagramming and vector drawing software extended with the Electrical Engineering solution from the Engineering area of ConceptDraw Solution Park.
www.conceptdraw.com/ solution-park/ engineering-electrical
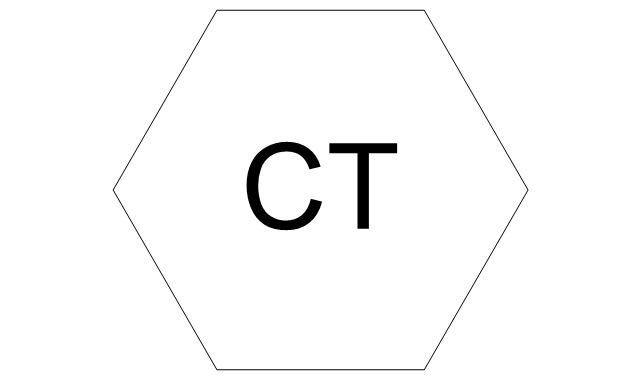
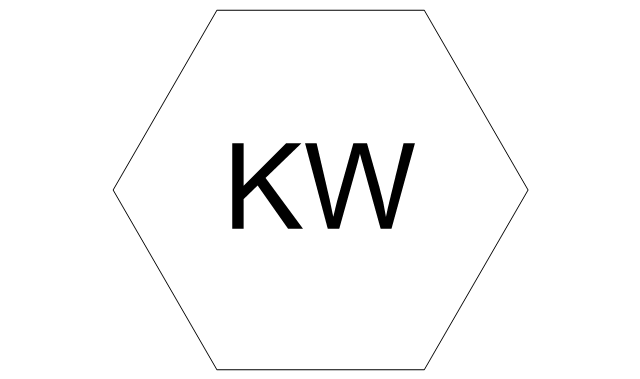
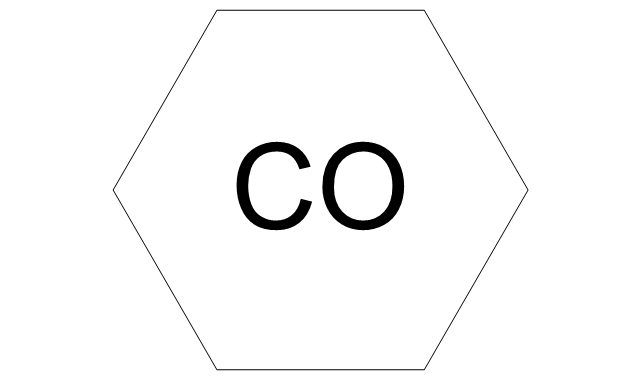
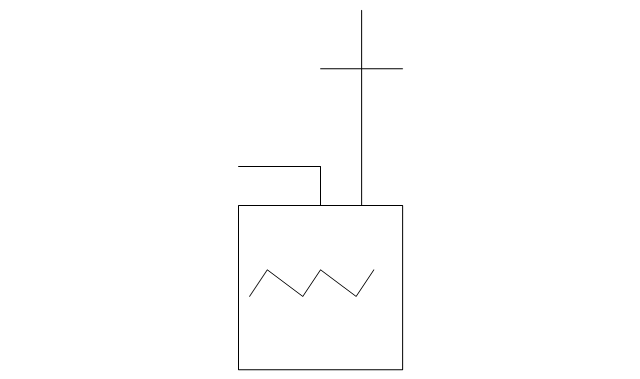
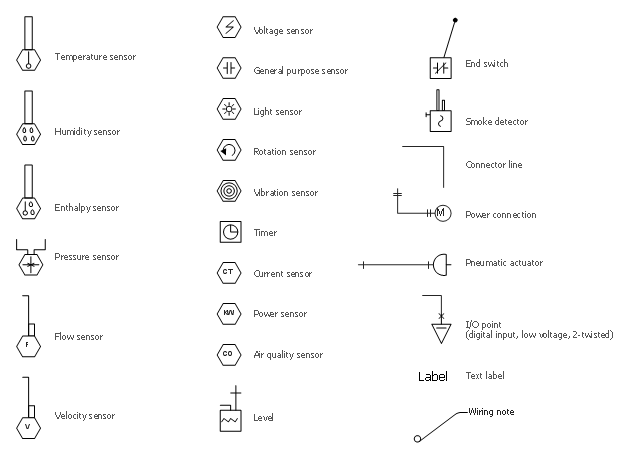
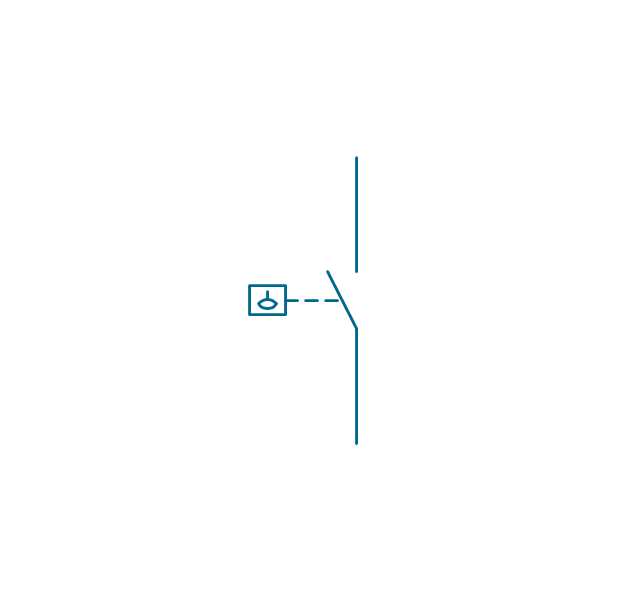
The vector stencils library "HVAC controls" contains 23 symbols of HVAC controls (sensors, actuators, timers, controllers, I/ O points). Use it for drawing HVAC system diagrams, controls drawings, and automated building control and environmental control systems design.
The example "HVAC controls - Vector stencils library" was created using the ConceptDraw PRO diagramming and vector drawing software extended with the HVAC Plans solution from the Building Plans area of ConceptDraw Solution Park.
The example "HVAC controls - Vector stencils library" was created using the ConceptDraw PRO diagramming and vector drawing software extended with the HVAC Plans solution from the Building Plans area of ConceptDraw Solution Park.
"A thermostat is a component of a control system which senses the temperature of a system so that the system's temperature is maintained near a desired setpoint. The thermostat does this by switching heating or cooling devices on or off, or regulating the flow of a heat transfer fluid as needed, to maintain the correct temperature. The name is derived from the Greek words thermos "hot" and statos "a standing".
A thermostat may be a control unit for a heating or cooling system or a component part of a heater or air conditioner. Thermostats can be constructed in many ways and may use a variety of sensors to measure the temperature. The output of the sensor then controls the heating or cooling apparatus. A thermostat may switch on and off at temperatures either side of the setpoint the extent of the difference is known as hysteresis and prevents too frequent switching of the controlled equipment." [Thermostat. Wikipedia]
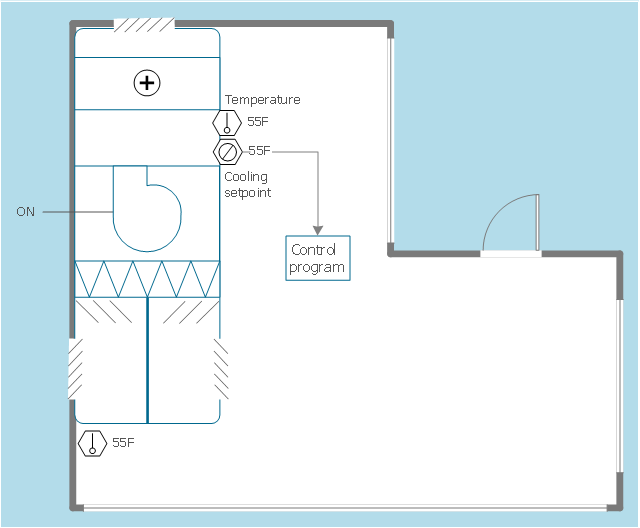
The HVAC plan example "Digital unit ventilator control" was created using the ConceptDraw PRO diagramming and vector drawing software extended with the HVAC Plans solution from the Building Plans area of ConceptDraw Solution Park.
The vector stencils library "HVAC controls" contains 23 symbols of HVAC controls (sensors, actuators, timers, controllers, I/ O points). Use it for drawing HVAC system diagrams, controls drawings, and automated building control and environmental control systems design.
The example "HVAC controls - Vector stencils library" was created using the ConceptDraw PRO diagramming and vector drawing software extended with the HVAC Plans solution from the Building Plans area of ConceptDraw Solution Park.
The example "HVAC controls - Vector stencils library" was created using the ConceptDraw PRO diagramming and vector drawing software extended with the HVAC Plans solution from the Building Plans area of ConceptDraw Solution Park.
The vector stencils library "HVAC controls" contains 23 symbols of HVAC controls (sensors, actuators, timers, controllers, I/ O points).
"HVAC (... Heating, Ventilation and Air Conditioning) is a control system that applies regulation to a heating and/ or air conditioning system. ...
Central controllers and most terminal unit controllers are programmable, meaning the direct digital control program code may be customized for the intended use. The program features include time schedules, setpoints, controllers, logic, timers, trend logs, and alarms. The unit controllers typically have analog and digital inputs that allow measurement of the variable (temperature, humidity, or pressure) and analog and digital outputs for control of the transport medium (hot/ cold water and/ or steam). Digital inputs are typically (dry) contacts from a control device, and analog inputs are typically a voltage or current measurement from a variable (temperature, humidity, velocity, or pressure) sensing device. Digital outputs are typically relay contacts used to start and stop equipment, and analog outputs are typically voltage or current signals to control the movement of the medium (air/ water/ steam) control devices such as valves, dampers, and motors." [HVAC control system. Wikipedia]
Use the design elements library "HVAC controls" for drawing the HVAC system diagrams, controls drawings, and automated building control and environmental control system layuout floor plans using the ConceptDraw PRO diagramming and vector drawing software.
The shapes example "Design elements - HVAC controls" was created using the ConceptDraw PRO diagramming and vector drawing software extended with the HVAC Plans solution from the Building Plans area of ConceptDraw Solution Park.
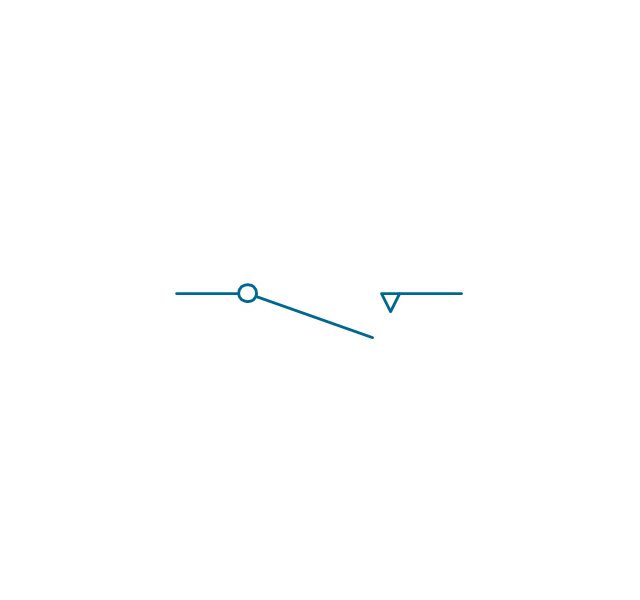
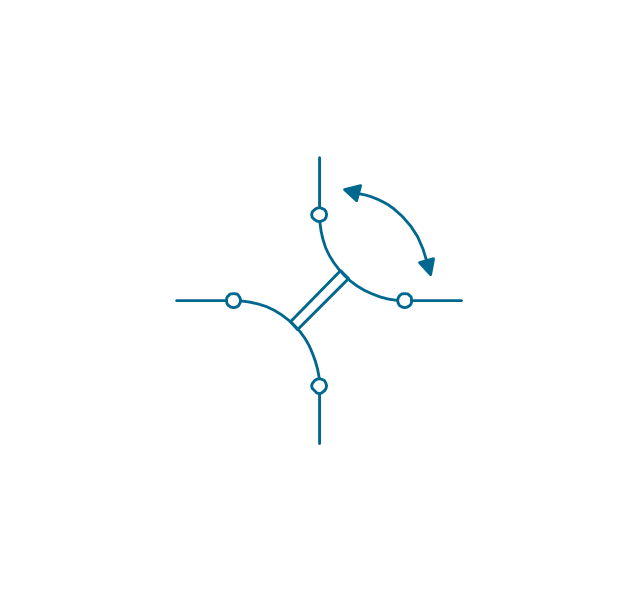
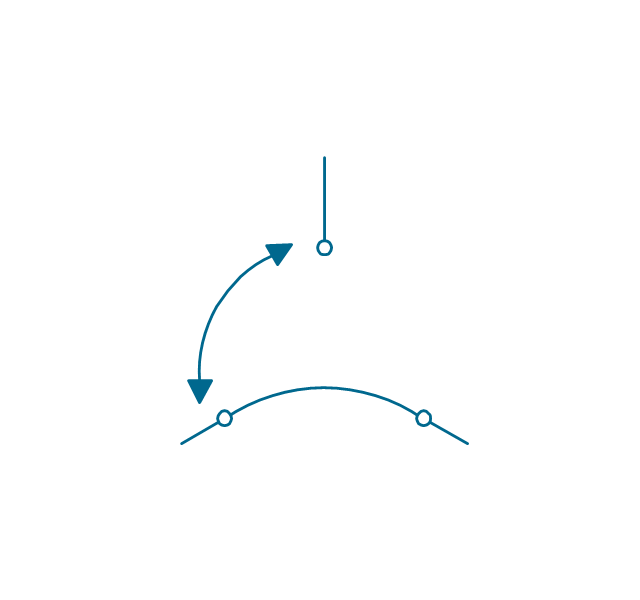
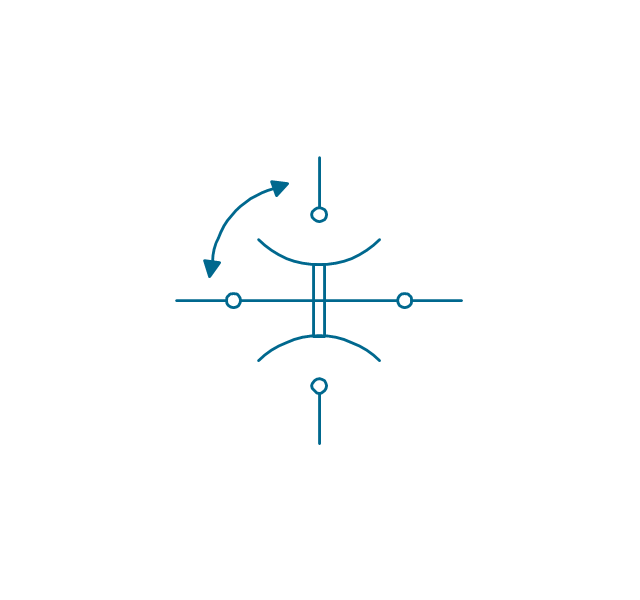
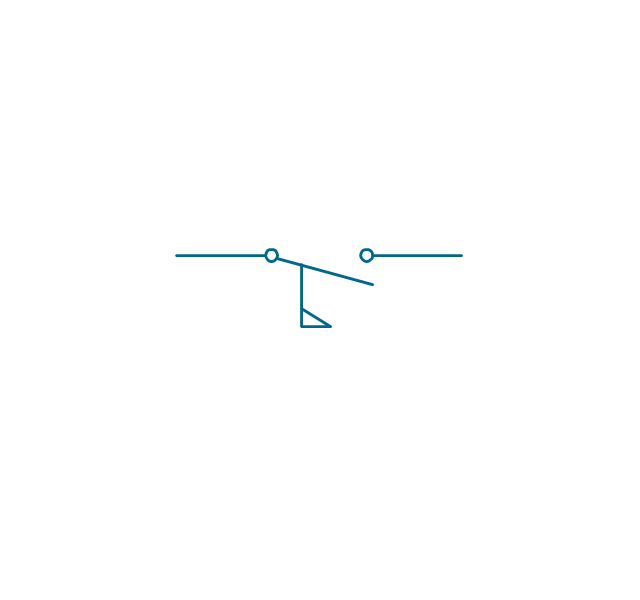
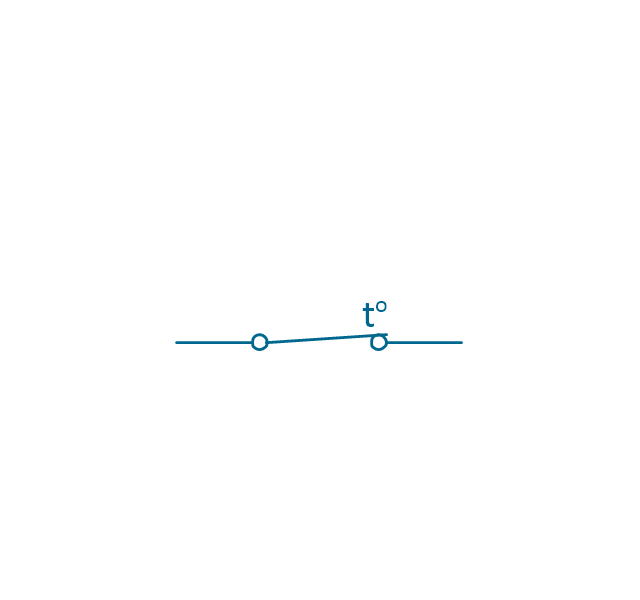
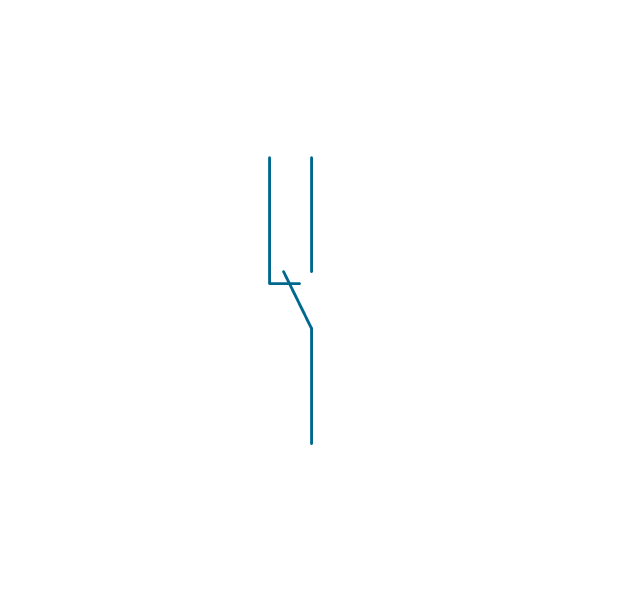
The vector stencils library "Switches and relays" contains 58 symbols of electrical contacts, switches, relays, circuit breakers, selectors, connectors, disconnect devices, switching circuits, current regulators, and thermostats for electrical devices.
Use these shapes for drawing electrical diagrams in the ConceptDraw PRO diagramming and vector drawing software extended with the Electrical Engineering solution from the Engineering area of ConceptDraw Solution Park.
www.conceptdraw.com/ solution-park/ engineering-electrical
Use these shapes for drawing electrical diagrams in the ConceptDraw PRO diagramming and vector drawing software extended with the Electrical Engineering solution from the Engineering area of ConceptDraw Solution Park.
www.conceptdraw.com/ solution-park/ engineering-electrical
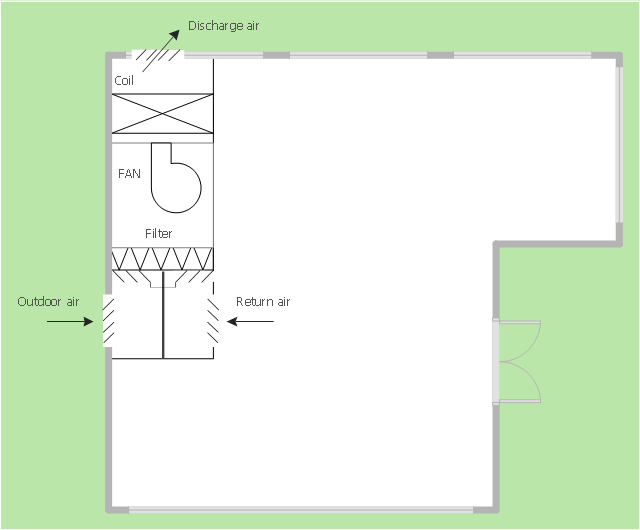
"Ventilating (the V in HVAC) is the process of "changing" or replacing air in any space to provide high indoor air quality (i.e. to control temperature, replenish oxygen, or remove moisture, odors, smoke, heat, dust, airborne bacteria, and carbon dioxide). Ventilation is used to remove unpleasant smells and excessive moisture, introduce outside air, to keep interior building air circulating, and to prevent stagnation of the interior air.
Ventilation includes both the exchange of air to the outside as well as circulation of air within the building. It is one of the most important factors for maintaining acceptable indoor air quality in buildings. Methods for ventilating a building may be divided into mechanical/ forced and natural types.
"Mechanical" or "forced" ventilation is used to control indoor air quality. Excess humidity, odors, and contaminants can often be controlled via dilution or replacement with outside air. However, in humid climates much energy is required to remove excess moisture from ventilation air.
Ventilation increases the energy needed for heating or cooling, however heat recovery ventilation can be used to mitigate the energy consumption. This involves heat exchange between incoming and outgoing air. Energy recovery ventilation additionally includes exchange of humidity." [Ventilation (architecture). Wikipedia]
The HVAC plan example "Blow-through unit ventilator" was created using the ConceptDraw PRO diagramming and vector drawing software extended with the HVAC Plans solution from the Building Plans area of ConceptDraw Solution Park.
The vector stencils library "Fluid power equipment" contains 113 symbols of hydraulic and pneumatic equipment including pumps, motors, air compressors, cylinders, meters, gauges, and actuators.
Use it to design fluid power and hydraulic control systems in the ConceptDraw PRO diagramming and vector drawing software extended with the Mechanical Engineering solution from the Engineering area of ConceptDraw Solution Park.
www.conceptdraw.com/ solution-park/ engineering-mechanical
Use it to design fluid power and hydraulic control systems in the ConceptDraw PRO diagramming and vector drawing software extended with the Mechanical Engineering solution from the Engineering area of ConceptDraw Solution Park.
www.conceptdraw.com/ solution-park/ engineering-mechanical
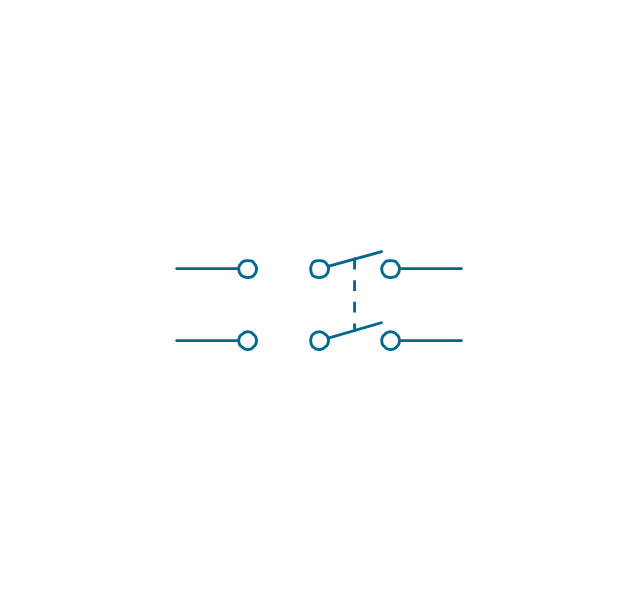
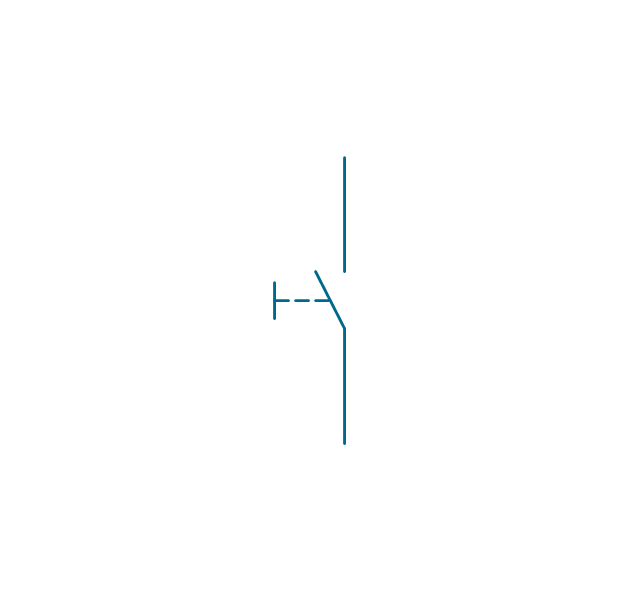
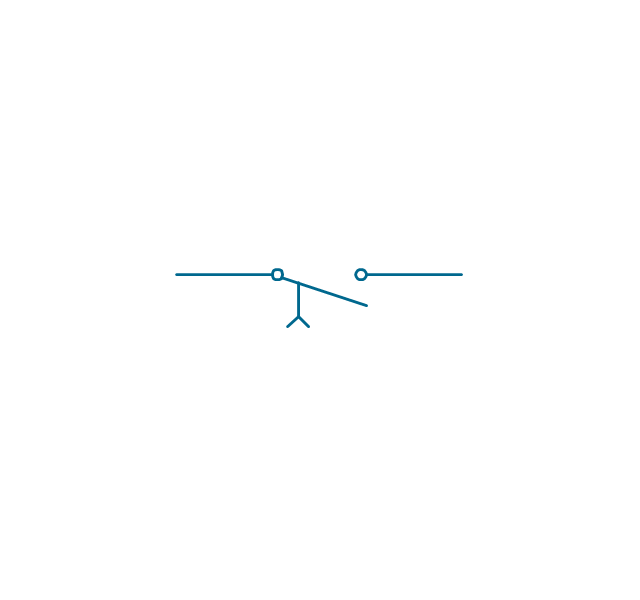
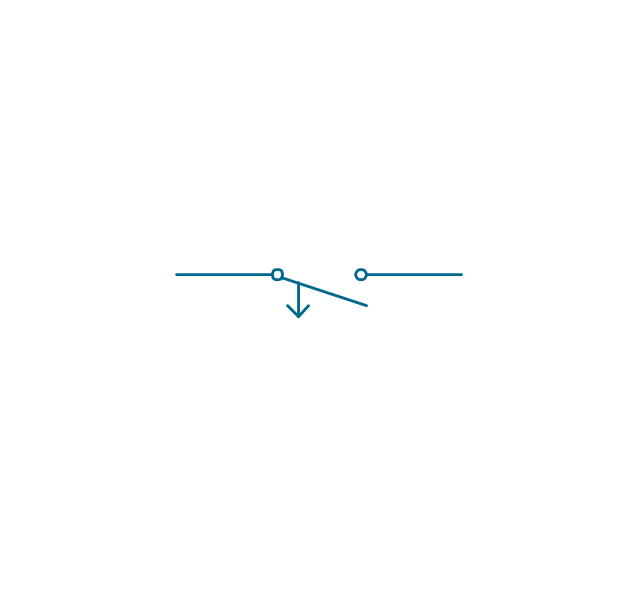
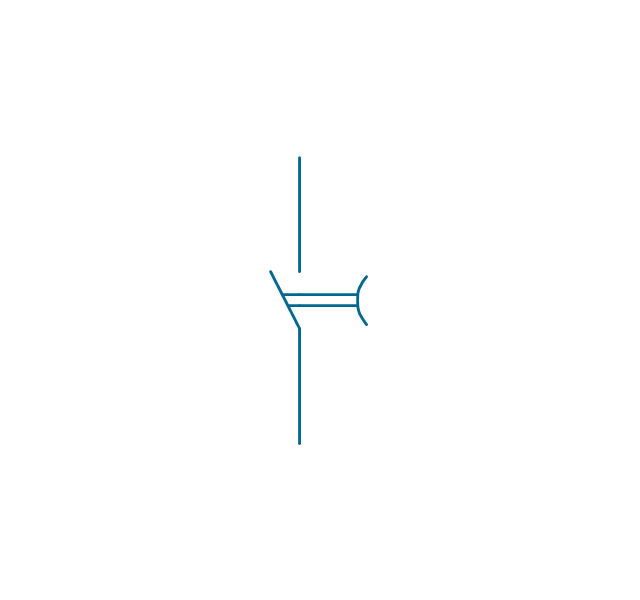
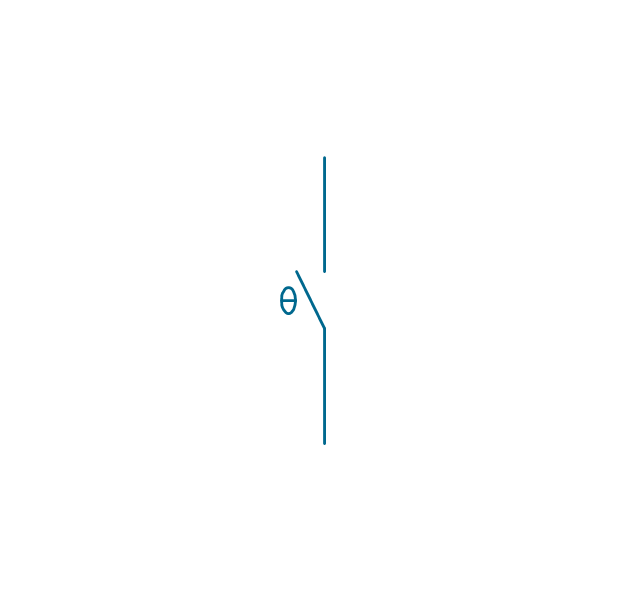
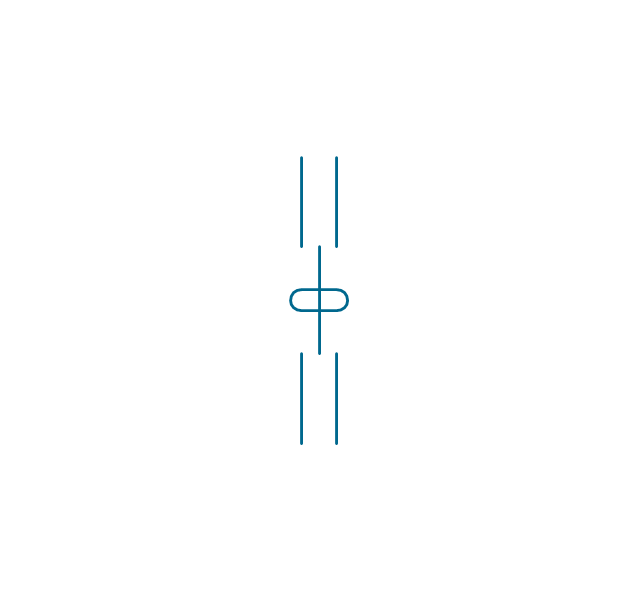
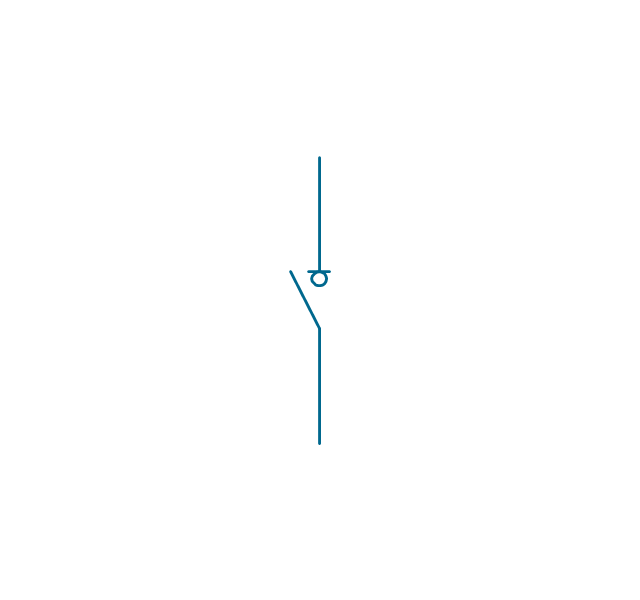
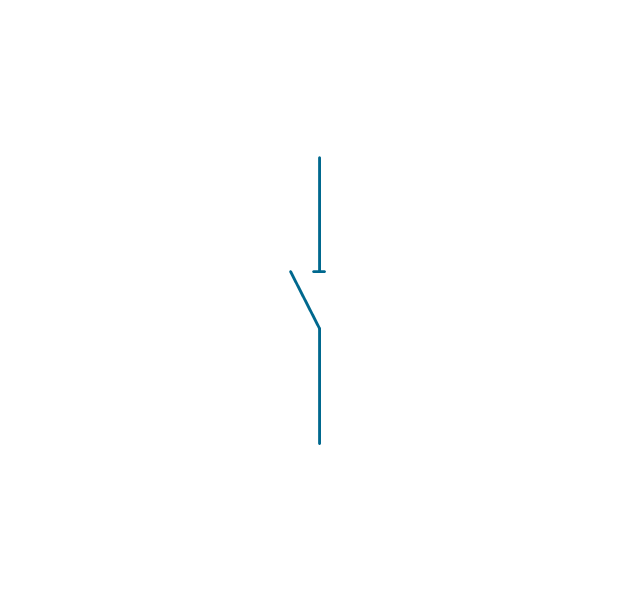
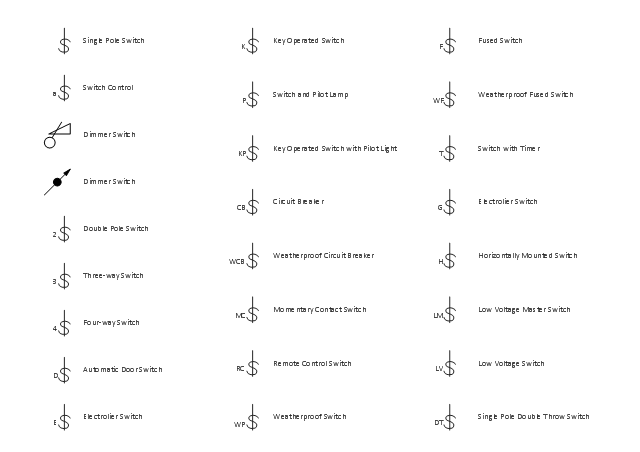
The vector stencils library "Switches" contains 25 symbols of electrical and light switches and breakers.
"In electrical engineering, a switch is an electrical component that can break an electrical circuit, interrupting the current or diverting it from one conductor to another.
The most familiar form of switch is a manually operated electromechanical device with one or more sets of electrical contacts, which are connected to external circuits.
A switch may be directly manipulated by a human as a control signal to a system, ... or to control power flow in a circuit, such as a light switch. Automatically operated switches can be used to control the motions of machines, for example, to indicate that a garage door has reached its full open position or that a machine tool is in a position to accept another workpiece. Switches may be operated by process variables such as pressure, temperature, flow, current, voltage, and force, acting as sensors in a process and used to automatically control a system. For example, a thermostat is a temperature-operated switch used to control a heating process. A switch that is operated by another electrical circuit is called a relay." [Switch. Wikipedia]
Use the design elements library "Switches" for drawing light switches layouts, electrical and telecommunication equipment floor plans for building design and construction using the ConceptDraw PRO diagramming and vector drawing software.
The shapes library "Switches" is included in the Electric and Telecom Plans solution from the Building Plans area of ConceptDraw Solution Park.
www.conceptdraw.com/ solution-park/ building-electric-telecom-plans
"The atmosphere of Earth is a layer of gases surrounding the planet Earth that is retained by Earth's gravity. The atmosphere protects life on Earth by absorbing ultraviolet solar radiation, warming the surface through heat retention (greenhouse effect), and reducing temperature extremes between day and night (the diurnal temperature variation).
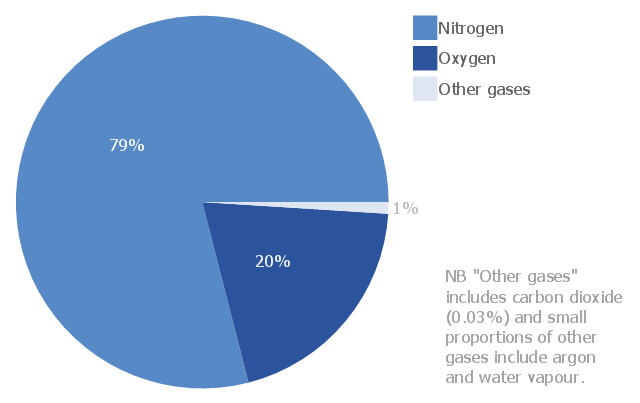
The common name given to the atmospheric gases used in breathing and photosynthesis is air. By volume, dry air contains 78.09% nitrogen, 20.95% oxygen, 0.93% argon, 0.039% carbon dioxide, and small amounts of other gases. Air also contains a variable amount of water vapor, on average around 1%. Although air content and atmospheric pressure vary at different layers, air suitable for the survival of terrestrial plants and terrestrial animals currently is only known to be found in Earth's troposphere and artificial atmospheres." [Atmosphere of Earth. Wikipedia]
This pie chart sample was redesigned from the Wikimedia Commons file: Air composition pie chart.JPG.
[commons.wikimedia.org/ wiki/ File:Air_ composition_ pie_ chart.JPG]
This file is licensed under the Creative Commons Attribution-Share Alike 3.0 Unported license. [creativecommons.org/ licenses/ by-sa/ 3.0/ deed.en]
The pie chart example "Approximate composition of the air" was created using the ConceptDraw PRO diagramming and vector drawing software extended with the Pie Charts solution of the Graphs and Charts area in ConceptDraw Solution Park.
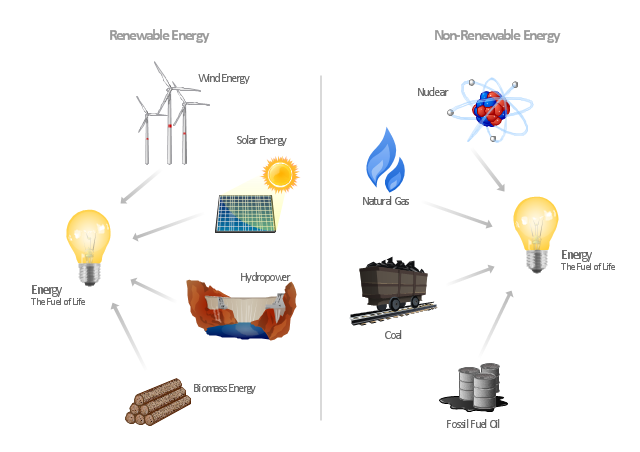
"Consumption of energy resources, (e.g. turning on a light) requires resources and has an effect on the environment. Many electric power plants burn coal, oil or natural gas in order to generate electricity for energy needs. While burning these fossil fuels produces a readily available and instantaneous supply of electricity, it also generates air pollutants including carbon dioxide (CO2), sulfur dioxide and trioxide (SOx) and nitrogen oxides (NOx). Carbon dioxide is an important greenhouse gas which is thought to be responsible for some fraction of the rapid increase in global warming seen especially in the temperature records in the 20th century, as compared with tens of thousands of years worth of temperature records which can be read from ice cores taken in Arctic regions. Burning fossil fuels for electricity generation also releases trace metals such as beryllium, cadmium, chromium, copper, manganese, mercury, nickel, and silver into the environment, which also act as pollutants.
The large-scale use of renewable energy technologies would "greatly mitigate or eliminate a wide range of environmental and human health impacts of energy use". Renewable energy technologies include biofuels, solar heating and cooling, hydroelectric power, solar power, and wind power. Energy conservation and the efficient use of energy would also help." [Energy industry. Environmental impact. Wikipedia]
The Energy resources diagram example was created in the ConceptDraw PRO diagramming and vector drawing software using the Manufacturing and Maintenance solution from the Illustration area of ConceptDraw Solution Park.
This PFD sample was redesigned from the Wikipedia file: NaturalGasCondensate.png.
"This is a schematic flow diagram of a typical facility for separating and recovering liquid condensate from raw natural gas."
[en.wikipedia.org/ wiki/ File:NaturalGasCondensate.png]
"Natural-gas condensate is a low-density mixture of hydrocarbon liquids that are present as gaseous components in the raw natural gas produced from many natural gas fields. It condenses out of the raw gas if the temperature is reduced to below the hydrocarbon dew point temperature of the raw gas.
The natural gas condensate is also referred to as simply condensate, or gas condensate, or sometimes natural gasoline because it contains hydrocarbons within the gasoline boiling range. Raw natural gas may come from any one of three types of gas wells:
(1) Crude oil wells - Raw natural gas that comes from crude oil wells is called associated gas. This gas can exist separate from the crude oil in the underground formation, or dissolved in the crude oil.
(2) Dry gas wells - These wells typically produce only raw natural gas that does not contain any hydrocarbon liquids. Such gas is called non-associated gas.
(3) Condensate wells - These wells produce raw natural gas along with natural gas liquid. Such gas is also non-associated gas and often referred to as wet gas." [Natural-gas condensate. Wikipedia]
The process flow diagram example "Natural gas condensate - PFD" was drawn using the ConceptDraw PRO software extended with the Chemical and Process Engineering solution from the Chemical and Process Engineering area of ConceptDraw Solution Park.
This work flow chart sample was redesigned from the picture "Weather Forecast" from the article "Simulation Workflows".
[iaas.uni-stuttgart.de/ forschung/ projects/ simtech/ sim-workflows.php]
"(1) The weather is predicted for a particular geological area. Hence, the workflow is fed with a model of the geophysical environment of ground, air and water for a requested area.
(2) Over a specified period of time (e.g. 6 hours) several different variables are measured and observed. Ground stations, ships, airplanes, weather balloons, satellites and buoys measure the air pressure, air/ water temperature, wind velocity, air humidity, vertical temperature profiles, cloud velocity, rain fall, and more.
(3) This data needs to be collected from the different sources and stored for later access.
(4) The collected data is analyzed and transformed into a common format (e.g. Fahrenheit to Celsius scale). The normalized values are used to create the current state of the atmosphere.
(5) Then, a numerical weather forecast is made based on mathematical-physical models (e.g. GFS - Global Forecast System, UKMO - United Kingdom MOdel, GME - global model of Deutscher Wetterdienst). The environmental area needs to be discretized beforehand using grid cells. The physical parameters measured in Step 2 are exposed in 3D space as timely function. This leads to a system of partial differential equations reflecting the physical relations that is solved numerically.
(6) The results of the numerical models are complemented with a statistical interpretation (e.g. with MOS - Model-Output-Statistics). That means the forecast result of the numerical models is compared to statistical weather data. Known forecast failures are corrected.
(7) The numerical post-processing is done with DMO (Direct Model Output): the numerical results are interpolated for specific geological locations.
(8) Additionally, a statistical post-processing step removes failures of measuring devices (e.g. using KALMAN filters).
(9) The statistical interpretation and the numerical results are then observed and interpreted by meteorologists based on their subjective experiences.
(10) Finally, the weather forecast is visualized and presented to interested people." [iaas.uni-stuttgart.de/ forschung/ projects/ simtech/ sim-workflows.php]
The example "Workflow diagram - Weather forecast" was drawn using the ConceptDraw PRO diagramming and vector drawing software extended with the Workflow Diagrams solution from the Business Processes area of ConceptDraw Solution Park.
The vector stencils library "Fluid power equipment" contains 113 symbols of hydraulic and pneumatic equipment including pumps, motors, air compressors, cylinders, meters, gauges, and actuators. Use it to design fluid power and hydraulic control systems.
"Fluid power is the use of fluids under pressure to generate, control, and transmit power. Fluid power is subdivided into hydraulics using a liquid such as mineral oil or water, and pneumatics using a gas such as air or other gases. Compressed-air and water-pressure systems were once used to transmit power from a central source to industrial users over extended geographic areas; fluid power systems today are usually within a single building or mobile machine." [Fluid power. Wikipedia]
The shapes example "Design elements - Fluid power equipment" was created using the ConceptDraw PRO diagramming and vector drawing software extended with the Mechanical Engineering solution from the Engineering area of ConceptDraw Solution Park.
- Cafe performance metrics vs. air temperature - Visual dashboard ...
- Cafe performance metrics vs. air temperature - Visual dashboard
- Air temperature correlations - Cafe dashboard
- HVAC Plans | How to Create a HVAC Plan | Air handler- HVAC plan ...
- Process Flow Chart | Process Flow Diagram | Graphic Symbol Of ...
- Temperature controller 2
- Design elements - Lamps, acoustics, measuring instruments ...
- Temperature Sensor
- Temperature Transducer Symbol
- Flow control, temperature compensated
- Food security assessment - Flowchart | Weather - Vector stencils ...
- Weather - Vector stencils library | Design Elements - Weather ...
- Symbol For Temperature Timer
- Temperature
- Design elements - HVAC controls | HVAC controls - Vector stencils ...
- Weather - Vector stencils library
- The Elements Of Cloudy Weather
- HVAC controls - Vector stencils library
- Water Sensor Circuit Symbol
,-pneumatic-fluid-power-equipment---vector-stencils-library.png--diagram-flowchart-example.png)
,-hydraulic-fluid-power-equipment---vector-stencils-library.png--diagram-flowchart-example.png)




















-fluid-power-equipment---vector-stencils-library.png--diagram-flowchart-example.png)
-fluid-power-equipment---vector-stencils-library.png--diagram-flowchart-example.png)
-fluid-power-equipment---vector-stencils-library.png--diagram-flowchart-example.png)
-fluid-power-equipment---vector-stencils-library.png--diagram-flowchart-example.png)












,-1-valve-fluid-power-valves---vector-stencils-library.png--diagram-flowchart-example.png)
,-both-valves-fluid-power-valves---vector-stencils-library.png--diagram-flowchart-example.png)
,-no-valves-fluid-power-valves---vector-stencils-library.png--diagram-flowchart-example.png)
,-1-valve,-encl.-fluid-power-valves---vector-stencils-library.png--diagram-flowchart-example.png)
,-both-valves,-encl.-fluid-power-valves---vector-stencils-library.png--diagram-flowchart-example.png)
,-no-valves,-encl.-fluid-power-valves---vector-stencils-library.png--diagram-flowchart-example.png)
,-1-valve-fluid-power-valves---vector-stencils-library.png--diagram-flowchart-example.png)
,-both-valves-fluid-power-valves---vector-stencils-library.png--diagram-flowchart-example.png)
,-no-valves-fluid-power-valves---vector-stencils-library.png--diagram-flowchart-example.png)
,-1-valve,-encl.-fluid-power-valves---vector-stencils-library.png--diagram-flowchart-example.png)
,-both-valves,-encl.-fluid-power-valves---vector-stencils-library.png--diagram-flowchart-example.png)
,-no-valves,-encl.-fluid-power-valves---vector-stencils-library.png--diagram-flowchart-example.png)



-fluid-power-valves---vector-stencils-library.png--diagram-flowchart-example.png)


































-natural-gas-condensate---pfd.png--diagram-flowchart-example.png)

