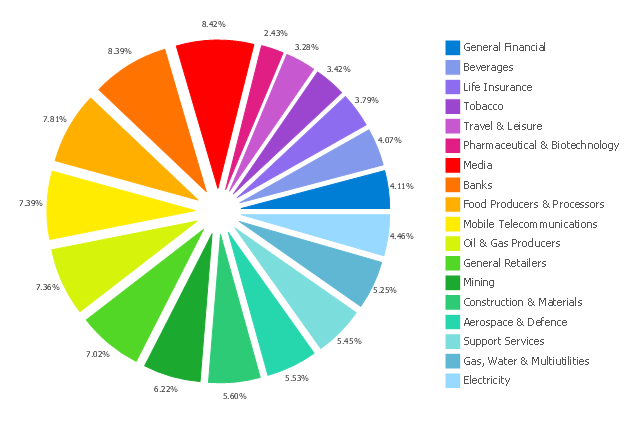
This exploded pie chart example was redrawn from Wikipedia file: Badpie.png [en.wikipedia.org/ wiki/ File:Badpie.png].
This image is available under the Creative Commons Attribution-ShareAlike 3.0 Unported License [creativecommons.org/ licenses/ by-sa/ 3.0/ ].
"The classical breakdown of all economic sectors follows:
Primary: Involves the retrieval and production of raw materials, such as corn, coal, wood and iron. (A coal miner and a fisherman would be workers in the primary sector.)
Secondary: Involves the transformation of raw or intermediate materials into goods e.g. manufacturing steel into cars, or textiles into clothing. (A builder and a dressmaker would be workers in the secondary sector.)
Tertiary: Involves the supplying of services to consumers and businesses, such as baby-sitting, cinema and banking. (A shopkeeper and an accountant would be workers in the tertiary sector.)
In the 20th century, it began to be argued that traditional tertiary services could be further distinguished from "quaternary" and quinary service sectors." [Economic sector. Wikipedia]
The exploded pie chart example "Sector weightings" was created using the ConceptDraw PRO diagramming and vector drawing software extended with the Pie Charts solution of the Graphs and Charts area in ConceptDraw Solution Park.
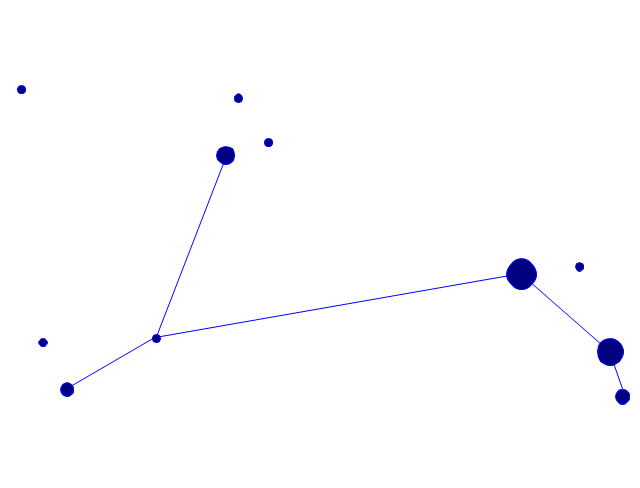
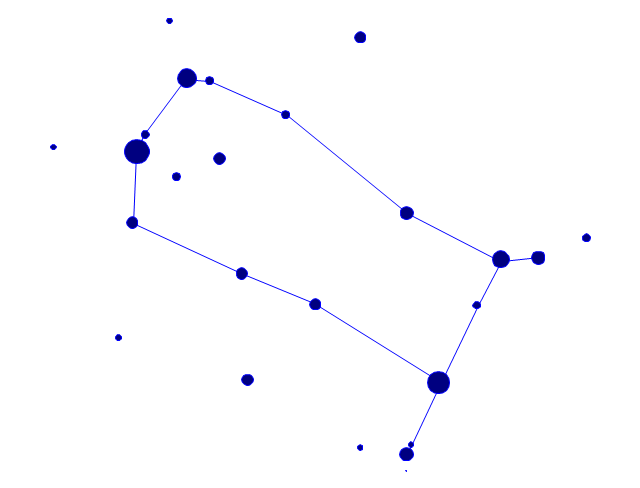
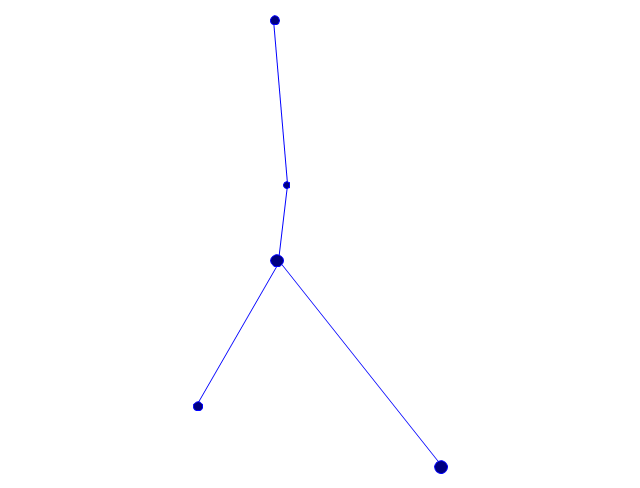
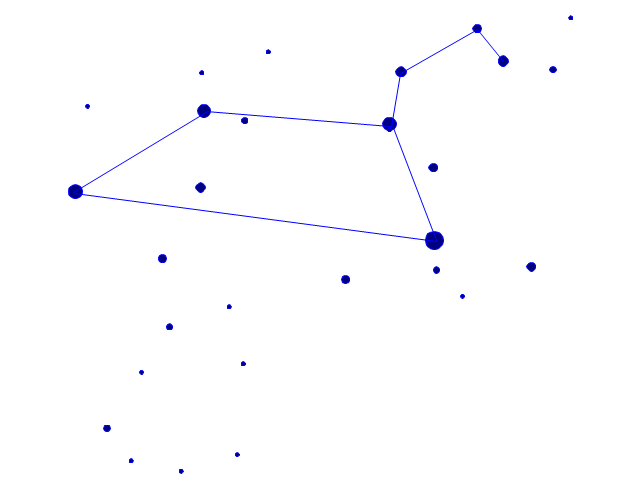
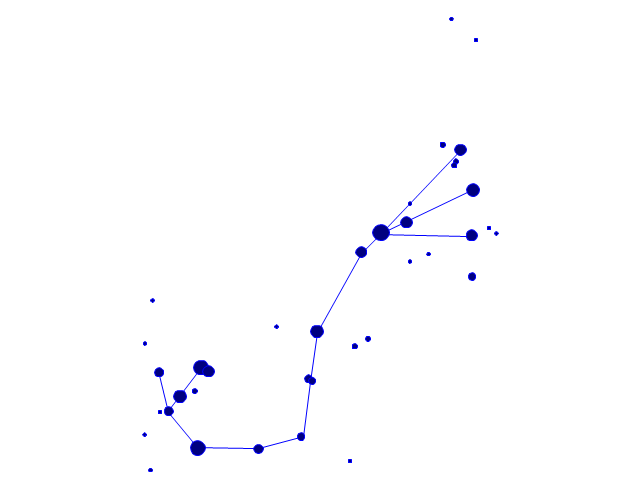
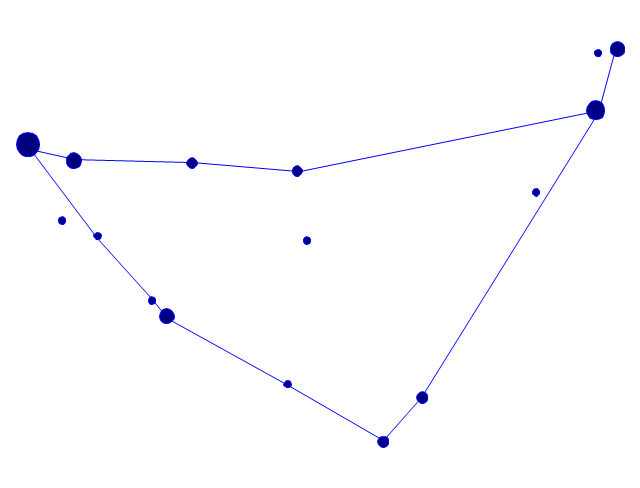
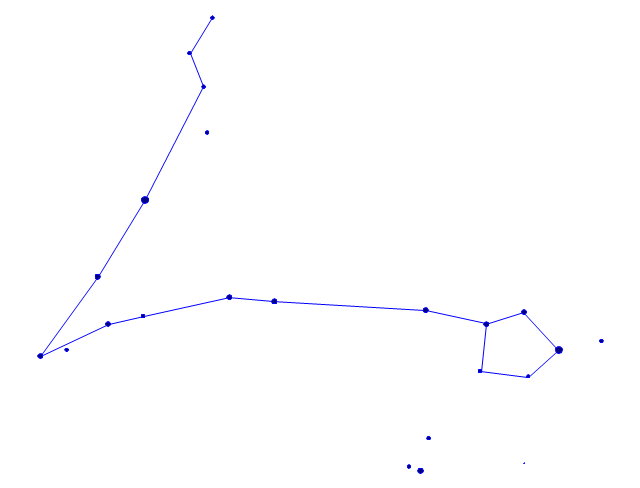
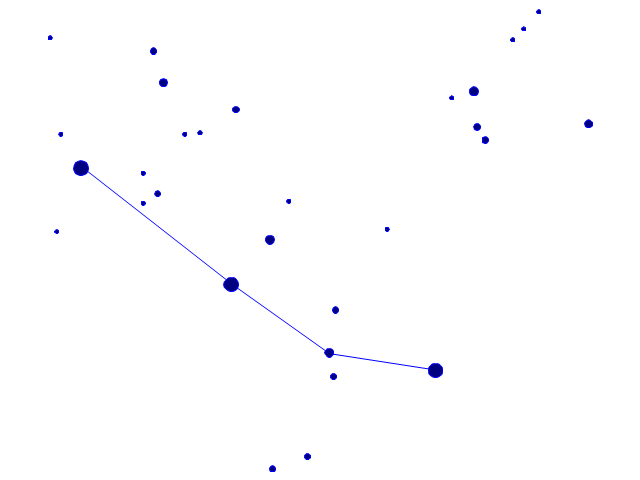
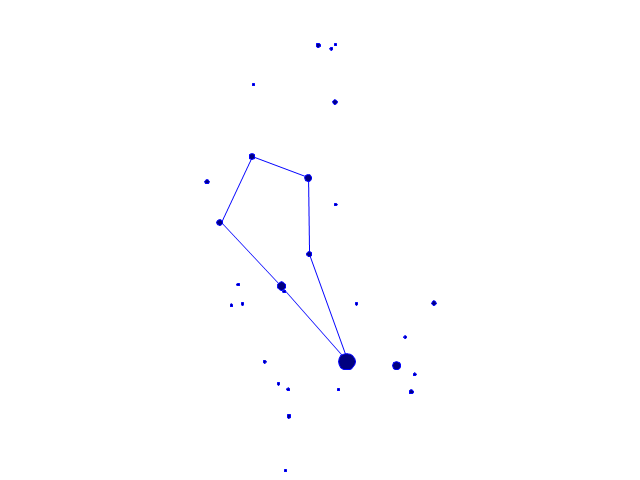
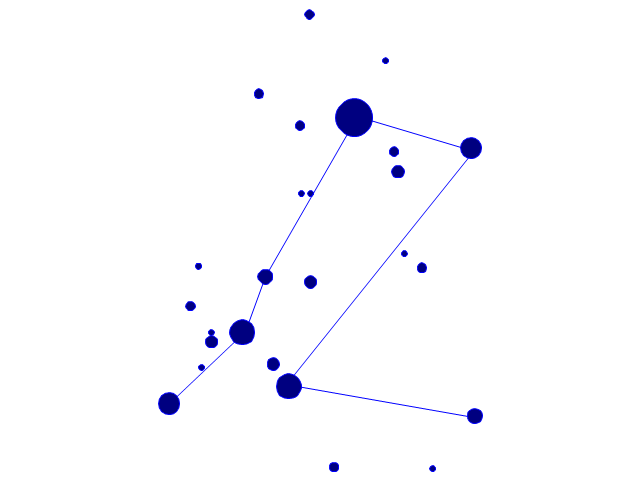
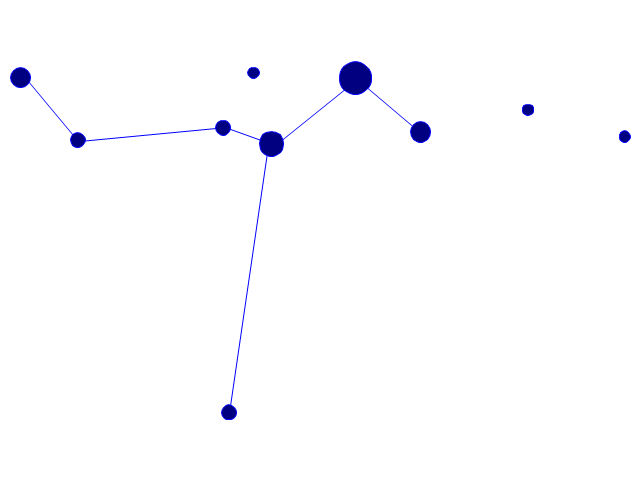
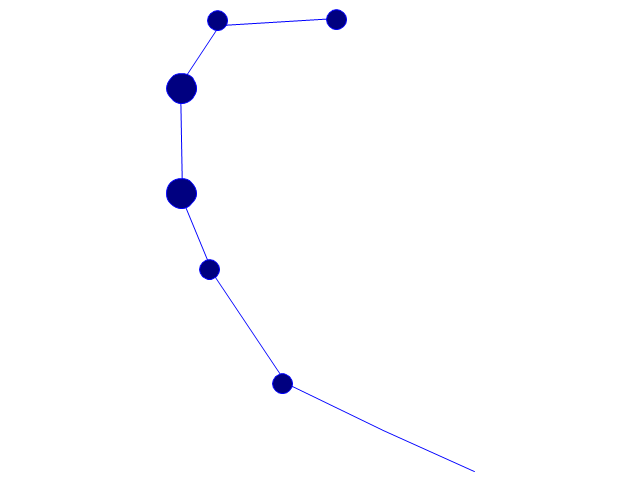
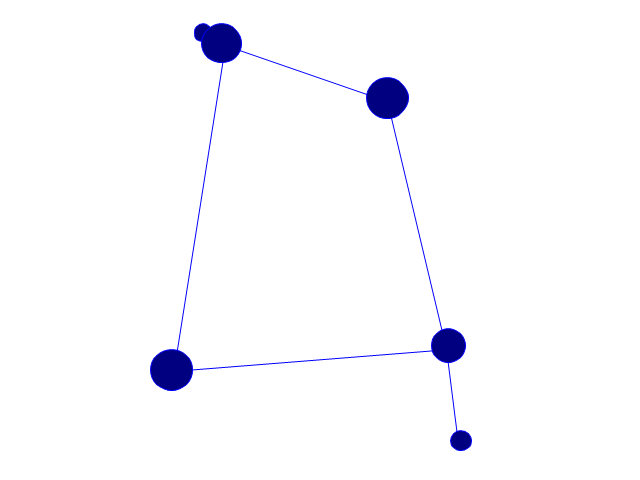
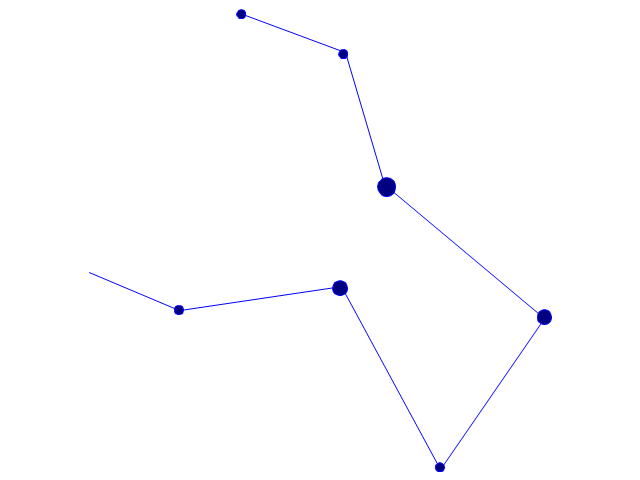
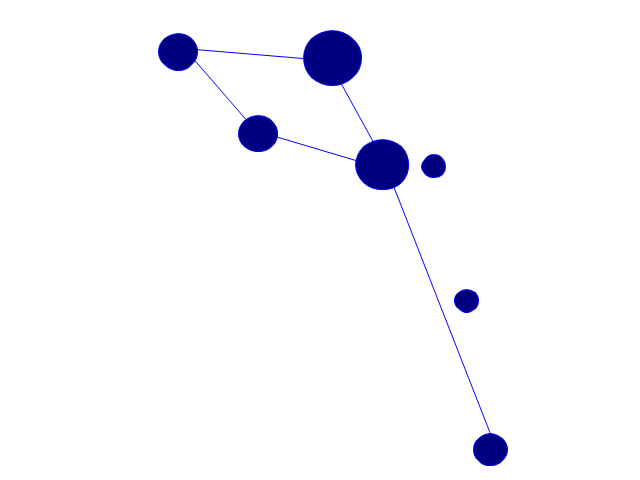
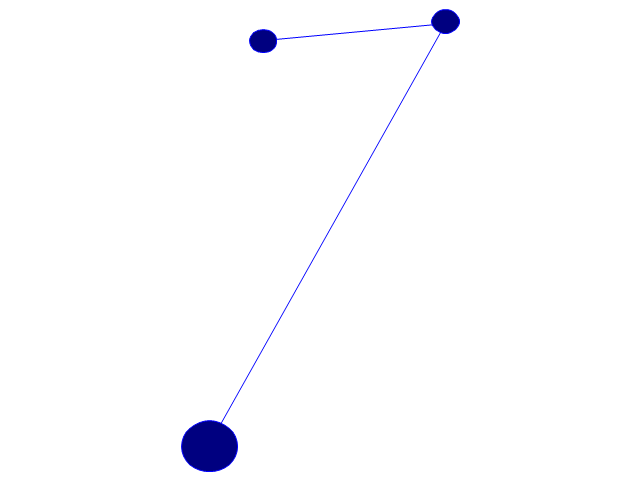
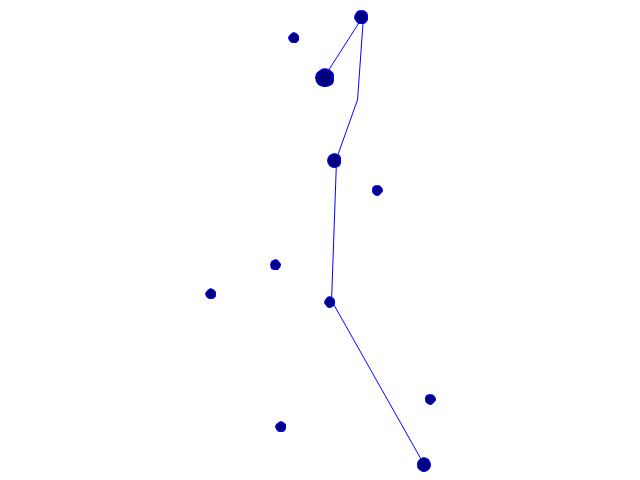
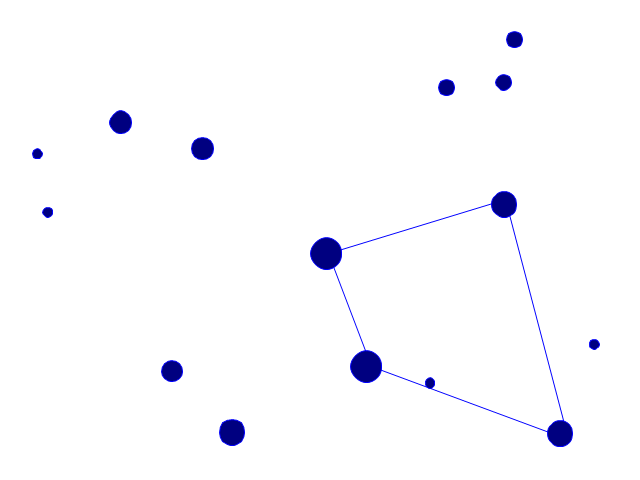
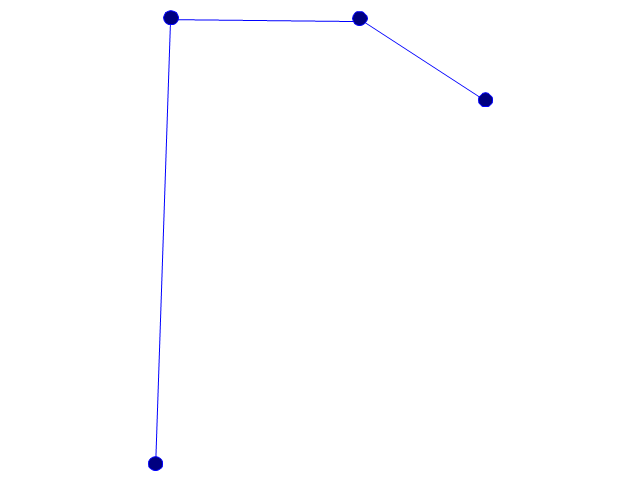
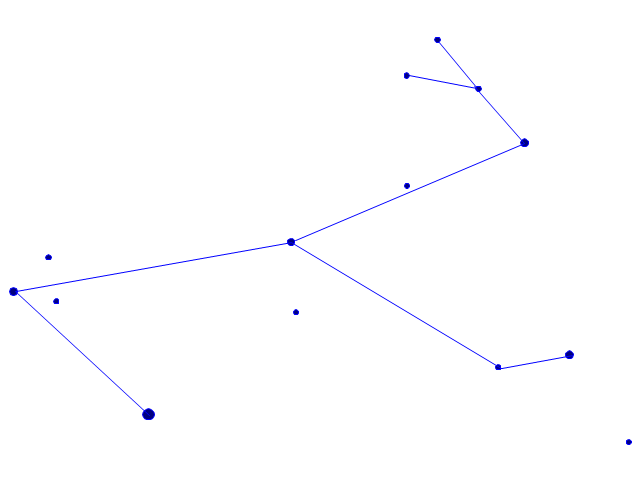
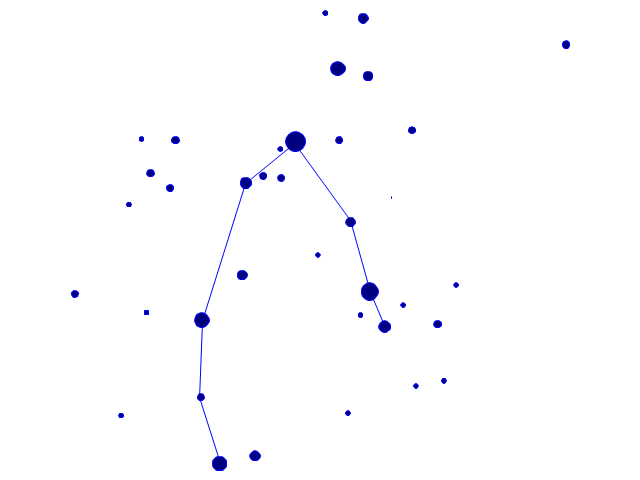
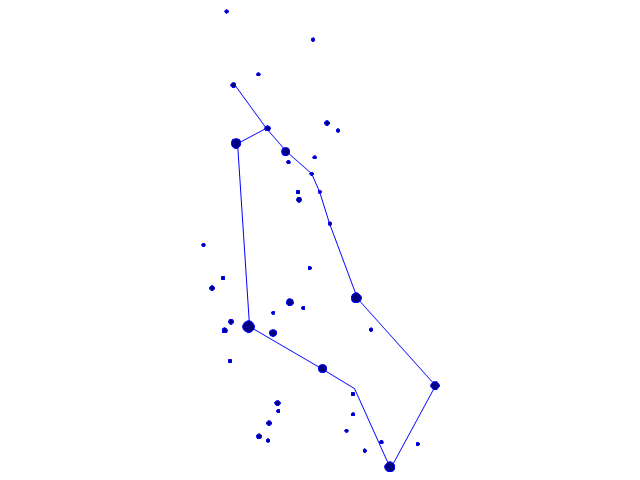
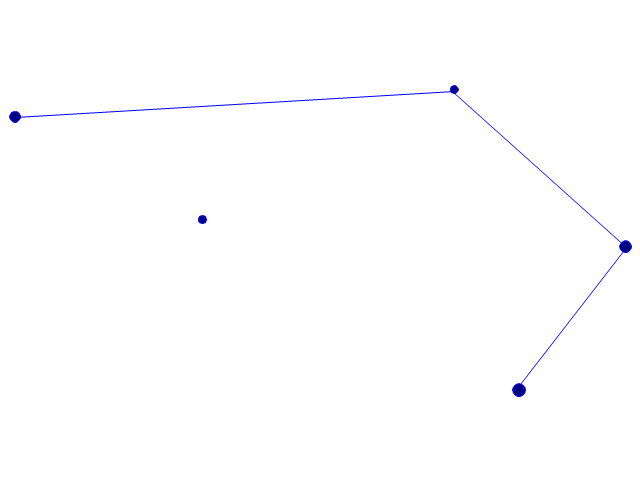
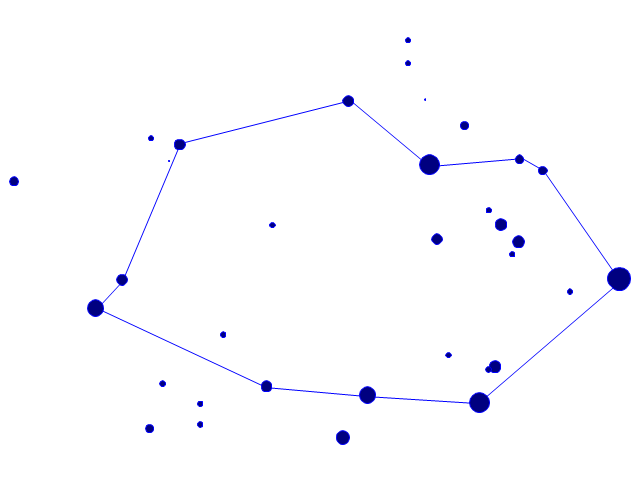
The vector stencils library "Zodiac constellations" contains 24 icons of Zodiac constellations star charts and Zodiac sign symbols.
Use these shapes to draw astronomical diagrams and illustrations in the ConceptDraw PRO diagramming and vector drawing software extended with the Astronomy solution from the Science and Education area in ConceptDraw Solution Park.
Use these shapes to draw astronomical diagrams and illustrations in the ConceptDraw PRO diagramming and vector drawing software extended with the Astronomy solution from the Science and Education area in ConceptDraw Solution Park.
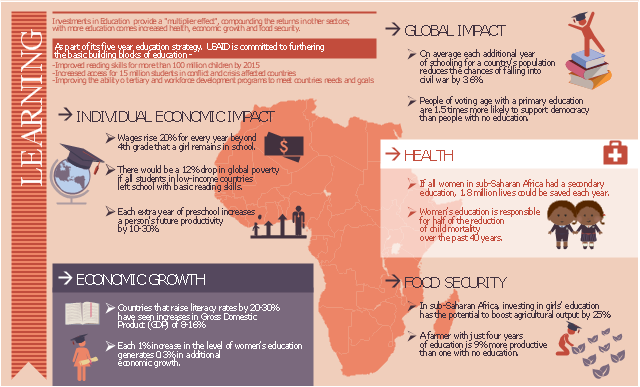
This example was designed on the base of infographic "Learning 2" from the USAID website.
"Investments in Education provide a "multiplier effect", compounding the returns in other sectors, with more education comes increased health, economic growth and food security.
As part of its five year education strategy, USAID is committed to furtering the basic building blocks of uducation - 1) Improved reading skills for more than 100 million children by 2015, 2) Increased access for 15 million students in conflict and crisis affected countries, and 3) Improving the ability of tertiary and workforce development programs to meet countries' needs and goals." [50.usaid.gov/ infographic-learning-squared/ learningsq-1000/ ?size=infographicMedium]
The educational infogram "Learning infogram" was created using the ConceptDraw PRO diagramming and vector drawing software extended with the Education Infographics solition from the area "Business Infographics" in ConceptDraw Solution Park.
Used Solutions
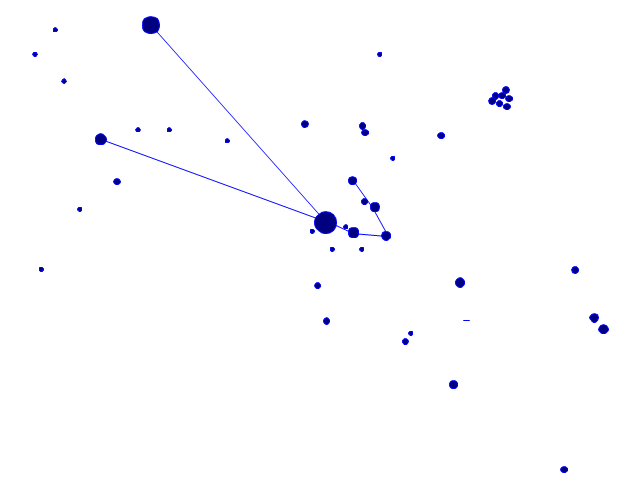
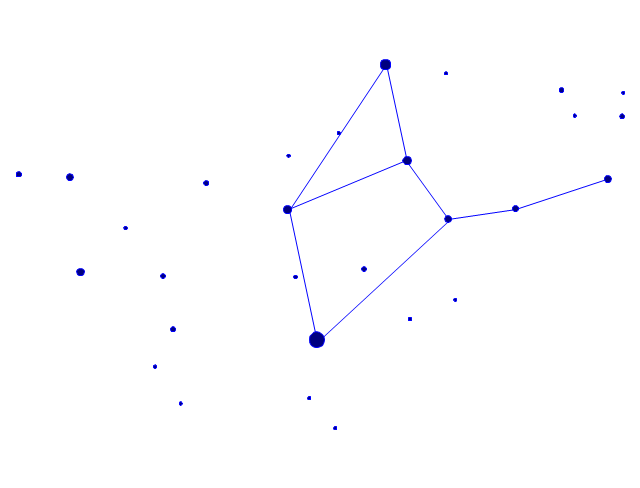
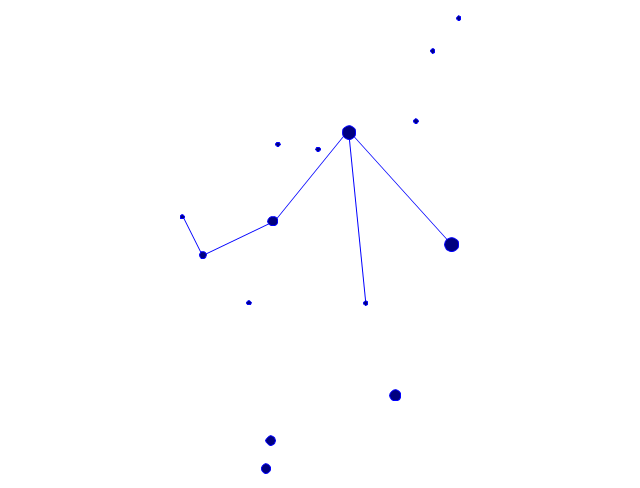
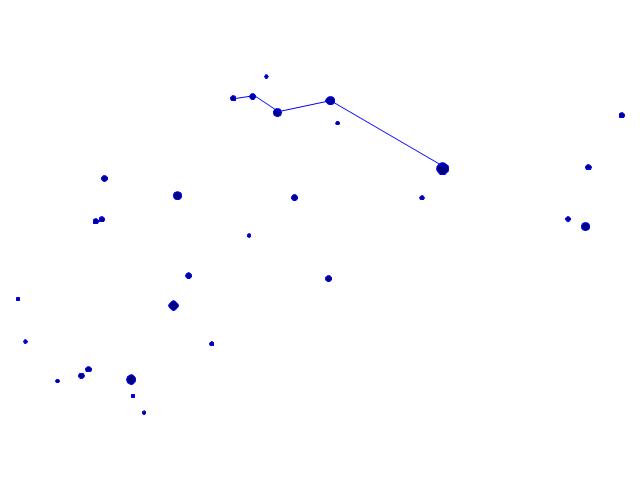
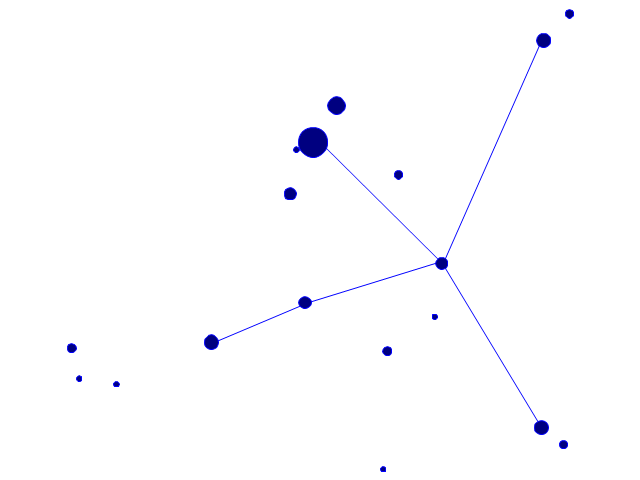
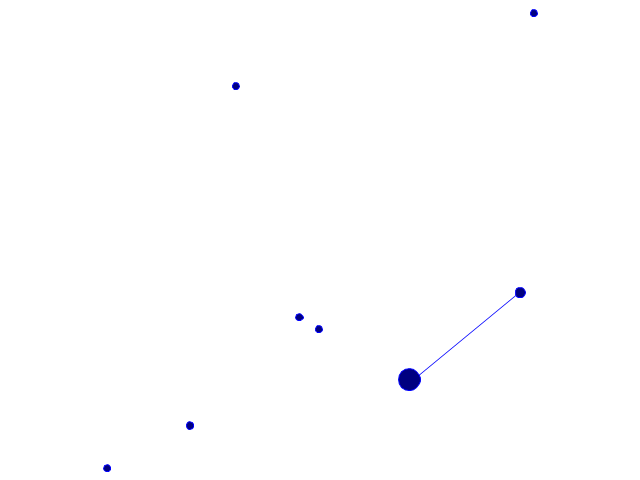
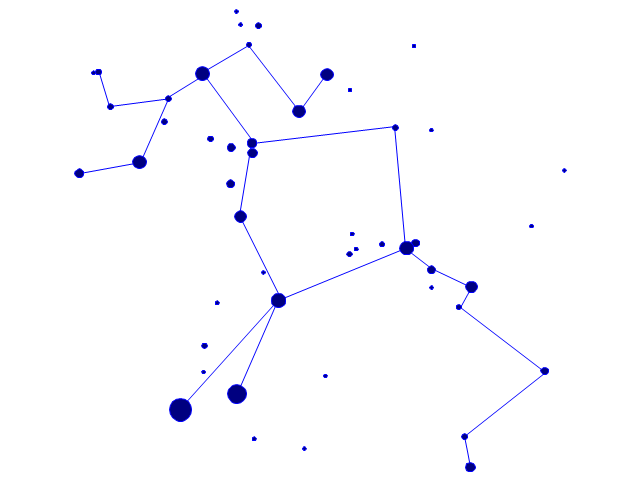
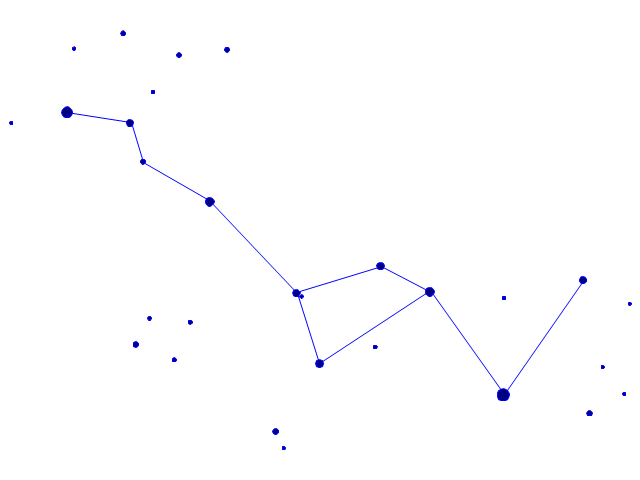
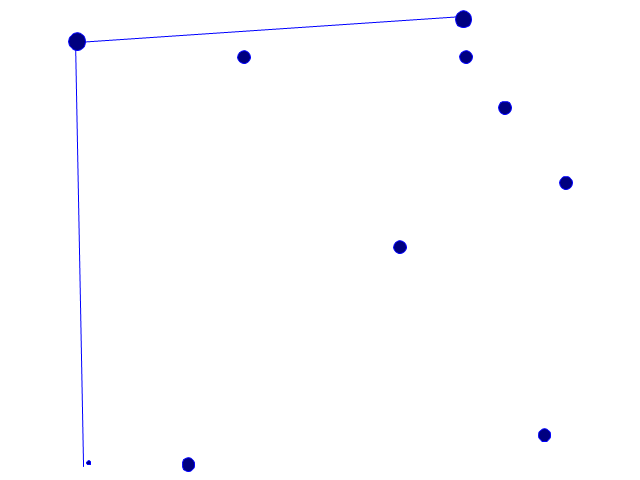
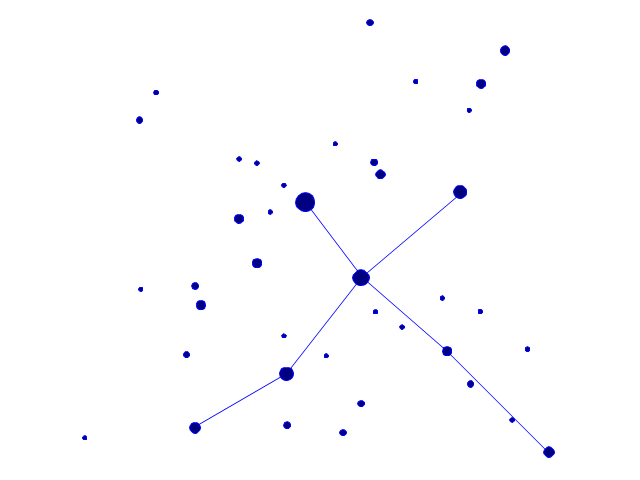
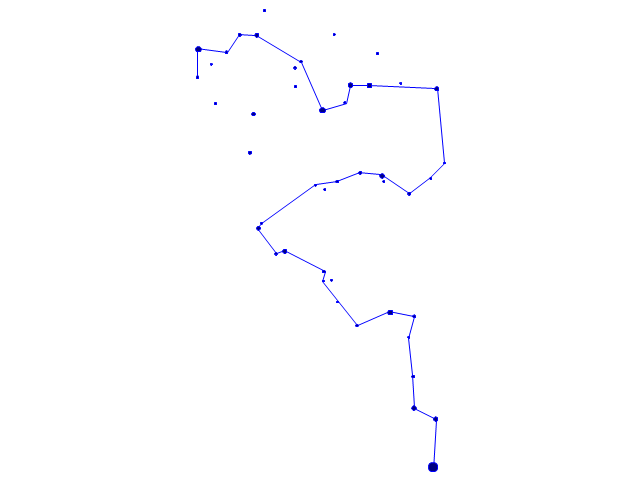
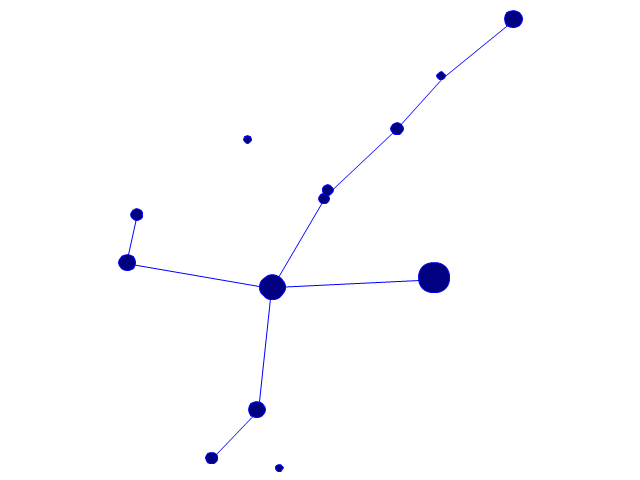
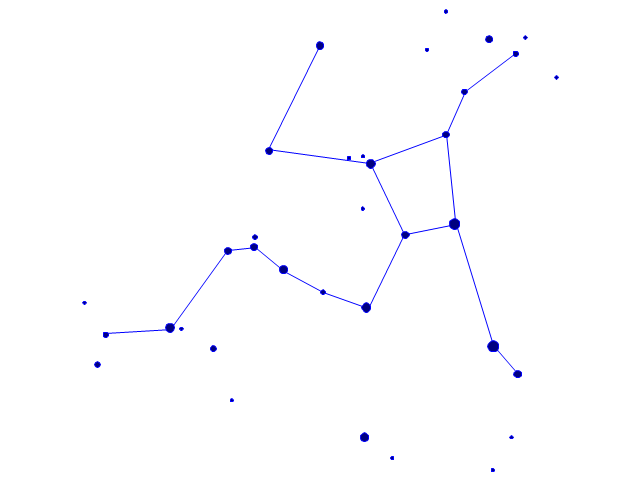
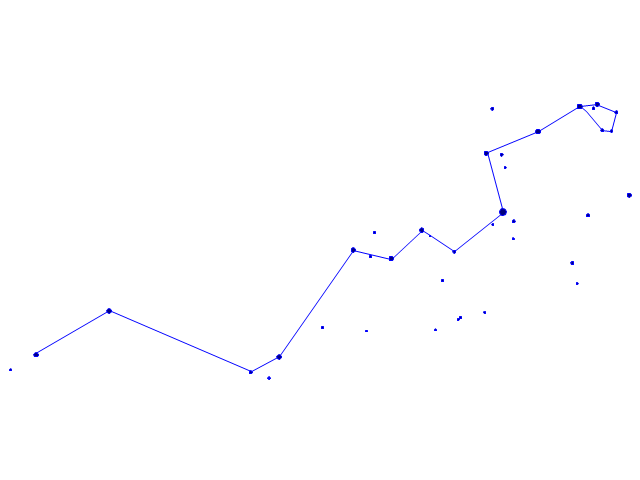
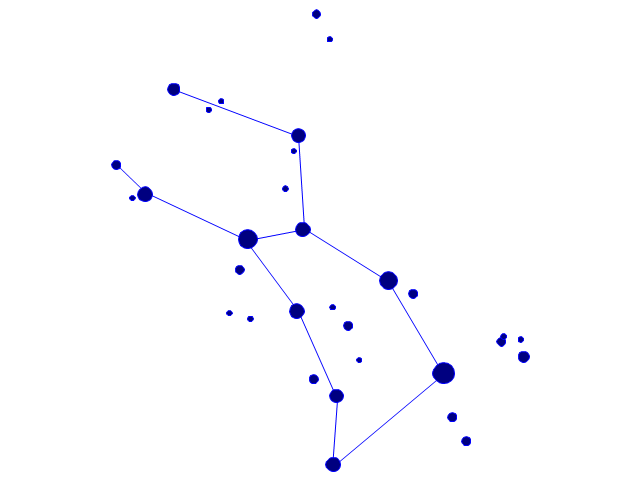
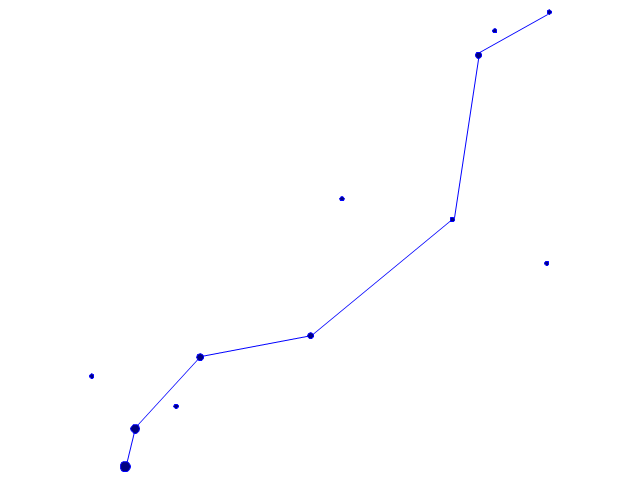
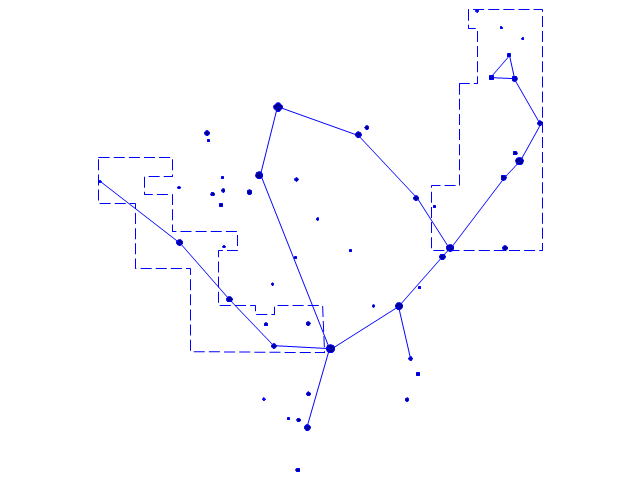
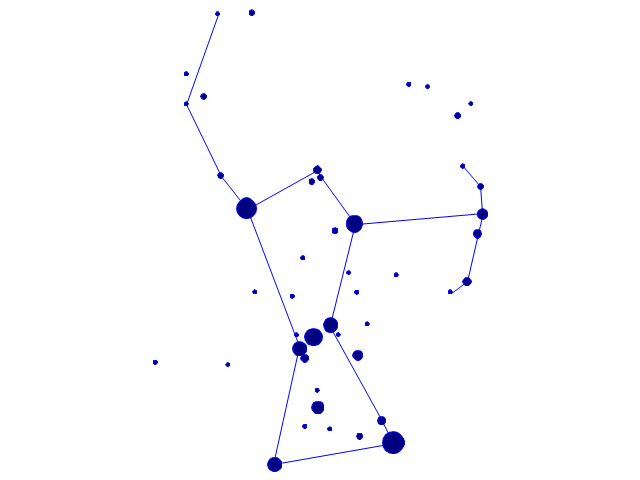
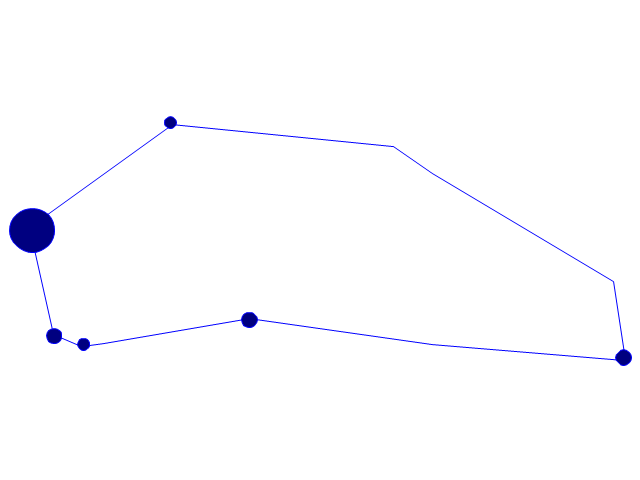
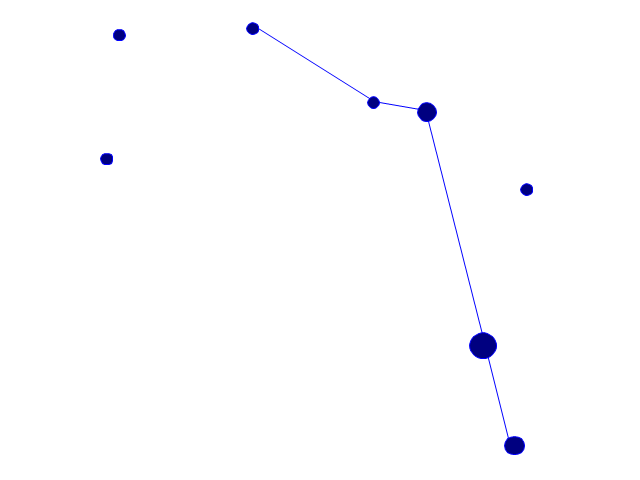
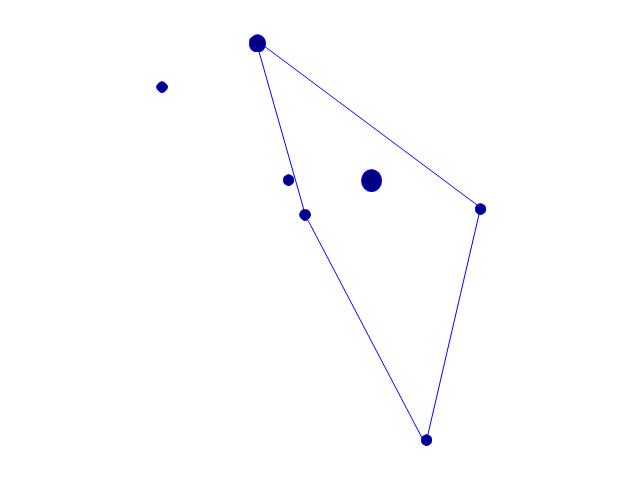
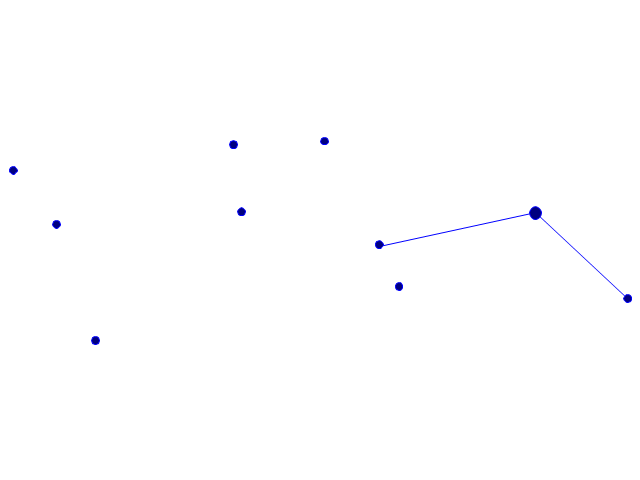
The vector stencils library "Constellations except Zodiac, Northern and Southern" contains 47 star constellation maps of all constellations except Zodiac, Northern (45-90 degrees) and Southern (45-90 degrees).
Use these shapes for drawing astronomical diagrams and illustrations in ConceptDraw PRO diagramming and vector drawing software extended with the Astronomy solution from the Science and Education area in ConceptDraw Solution Park.
Use these shapes for drawing astronomical diagrams and illustrations in ConceptDraw PRO diagramming and vector drawing software extended with the Astronomy solution from the Science and Education area in ConceptDraw Solution Park.
- The Flow Chart Of Primary Sector And Secondary Sector And Tertiary
- Flow Chart Of Clothing Including Primary Sector Secondary Sector ...
- Sector diagram - Template | Sector weightings - Exploded pie chart ...
- Sector weightings - Exploded pie chart | Bar Diagrams for Problem ...
- Sector weightings - Exploded pie chart | Stakeholder Onion ...
- Sector weightings - Exploded pie chart | Pyramid Chart Examples ...
- Winter Sports | Sector weightings - Exploded pie chart | Student ...
- Schedule pie chart - Daily action plan | Sector weightings - Exploded ...
- Pie Chart Examples and Templates | Bar Diagrams for Problem ...
- Bar Diagrams for Problem Solving. Create economics and financial ...
- Draw A Flow Chart To Show The Primary Sector Of Any Good The ...
- Zodiac constellations - Vector stencils library
- How to Draw the Different Types of Pie Charts | Percentage Pie ...
- European Parliament election - Exploded pie chart | Exploded pie ...
- Exploded pie chart (percentage) - Template | European Parliament ...
- Pie Chart Examples and Templates | Pie Donut Chart. Pie Chart ...
- Pyramid Chart Examples | Pyramid Diagram | Pyramid Diagram ...
- Seating Plans | Cinema video and audio equipment layout | Building ...
- Pie Chart Examples and Templates | Pie Chart Software | Pie Donut ...
- Pie Charts | Pie Chart Software | How to Draw the Different Types of ...
