AWS Simple Icons for Architecture Diagrams
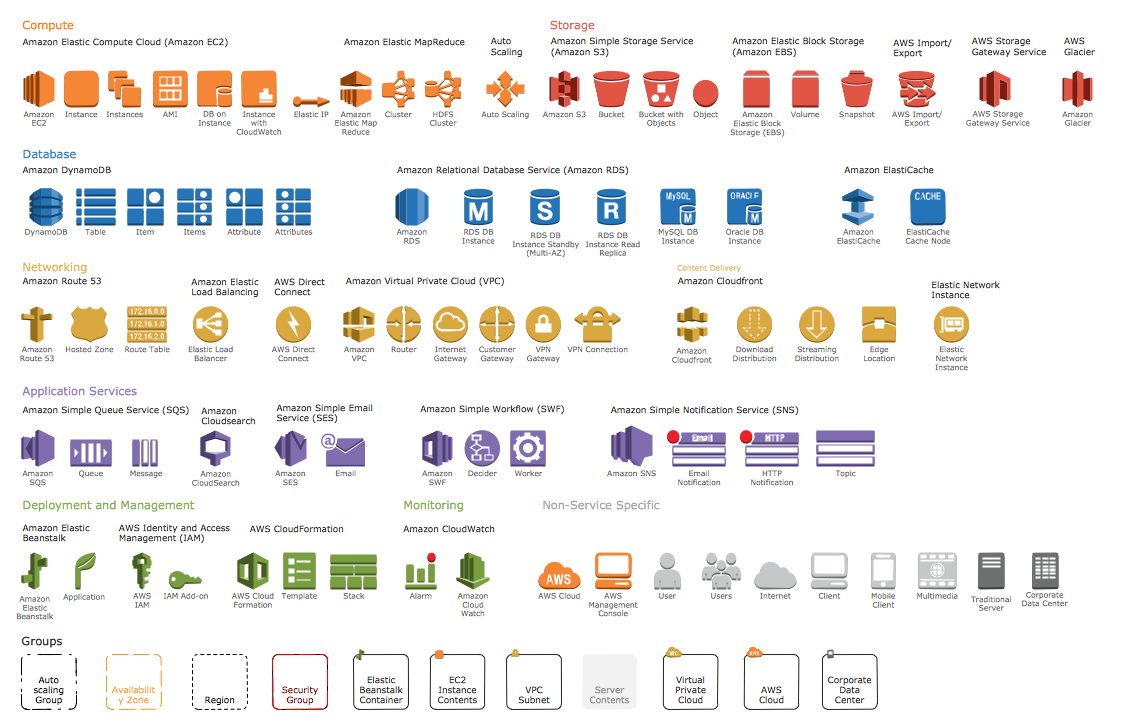
The AWS Architecture Diagrams solution includes icons, sample and templates for several Amazon Web Services products and resources, to be used when creating architecture diagrams. The icons are designed to be simple so that you can easily incorporate them in your diagrams and put them in your whitepapers, presentations, datasheets, posters or any technical material you like.Diagramming software for Amazon Web Service diagrams, charts and schemes
Professional software: visualize general system architecture, AWS diagrams are part of architecturing tools provided with ConceptDraw Solution Park.Amazon Cloud Computing Architecture
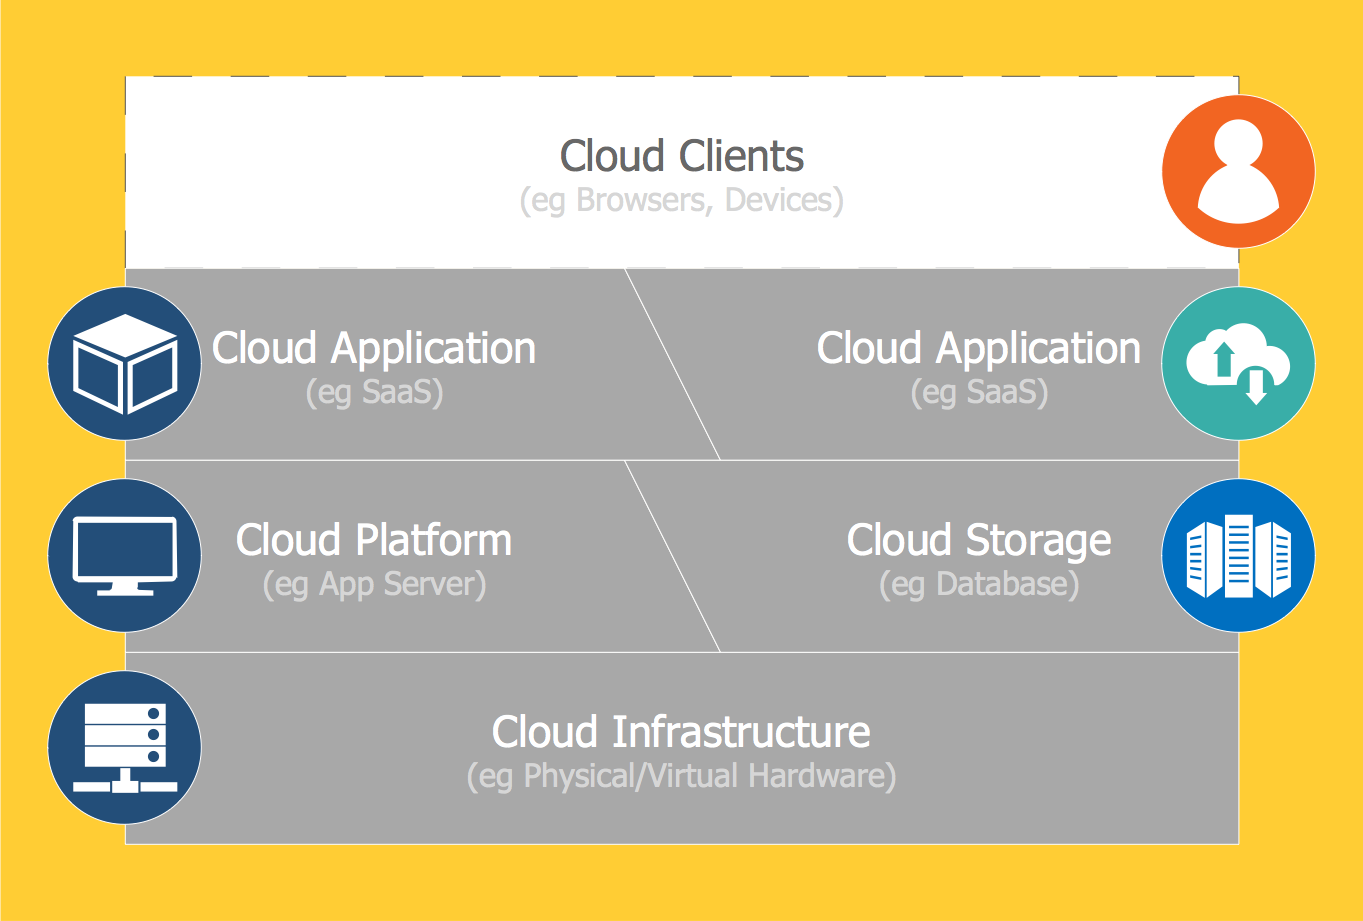
The ConceptDraw PRO diagramming and vector drawing software provides the Cloud Computing Diagrams solution from the Computers and Network area of ConceptDraw Solution Park with powerful drawing tools and libraries containing large amount of predesigned vector objects for easy designing and displaying the structure of Amazon Cloud Computing Architecture.Introduction to Cloud Computing Architecture
The best way to visualize the introduction to Cloud computing architecture is to create diagrams and schematics representing what is a cloud computing and how it works. For their design, we recommend to use a powerful ConceptDraw PRO diagramming and vector drawing software supplied with Cloud Computing Diagrams solution from the Computers and Network area of ConceptDraw Solution Park
 Sales Flowcharts
The Sales Flowcharts solution lets you create and display sales process maps, sales process workflows, sales steps, the sales process, and anything else involving sales process management.
 Computer Network Diagrams
Computer Network Diagrams solution extends ConceptDraw PRO software with samples, templates and libraries of vector icons and objects of computer network devices and network components to help you create professional-looking Computer Network Diagrams, to plan simple home networks and complex computer network configurations for large buildings, to represent their schemes in a comprehensible graphical view, to document computer networks configurations, to depict the interactions between network's components, the used protocols and topologies, to represent physical and logical network structures, to compare visually different topologies and to depict their combinations, to represent in details the network structure with help of schemes, to study and analyze the network configurations, to communicate effectively to engineers, stakeholders and end-users, to track network working and troubleshoot, if necessary.
 Enterprise Architecture Diagrams
Enterprise Architecture Diagrams solution extends ConceptDraw PRO software with templates, samples and library of vector stencils for drawing the diagrams of enterprise architecture models.
Basic Flowchart Symbols and Meaning
Flowcharts are the best for visually representation the business processes and the flow of a custom-order process through various departments within an organization. ConceptDraw PRO diagramming and vector drawing software extended with Flowcharts solution offers the full set of predesigned basic flowchart symbols which are gathered at two libraries: Flowchart and Flowcharts Rapid Draw. Among them are: process, terminator, decision, data, document, display, manual loop, and many other specific symbols. The meaning for each symbol offered by ConceptDraw gives the presentation about their proposed use in professional Flowcharts for business and technical processes, software algorithms, well-developed structures of web sites, Workflow diagrams, Process flow diagram and correlation in developing on-line instructional projects or business process system. Use of ready flow chart symbols in diagrams is incredibly useful - you need simply drag desired from the libraries to your document and arrange them in required order. There are a few serious alternatives to Visio for Mac, one of them is ConceptDraw PRO. It is one of the main contender with the most similar features and capabilities.
Microsoft Azure
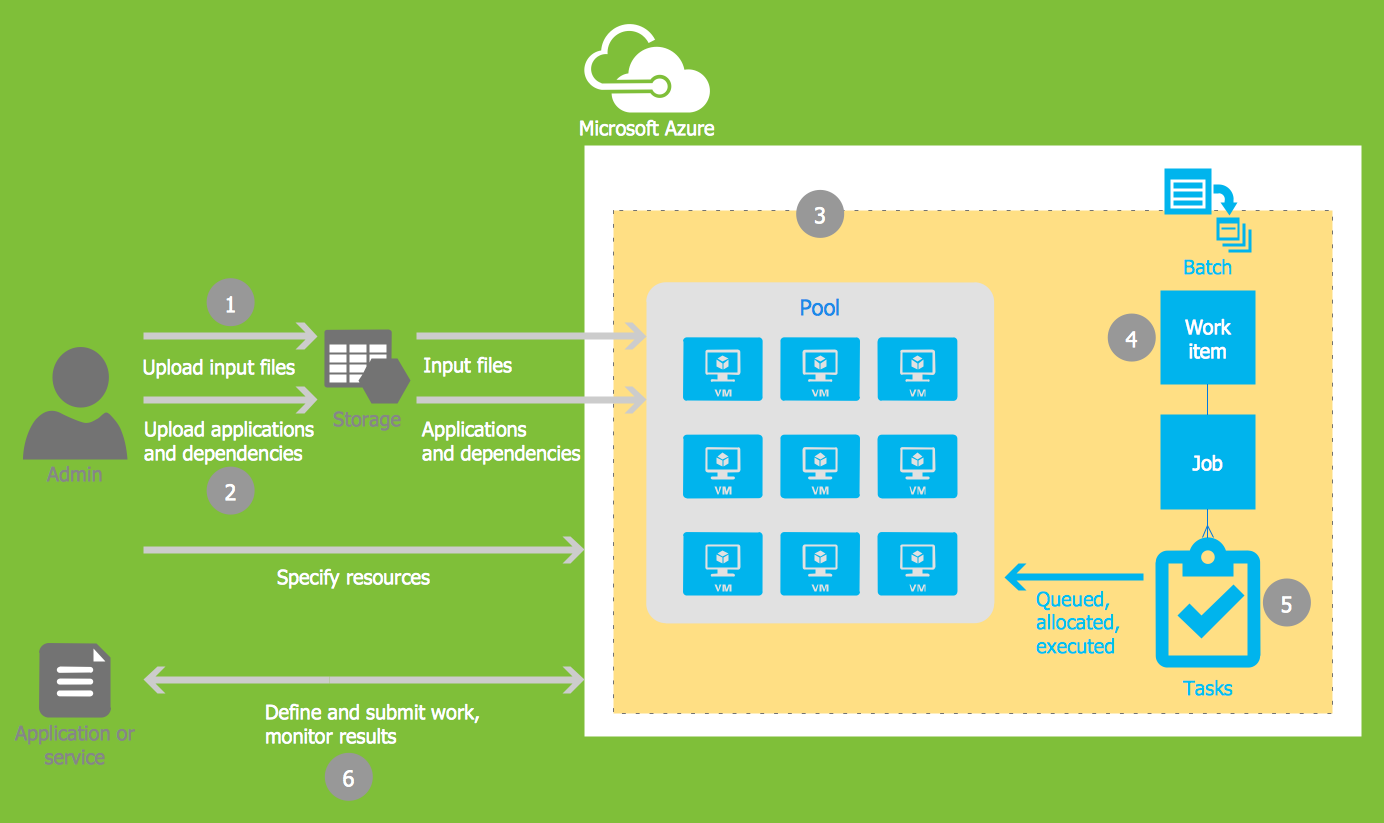
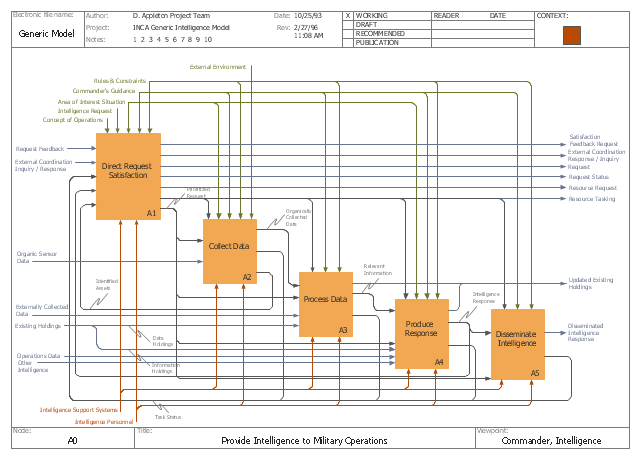
Microsoft Azure is widely used cloud platform which was created by Microsoft and now is managed by Microsoft datacenters in 19 regions of the world, and has a wide set of benefits and features. ConceptDraw PRO diagramming and vector drawing software extended with Azure Architecture Solution from the Computer and Networks area of ConceptDraw Solution Park is the best for designing various pictorial infographics, illustrations and materials showing the possibilities and work of Microsoft Azure Cloud System and Azure services.This IDEF0 diagram example was redesigned from the Wikimedia Commons file: C4ISR Architecture Framework, Example Activity Diagram in IDEF0 Format.jpg. [commons.wikimedia.org/ wiki/ File:C4ISR_ Architecture_ Framework,_ Example_ Activity_ Diagram_ in_ IDEF0_ Format.jpg]
"... the C4ISR concept of Command, Control, Communications, Computers, Intelligence, Surveillance and Reconnaissance ..." [en.wikipedia.org/ wiki/ C4ISR]
"The C4ISR Architectural Framework (C4ISR AF) is now known as DoDAF, is a reference model developed by the US Department of Defense in the 1990s." [commons.wikimedia.org/ wiki/ Category:C4ISR_ Architecture_ Framework]
"The Department of Defense Architecture Framework (DoDAF) is an architecture framework for the United States Department of Defense (DoD) that provides visualization infrastructure for specific stakeholders concerns through viewpoints organized by various views. These views are artifacts for visualizing, understanding, and assimilating the broad scope and complexities of an architecture description through tabular, structural, behavioral, ontological, pictorial, temporal, graphical, probabilistic, or alternative conceptual means.
This Architecture Framework is especially suited to large systems with complex integration and interoperability challenges, and it is apparently unique in its employment of "operational views". These views offer overview and details aimed to specific stakeholders within their domain and in interaction with other domains in which the system will operate." [en.wikipedia.org/ wiki/ Department_ of_ Defense_ Architecture_ Framework]
The example "C4ISR architecture framework - IDEF0 activity diagram" was created using the ConceptDraw PRO diagramming and vector drawing software extended with the solution "IDEF Business Process Diagrams" from the area "Business Processes" of ConceptDraw Solution Park.
Used Solutions
 iPhone User Interface
iPhone User Interface solution extends ConceptDraw PRO v10 software with templates, samples and libraries with large quantity of vector stencils of graphical user interface elements, Apps icons, UI patterns for designing and prototyping of the iOS applic
Entity Relationship Diagram - ERD - Software for Design Crows Foot ER Diagrams
ER-model is a data model which lets describe the conceptual schemes in a specific subject area. It can help to highlight the key entities and specify relationships that can be established between these entities. During the database design, it is realized the transformation of ER model into certain database scheme based on the chosen data model (relational, object, network, etc.). There are used two notations for ERDs: Crow's Foot and Chen's. Crow's Foot notation proposed by Gordon Everest represents the entity by rectangle containing its name (name must be unique within this model), and relation - by the line which links two entities involved in relationship. The relationship's plurality is graphically indicated by a "plug" on the end of the link, the optionality - by a circle. Entity-Relationship Diagrams based on Crow's Foot notation can be easily drawn using the ConceptDraw PRO. Extended with Entity-Relationship Diagram (ERD) solution, it is the best ERD diagrams software with powerful tools and ready design elements for Crow's Foot and Chen notations.
 Pie Charts
Pie Charts are extensively used in statistics and business for explaining data and work results, in mass media for comparison (i.e. to visualize the percentage for the parts of one total), and in many other fields. The Pie Charts solution for ConceptDraw PRO v10 offers powerful drawing tools, varied templates, samples, and a library of vector stencils for simple construction and design of Pie Charts, Donut Chart, and Pie Graph Worksheets.
Garrett IA Diagrams with ConceptDraw PRO
Garrett IA diagrams are used at development of Internet-resources, in particulars at projecting of interactions of web-resource elements. The diagram of information architecture of the web resource which is constructed correctly with necessary details presents to developers the resource in comprehensible and visual way.- North Arrow Sketch Architect Png
- Sun Arrow Png
- Architecture Site Analysis Arrow Png
- Architectural Wind Arrow Png
- North Arrow Architecture Png
- Wind Direction Arrows Architecture Png
- North Arrow Architecture Vector Png
- AWS Simple Icons for Architecture Diagrams | HR arrows - Vector ...
- Vector Arrows Architecture
- North Symbol Architecture Png
- Wind Arrows Architecture
- Architectural Arrow Png
- Large Arrow Curve Png
- Architecture Arrow Png
- Arrows Image Png For Photoshop
- North Sign Architecture Vector Png
- Architectural North Sign Png Image
- Wind Direction Arrows Architecture
- White Large Angle Arrow Png
- Png Vector Workflow For Presentation Free


_Win_Mac.png)
