Basic Flowchart Symbols and Meaning
Flowcharts are the best for visually representation the business processes and the flow of a custom-order process through various departments within an organization. ConceptDraw PRO diagramming and vector drawing software extended with Flowcharts solution offers the full set of predesigned basic flowchart symbols which are gathered at two libraries: Flowchart and Flowcharts Rapid Draw. Among them are: process, terminator, decision, data, document, display, manual loop, and many other specific symbols. The meaning for each symbol offered by ConceptDraw gives the presentation about their proposed use in professional Flowcharts for business and technical processes, software algorithms, well-developed structures of web sites, Workflow diagrams, Process flow diagram and correlation in developing on-line instructional projects or business process system. Use of ready flow chart symbols in diagrams is incredibly useful - you need simply drag desired from the libraries to your document and arrange them in required order. There are a few serious alternatives to Visio for Mac, one of them is ConceptDraw PRO. It is one of the main contender with the most similar features and capabilities.
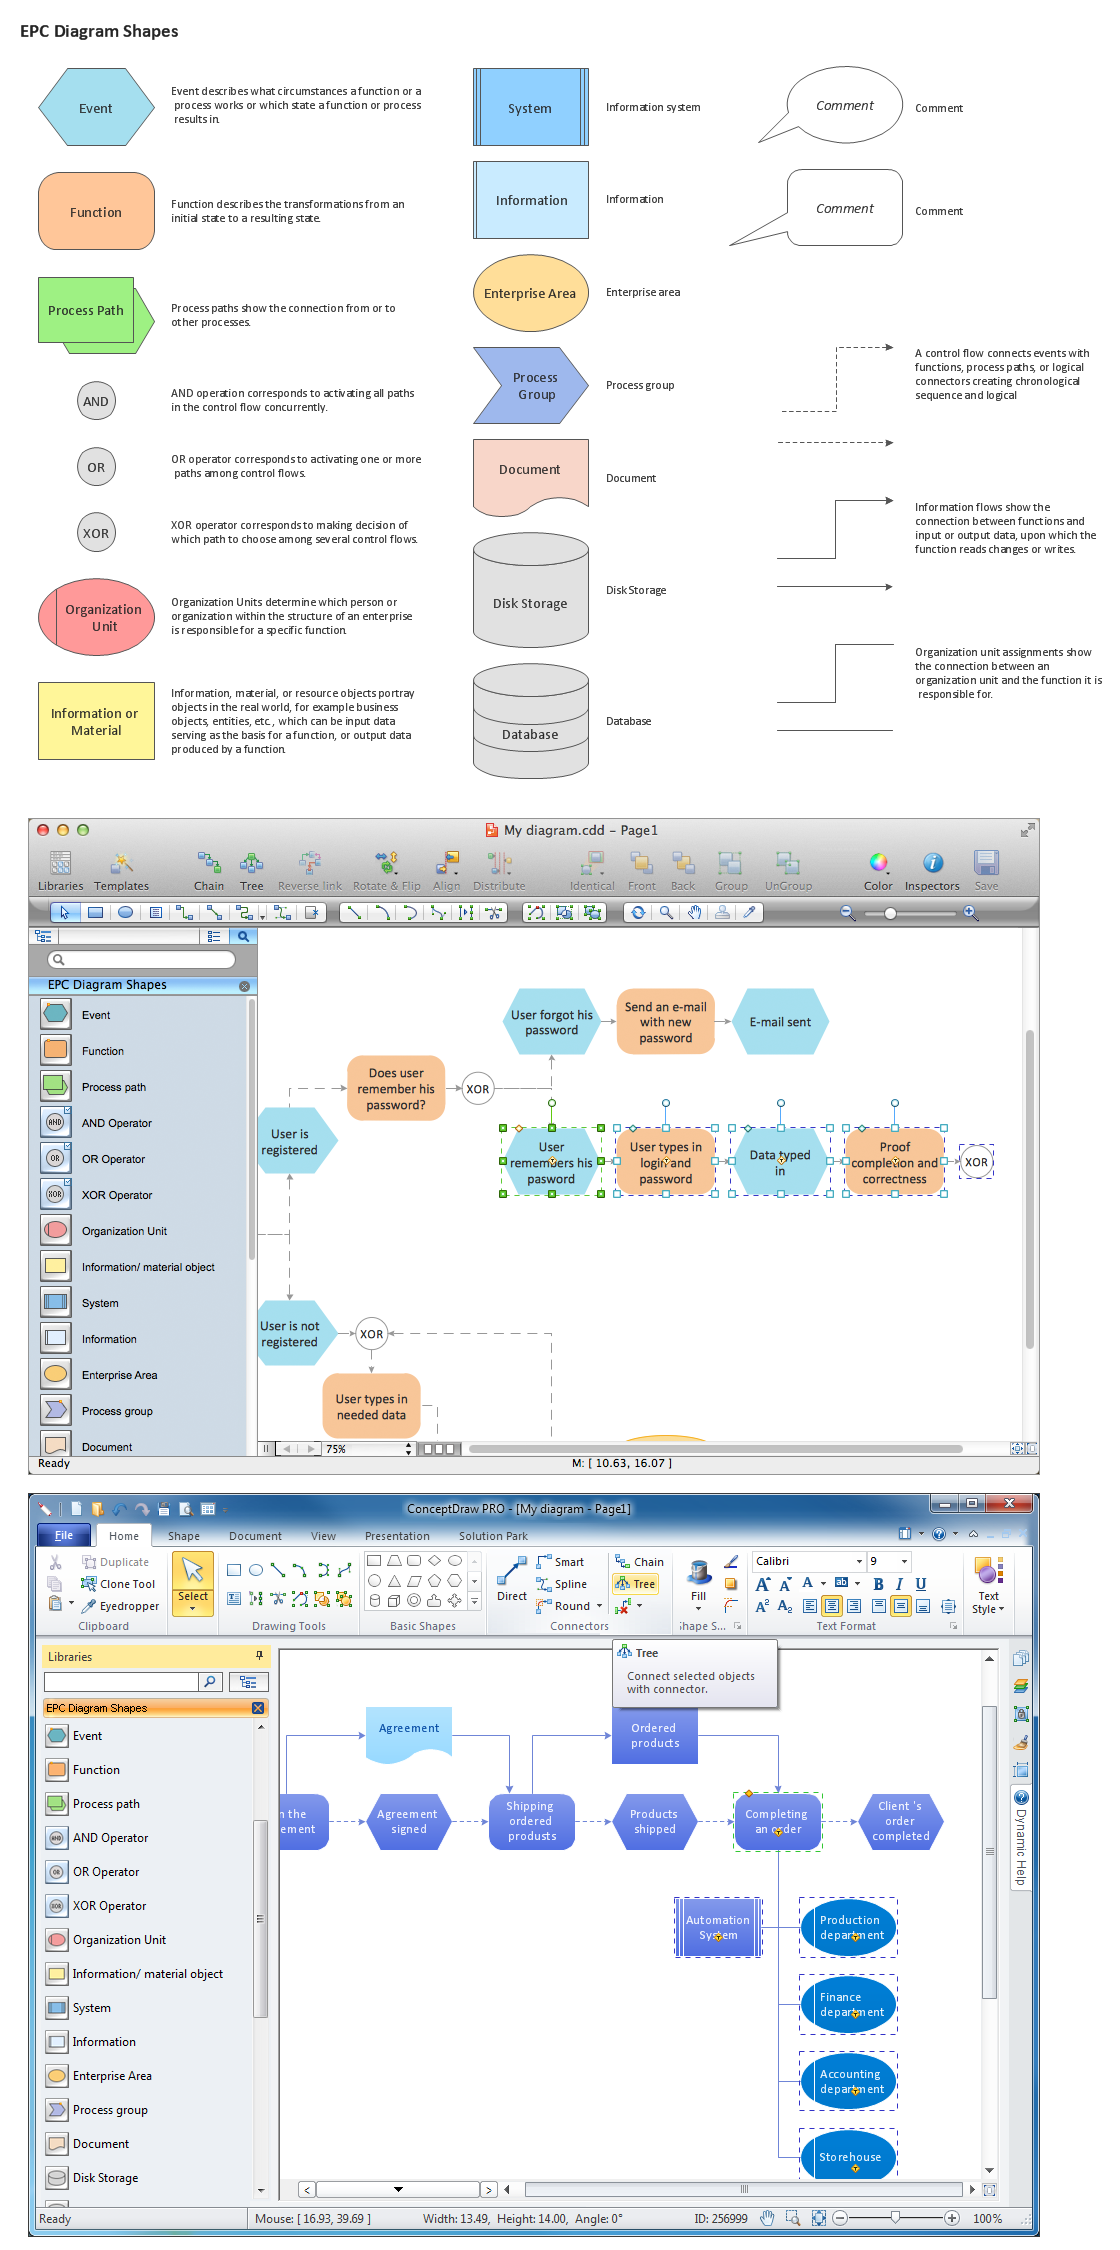
The Building Blocks Used in EPC Diagrams
Event-Driven Process Chain Diagrams is using for improvement throughout an organisation. ConceptDraw PRO - software that reduces the time needed to create a EPC diagrams.
 Engineering
This solution extends ConceptDraw PRO v9.4 with the ability to visualize industrial systems in electronics, electrical, chemical, process, and mechanical engineering.
Cross Functional Diagram
You want design the Cross Functional Diagram and need powerful software? Then ConceptDraw PRO diagramming and vector drawing software extended with Cross-Functional Flowcharts Solution is exactly what you need.HelpDesk
How to Draw a Block Diagram in ConceptDraw PRO
Block diagram is a simple chart that use blocks to show some elements or activities, and connectors that show the relationship between neighboring blocks. They are commonly simple, giving an overview of a process without necessarily going into the specifics of implementation. Block diagrams are commonly used to depict a general description of a system and its activity. A most known sample of a block diagram is a flow chart, used in many types of business as a common method of representing repeated processes. Easy and a simple creation, a number of objects and connectors make the block diagram a many-sided tool for various industries. The ability to make block diagrams is delivered by the ConceptDraw Block Diagrams solution.ConceptDraw Arrows10 Technology
How should diagramming software work? The answer is - Fast and easy. "Tree"- mode drawing works like that. Just select objects in your drawing and press Tree or Chain button to connect all of them just in one click. Your diagram looks professional and it took only a moment to draw.Elements of an Event-Driven Process Chain
Event-Driven Process chain Diagrams for improvement throughout an organisation. ConceptDraw PRO - software that reduces the time needed to create a business process model.Cross-Functional Flowchart Basics
Don't let your first glance fool you. ConceptDraw is a lot easier to use than it looks. Use its cross-functional templates and library as basics to get started. All you need to know are a few basic steps and terms. ConceptDraw Arrows10 Technology is a new age in drawing software. Use it for process flows and its new rapid draw feature enables to draw an impressive charts in a seconds.Graphical Symbols to use in EPC diagrams
Event-Driven Process Chain Diagrams for improvement throughout an organisation. ConceptDraw PRO - software that reduces the time needed to create a business process model.Basic Flowchart Examples
ConceptDraw PRO is a business flowchart software includes the wide flowchart examples package.Best Vector Drawing Application for Mac OS X
ConceptDraw PRO creates drawings, diagrams and charts with great visual appeal in Mac OS X.
 Cross-Functional Flowcharts
Cross-functional flowcharts are powerful and useful tool for visualizing and analyzing complex business processes which requires involvement of multiple people, teams or even departments. They let clearly represent a sequence of the process steps, the order of operations, relationships between processes and responsible functional units (such as departments or positions).
Draw Company Structure with Organization Charting Software
Draw Company Structure Diagram - get the detailed information about the company structure and hierarchy - who execute what tasks and who is in charge at this company. This information shows the reasoning and success of business and is indispensable for investors and financial institutions.
Best Diagramming Software for macOS
ConceptDraw PRO creates drawings, flowcharts, block diagrams, bar charts, histograms, pie charts, divided bar diagrams, line graphs, area charts, scatter plots, circular arrows diagrams, Venn diagrams, bubble diagrams with great visual appeal on Mac OS X.
Basic Diagramming
Mathematics is an exact science, which studies the values, spatial forms and quantitative relations. It is a science, in which is built large number of various diagrams, charts and graphs that present the material in a clear, visual and colorful form, help to analyze the information and to make certain conclusions. A diagram is a graphical representation of data using the linear segments or geometric shapes, which allows to evaluate the ratio of several values. Depending on the types of solved tasks are used the diagrams of different kinds. A graph is a diagram that shows quantitative dependencies of various processes using the curves. ConceptDraw PRO is a powerful intelligent and multifunctional vector engine for drawing different Mathematical diagrams and graphs, Mathematical illustrations, complex and simple Diagram mathematics, Flowcharts of equation solving process, Line graphs, Scatter plots, Histograms, Block diagrams, Bar charts, Divided bar diagrams, Pie charts, Area charts, Circular arrows diagrams, Venn diagrams, Bubble diagrams, Concept maps, and many others.
- Engine Block Diagram
- Block diagram - Automotive HVAC system | Event-driven Process ...
- A Sketch Of An Engine Block Diagram
- Block Diagrams | UML Block Diagram | Basic Diagramming | Block ...
- Block diagram - Automotive HVAC system | Functional Block ...
- Block diagram - Automotive HVAC system | Process Flowchart ...
- Block diagram - Automotive HVAC system | Process Flowchart ...
- Block diagram - Automotive HVAC system | Interior Design Registers ...
- HVAC Plans | Block diagram - Automotive HVAC system | How to ...
- Process Flowchart | Types of Flowcharts | Replacing engine oil ...
- Draw Car Engine Block
- Block diagram - Automotive HVAC system | Create Block Diagram ...
- Block diagram - Automotive HVAC system | HVAC Marketing Plan ...
- Design elements - HVAC equipment | Block Diagrams | Block ...
- Block diagram - Automotive HVAC system | Functional Block ...
- Block diagram - Automotive HVAC system | Functional Block ...
- Block Diagram Of Continents
- Mechanical Engine Diagram
- Block diagram - Automotive HVAC system | HVAC Plans | Create ...
- Block diagram - Automotive HVAC system | HVAC Marketing Plan ...


