The vector stencils library "Fault tree analysis diagrams" contains 12 symbols for drawing Fault Tree Analysis (FTA) diagrams.
"Fault tree analysis (FTA) is a top down, deductive failure analysis in which an undesired state of a system is analyzed using Boolean logic to combine a series of lower-level events. This analysis method is mainly used in the fields of safety engineering and reliability engineering to understand how systems can fail, to identify the best ways to reduce risk or to determine (or get a feeling for) event rates of a safety accident or a particular system level (functional) failure. FTA is used in the aerospace, nuclear power, chemical and process, pharmaceutical, petrochemical and other high-hazard industries; but is also used in fields as diverse as risk factor identification relating to social service system failure.
In aerospace, the more general term "system Failure Condition" is used for the "undesired state" / Top event of the fault tree. These conditions are classified by the severity of their effects. The most severe conditions require the most extensive fault tree analysis. These "system Failure Conditions" and their classification are often previously determined in the functional Hazard analysis." [Fault tree analysis. Wikipedia]
The shapes example "Fault tree analysis diagrams" was created using the ConceptDraw PRO diagramming and vector drawing software extended with the Fault Tree Analysis Diagrams solution from the Engineering area of ConceptDraw Solution Park.
FTA diagram symbols

Fault Tree Analysis Software

HelpDesk
How to Create a Fault Tree Analysis Diagram (FTD) in ConceptDraw PRO

Cross-Functional Flowchart


Process Flowchart


 ConceptDraw Solution Park
ConceptDraw Solution Park collects graphic extensions, examples and learning materials
 Cafe and Restaurant Floor Plans
Restaurants and cafes are popular places for recreation, relaxation, and are the scene for many impressions and memories, so their construction and design requires special attention. Restaurants must to be projected and constructed to be comfortable and e
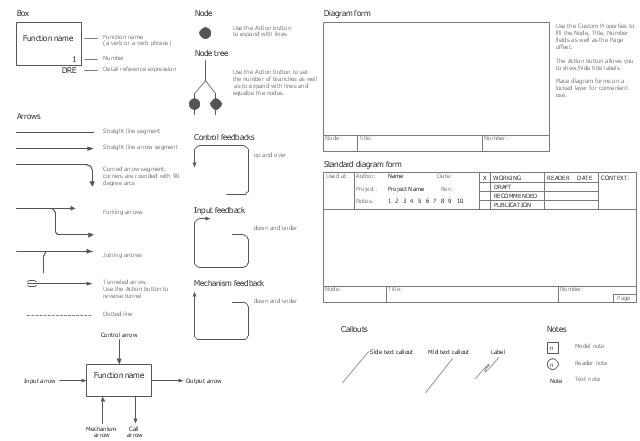
The vector stencils library "IDEF0" contains 26 IDEF0 diagram symbols.
Use it for business process modeling with IDEF0 diagrams.
"The IDEF0 model ... is based on a simple syntax. Each activity is described by a verb-based label placed in a box. Inputs are shown as arrows entering the left side of the activity box while output are shown as exiting arrows on the right side of the box. Controls are displayed as arrows entering the top of the box and mechanisms are displayed as arrows entering from the bottom of the box. Inputs, Controls, Outputs, and Mechanisms are all referred to as concepts.
- Arrow: A directed line, composed of one or more arrow segments, that models an open channel or conduit conveying data or objects from source (no arrowhead) to use (with arrowhead). There are 4 arrow classes: Input Arrow, Output Arrow, Control Arrow, and Mechanism Arrow (includes Call Arrow). See Arrow Segment, Boundary Arrow, Internal Arrow.
- Box: A rectangle, containing a name and number, used to represent a function.
- Context: The immediate environment in which a function (or set of functions on a diagram) operates.
- Decomposition: The partitioning of a modeled function into its component functions.
- Fork: The junction at which an IDEF0 arrow segment (going from source to use) divides into two or more arrow segments. May denote unbundling of meaning.
- Function: An activity, process, or transformation (modeled by an IDEF0 box) identified by a verb or verb phrase that describes what must be accomplished.
- Join: The junction at which an IDEF0 arrow segment (going from source to use) merges with one or more other arrow segments to form a single arrow segment. May denote bundling of arrow segment meanings.
- Node: A box from which child boxes originate; a parent box. See Node Index, Node Tree, Node Number, Node Reference, Diagram Node Number." [IDEF0. Wikipedia]
The shapes example "Design elements - IDEF0" was created using the ConceptDraw PRO diagramming and vector drawing software extended with the solution "IDEF Business Process Diagrams" from the area "Business Processes" of ConceptDraw Solution Park.
IDEF0 diagram symbols
 Biology
Biology solution extends ConceptDraw PRO software with samples, templates and libraries containing biological vector symbols, to help you create scientific and educational designs in the field of biology.
How To Create Restaurant Floor Plan in Minutes


Electrical Diagram Software


 Pyramid Diagrams
Pyramid Diagrams solution extends ConceptDraw PRO software with templates, samples and library of vector stencils for drawing the marketing pyramid diagrams.
- FTA diagram - Hazard analysis | Design elements - Fault tree ...
- Fault Tree Analysis Diagrams
- The Trees Are Down Analysis
- Fault Tree Diagram Software
- Design elements - Fault tree analysis diagrams | Fault Tree Analysis ...
- Audit failure - Fault tree analysis diagram | Design elements - Fault ...
- What Is Tree Diagram In System Analysis And Design
- Fault Tree Analysis Software | Design elements - Fault tree analysis ...
- Safety Fault Tree Analysis Example
- Fault Tree Analysis Diagrams | Design elements - Fault tree analysis ...
- Accident analytic tree - FTA diagram | Design elements - Fault tree ...
- Fault Tree Analysis Software
- Engineering Fields Tree Diagram
- Design elements - Vessels | Design elements - Fault tree analysis ...
- Design elements - Fault tree analysis diagrams | Types of Welding in ...
- Design elements - Fault tree analysis diagrams | How to Create a ...
- Design elements - Fault tree analysis diagrams | Audit failure - Fault ...
- Fault Tree Analysis Diagrams | Root cause analysis tree diagram ...
- Fault Tree Analysis Software | Accident analytic tree - FTA diagram ...
- Fault Tree Analysis Examples