HelpDesk
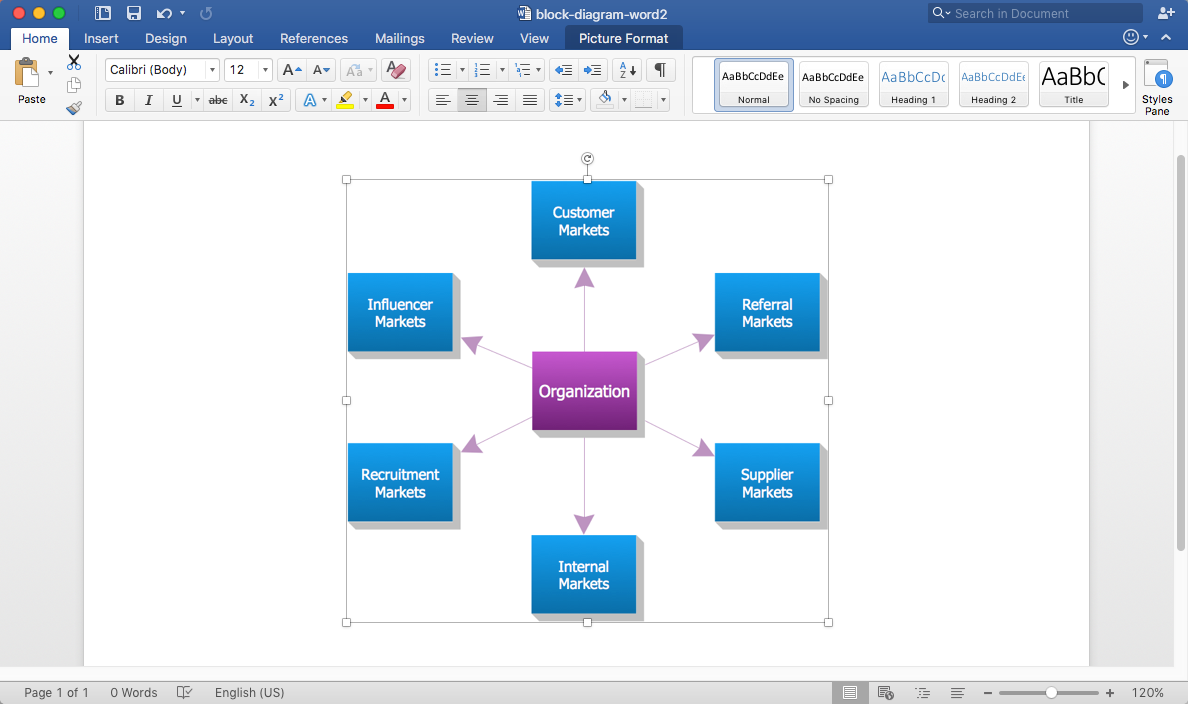
How to Add a Block Diagram to an MS Word ™ Document
Block diagram consists of graphic blocks. Blocks are connected by lines or arrows. Block diagrams are used to show the relationship between parts of some systems. It can be used for the development of new systems or to improve existing ones. The structure of the block diagram gives a high-level overview of the major components of the system, as well as the important relationships. Using the block diagrams, you can more effectively present the business data contained in your MS Word documents. ConceptDraw DIAGRAM allows you to easily create block diagrams and then insert them into an MS Word document.HelpDesk
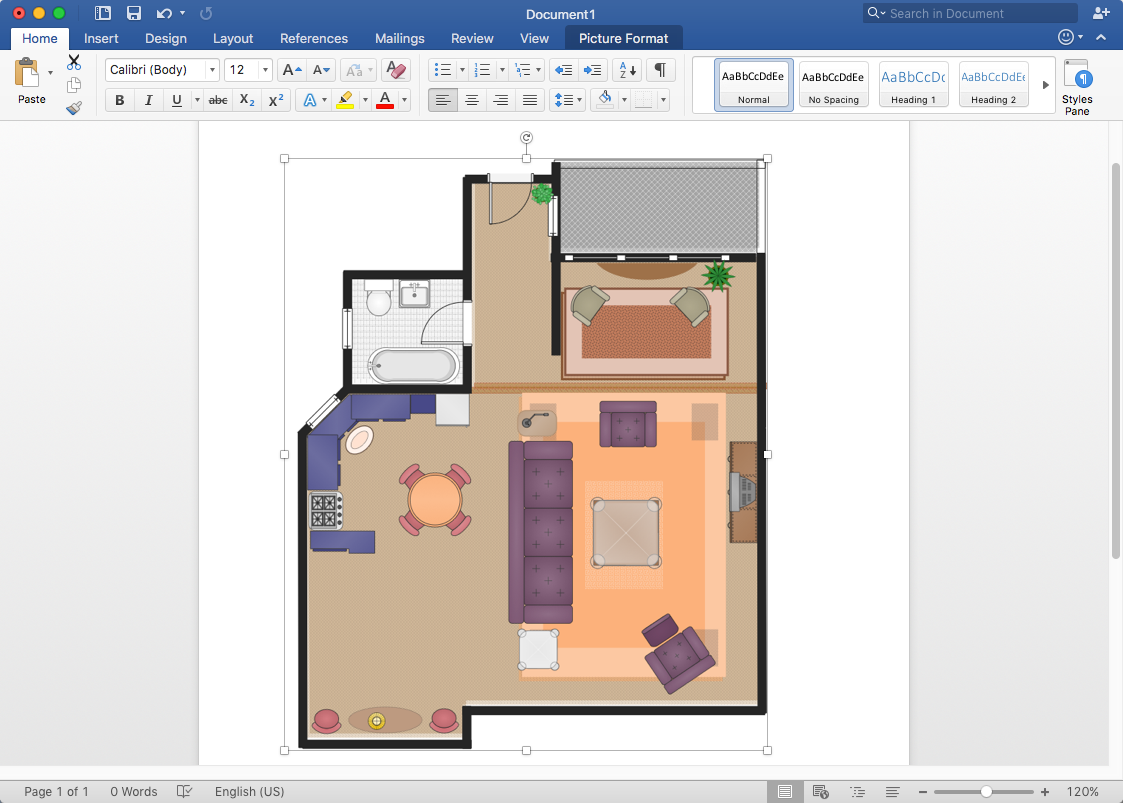
How to Add a Floor Plan to MS Word Document
ConceptDraw DIAGRAM allows you to easily create floor plans of any complexity and then insert them into an MS Word document.How to Make SWOT Analysis in a Word Document
A SWOT Analysis is a popular tool of the strategic planning which is used to evaluate the Strengths, Weaknesses, Opportunities, and Threats that are involved in any businesses. Use of mind maps allows you to collect a lot of information used for SWOT Analysis, visually structure it and also identify the relationships between different parts of this information. SWOT and TOWS Matrix Diagrams solution for ConceptDraw Solution Park combines professional visual advantages of ConceptDraw MINDMAP software and presentation capabilities of ConceptDraw DIAGRAM , which together provide a complete work solution. The SWOT and TOWS diagrams, matrices or mind maps produced in ConceptDraw DIAGRAM using the predesigned vector objects or filling the ready templates, can be then easily exported to Microsoft Word, Microsoft Visio, Microsoft PowerPoint, Adobe PDF, and many other electronic file formats. The possibility of export makes easy the use of SWOT diagrams designed in ConceptDraw DIAGRAM and lets you efficiently collaborate even with people who maybe don't have this software.HelpDesk
How to Create a Timeline Diagram
A Timeline is a chart which displays a project plan schedule in chronological order. A Timeline is used in project management to depict project milestones and visualize project phases and show project progress. The graphic form of a timeline makes it easy to understand critical project milestones, such as the progress of a project schedule. Timelines are particularly useful for project scheduling or project management when accompanied with a Gantt chart. It captures the main of what the project will accomplish and how it will be done. making a project timeline is one of the most important skills a project manager needs have. Making comprehensive, accurate timelines allows you getting every project off in the best way. ConceptDraw DIAGRAM allows you to draw a timeline chart using a special library.
 AWS Architecture Diagrams
AWS Architecture Diagrams with powerful drawing tools and numerous predesigned Amazon icons and AWS simple icons is the best for creation the AWS Architecture Diagrams, describing the use of Amazon Web Services or Amazon Cloud Services, their application for development and implementation the systems running on the AWS infrastructure. The multifarious samples give you the good understanding of AWS platform, its structure, services, resources and features, wide opportunities, advantages and benefits from their use; solution’s templates are essential and helpful when designing, description and implementing the AWS infrastructure-based systems. Use them in technical documentation, advertising and marketing materials, in specifications, presentation slides, whitepapers, datasheets, posters, etc.
 Cross-Functional Flowcharts
Cross-functional flowcharts are powerful and useful tool for visualizing and analyzing complex business processes which requires involvement of multiple people, teams or even departments. They let clearly represent a sequence of the process steps, the order of operations, relationships between processes and responsible functional units (such as departments or positions).
 Cafe and Restaurant Floor Plans
Restaurants and cafes are popular places for recreation, relaxation, and are the scene for many impressions and memories, so their construction and design requires special attention. Restaurants must to be projected and constructed to be comfortable and e
- TOWS analysis matrix template | How to Make SWOT Analysis in a ...
- SWOT Analysis | TOWS analysis matrix template | Marketing | Swot ...
- How to Make SWOT Analysis in a Word Document | SWOT Analysis ...
- SWOT Analysis | How to Make SWOT Analysis in a Word Document ...
- How to Make SWOT Analysis in a Word Document | Marketing ...
- Export Company Swot Template
- Swot Chart Template Word
- How to Make SWOT Analysis in a Word Document | SWOT Analysis ...
- How to Make SWOT Analysis in a Word Document | SWOT Analysis ...
- How to Make SWOT Analysis in a Word Document | SWOT analysis ...
- How to Make SWOT Analysis in a Word Document | SWOT analysis ...
- How to Make SWOT Analysis in a Word Document | How to Make ...
- SWOT analysis matrix diagram templates | SWOT Analysis | SWOT ...
- Personal Swot Analysis Template
- Ansoff's product / market matrix | How to Make an Ansoff Matrix ...
- Swot Template Powerpoint For Mac
- SWOT Analysis Solution - Strategy Tools | SWOT Analysis | SWOT ...
- New business opportunity SWOT analysis matrix - Template portrait ...
- Mind Maps for Business - SWOT Analysis | How to Create a ...
- Small business consultancy SWOT analysis matrix | SWOT analysis ...


