TQM Diagram Example
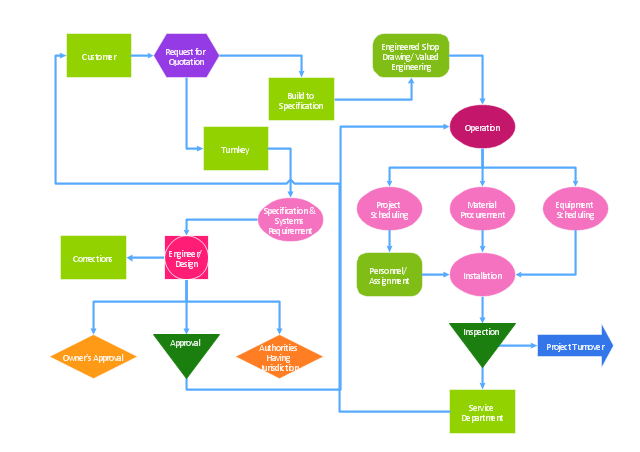
The Total Quality Management Diagram solution helps you and your organization visualize business and industrial processes. Create Total Quality Management diagrams for business process with ConceptDraw software."The Process Flow Chart provides a visual representation of the steps in a process. ...
When to Use:
One of the first activities of a process improvement effort is constructing a flowchart. It provides the following benefits:
1- It give you and everyone a clear understanding of the process.
2- Facilitates teamwork and communication.
3- Helps to identify non-value-added operations."
[bexcellence.org/ Flow-Chart.html]
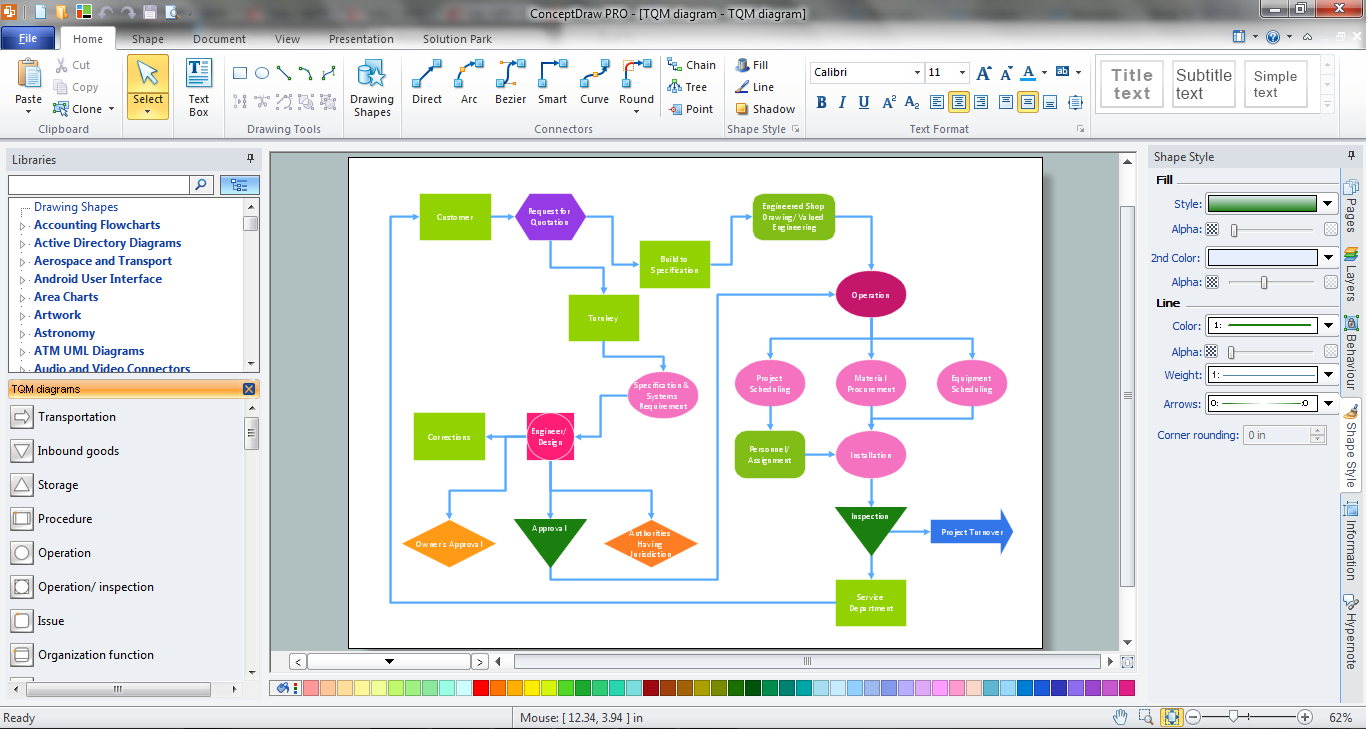
This TQM diagram example shows a business process that can be then analyzed to improve the effectiveness and diagnose quality issues that require resolution.
This example was created using the ConceptDraw PRO diagramming and vector drawing software extended with the Total Quality Management (TQM) Diagrams solution from the Quality area of ConceptDraw Solution Park.
Organizational Structure Total Quality Management
The Total Quality Management Diagram solution helps you and your organization visualize business and industrial processes. Create Total Quality Management diagrams for business process with ConceptDraw software.
 Total Quality Management TQM Diagrams
Total Quality Management Diagrams solution extends ConceptDraw PRO software with samples, templates and vector stencils library for drawing the TQM flowcharts.
TQM Diagram — Professional Total Quality Management
The Total Quality Management Diagram solution helps you and your organization visualize business and industrial processes. Create Total Quality Management diagrams for business process with ConceptDraw software.TQM Software — Build Professional TQM Diagrams
The Total Quality Management Diagram solution helps you and your organization visualize business and industrial processes. Create Total Quality Management diagrams for business process with ConceptDraw software.Quality Management Tools
ConceptDraw PRO diagramming and vector drawing software offers at your disposal quality management tools of the Total Quality Management (TQM) Diagrams solution from the Quality area of ConceptDraw Solution Park which will help facilitate a drawing diagrams process for quality management.Total Quality Management
ConceptDraw PRO diagramming and vector drawing software extended with Total Quality Management (TQM) Diagrams solution from the Quality area of ConceptDraw Solution Park is effective software for Total Quality Management.TQM Tools
ConceptDraw PRO diagramming and vector drawing software enhanced with Total Quality Management (TQM) Diagrams solution from the Quality area of ConceptDraw Solution Park is rich for the useful and effective TQM tools.TQM Software
ConceptDraw PRO diagramming and vector drawing software extended with Total Quality Management (TQM) Diagrams solution from the Quality area of ConceptDraw Solution Park is a powerful TQM software.Definition TQM Diagram
The Total Quality Management Diagram solution helps your organization visualize business and industrial processes. Create Total Quality Management diagrams for business process with ConceptDraw software.Quality Control Chart Software — ISO Flowcharting
Quality Control Chart Software (ISO Flowcharting) - ConceptDraw PRO extended with Total Quality Management TQM Diagrams Solution from the Quality Area is the best diagramming and vector drawing software that allows you to draw the quality control charts quick and easy.The quality control chart is a graphic that illustrates the accordance of processes or products to the intended specifications and degree of differences from them. Depending on what type of data you need analyze, there are used different types of quality control charts: X-bar charts, S charts, Np charts.
Fishbone Diagram Example
Fishbone Diagram, also referred as Cause and Effect diagram or Ishikawa diagram, is a fault finding and problem solving tool. Construction of Ishikawa diagrams is quite complicated process and has a number of features.Fishbone Diagrams solution included to ConceptDraw Solution Park contains powerful drawing tools and a lot of examples, samples and templates. Each Fishbone diagram example is carefully thought-out by experts and is perfect source of inspiration for you.
Quality Management System
ConceptDraw PRO diagramming and vector drawing software extended with Total Quality Management (TQM) Diagrams solution from the Quality area of ConceptDraw Solution Park perfectly suits for development and visually representing a Quality Management System.Total Quality Management Definition
The Total Quality Management Diagram solution helps you and your organization visualize business and industrial processes. Create Total Quality Management diagrams for business process with ConceptDraw software.- TQM Diagram Example | Probability Quality Control Tools | TQM ...
- Cross-Functional Flowcharts | Fishbone Diagram | TQM Diagram ...
- Total Quality Management Value | TQM Diagram Example | Process ...
- TQM Diagram Example | Organizational Structure Total Quality ...
- TQM Diagram Example | Total Quality Management TQM Diagrams ...
- Total Quality Management Definition | TQM Diagram Example ...
- TQM Diagram Example | TQM Diagram — Professional Total Quality ...
- TQM Diagram Example | How to Create a SIPOC Diagram Using ...
- Total Quality Management TQM Diagrams | TQM Diagram Example ...
- TQM Diagram Example
- TQM Diagram Example | Flow chart Example . Warehouse Flowchart ...
- Design elements - TQM diagram | TQM diagram example | Total ...
- Examples Of Relation Diagram Of Tqm
- Flowchart Software | TQM Diagram Example | Basic Flowchart ...
- TQM Software — Build Professional TQM Diagrams | TQM Diagram ...
- TQM Diagram Example | Types of Flowchart - Overview | Total ...
- Process Flowchart | TQM Diagram Example | Total Quality ...
- Process Flowchart | TQM Diagram Tool | TQM Diagram Example ...
- Process Flowchart | Quality Improvement | TQM Diagram Example ...
- TQM Diagram Example | TQM Diagram — Professional Total Quality ...


-Diagram-in-SolutionBrowser.png)


