HelpDesk
How to Save a Drawing as a Graphic File in ConceptDraw PRO
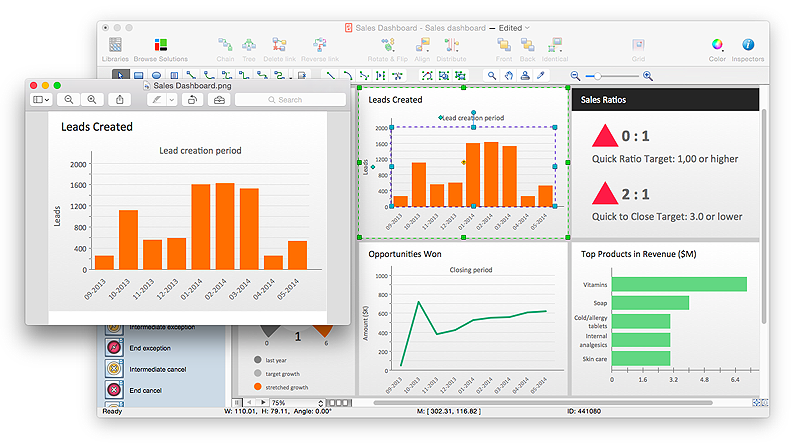
ConceptDraw PRO can save your drawings and diagrams in a number of highly useful formats, including graphic files. You can save your drawing as a .PNG, .JPG, or other graphic format file.
 ConceptDraw Solution Park
ConceptDraw Solution Park collects graphic extensions, examples and learning materials
HelpDesk
How to Connect an Image to a Topic in Your Mind Map
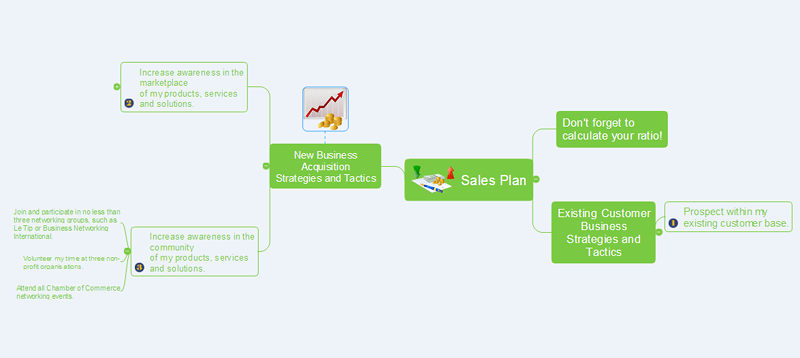
ConceptDraw MINDMAP gives a possibility to connect image to topic making your mind map more memorable and brain friendly. You can add images to any element of a map.
DroidDia PRO unlocker
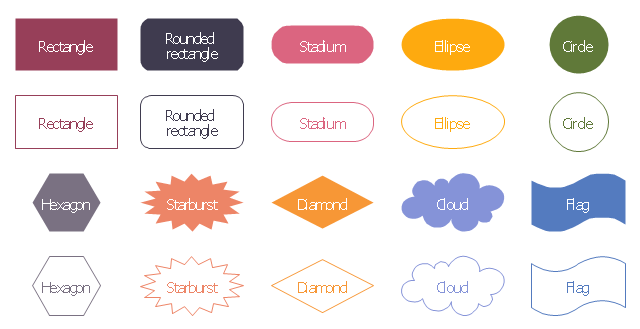
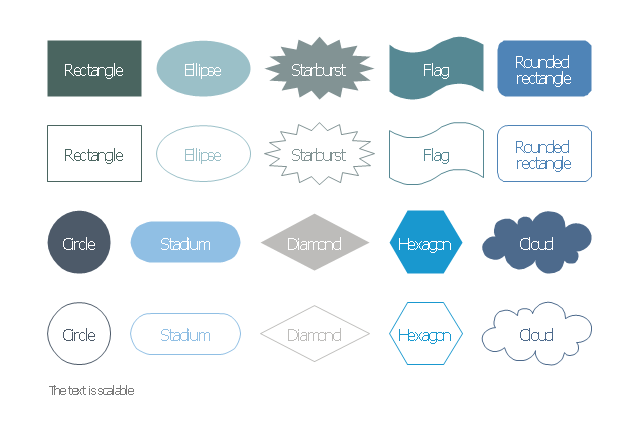
Droiddia allows you to make flow charts org charts venn diagrams mindmaps and do other diagrams with no constrains and as little effort as possible.The vector stencils library "Management diagram" contains 20 solid and transparent geometric shapes: rectangle, rounded rectangle, ellipse, cloud, circle, diamond, hexagon, starburst, flag.
Use it to illustrate your management infograms with block diagrams.
"The term diagram in its commonly used sense can have a general or specific meaning:
(1) visual information device: Like the term "illustration" the diagram is used as a collective term standing for the whole class of technical genres, including graphs, technical drawings and tables.
(2) specific kind of visual display: This is the genre that shows qualitative data with shapes that are connected by lines, arrows, or other visual links. ...
In the specific sense diagrams and charts contrast with computer graphics, technical illustrations, infographics, maps, and technical drawings, by showing "abstract rather than literal representations of information". The essence of a diagram can be seen as:
(1) a form of visual formatting devices;
(2) a display that does not show quantitative data (numerical data), but rather relationships and abstract information;
(3) with building blocks such as geometrical shapes connected by lines, arrows, or other visual links." [Diagram. Wikipedia]
The shapes example "Design elements - Management diagram" was created using the ConceptDraw PRO diagramming and vector drawing software extended with the Management Infographics solition from the area "Business Infographics" in ConceptDraw Solution Park.
DroidDia prime
Droiddia allows you to make flow charts org charts venn diagrams mindmaps and do other diagrams with no constrains and as little effort as possible.The vector stencils library "Education diagram" contains 20 solid and transparent geometric shapes: rectangle, rounded rectangle, ellipse, cloud, circle, diamond, hexagon, starburst, flag.
Use it to illustrate your education infograms with block diagrams.
"A diagram is a two-dimensional geometric (can be three-dimensional also) symbolic representation of information according to some visualization technique. They have been used since ancient times but became more prevalent during the Enlightenment. Sometimes, the technique uses a three-dimensional visualization which is then projected onto the two-dimensional surface. The word graph is sometimes used as a synonym for diagram." [Diagram. Wikipedia]
The geometric shapes example "Design elements - Education diagram" was created using the ConceptDraw PRO diagramming and vector drawing software extended with the Education Infographics solition from the area "Business Infographics" in ConceptDraw Solution Park.
 Stakeholder Onion Diagrams
The Stakeholder Onion Diagram is often used as a way to view the relationships of stakeholders to a project goal. A basic Onion Diagram contains a rich information. It shows significance of stakeholders that will have has influence to the success achieve
 Landscape & Garden
The Landscape and Gardens solution for ConceptDraw PRO v10 is the ideal drawing tool when creating landscape plans. Any gardener wondering how to design a garden can find the most effective way with Landscape and Gardens solution.
HelpDesk
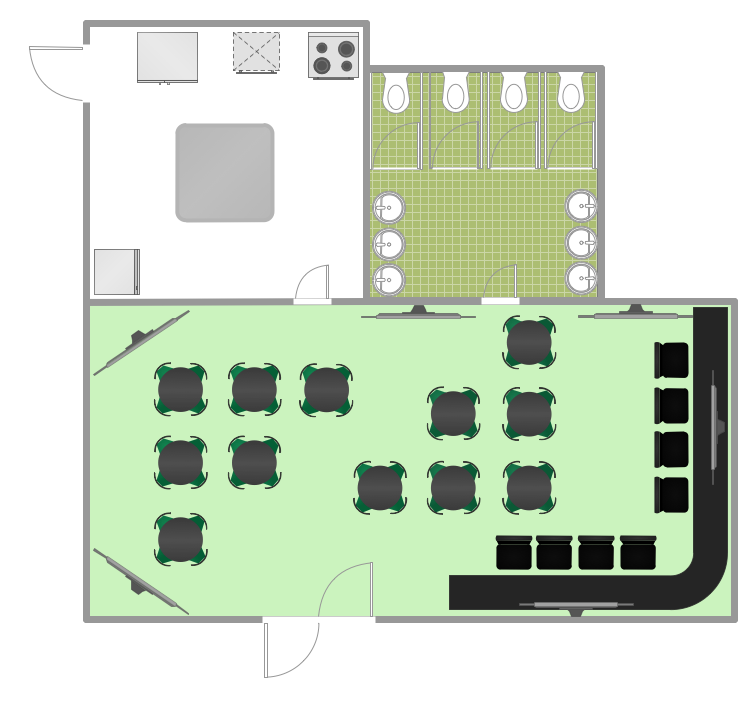
How to Design a Restaurant Floor Plan
Someone might think that creating a plan of cafe or restaurant is quite simple. But in fact it is a real art. You need to make it not only beautiful, but also convenient for visitors. Today, restaurants and cafes are not only the places, where people eat, but a places for business meetings, and recreation. Therefore, a well-designed project of the restaurant (cafe, bar) leads to successful sales and good incomes. The ConceptDraw Cafe and Restaurant Floor Plan solution includes libraries that are tailored for Cafe and Restaurants floor plans and interiors.- Half Circle Arrow Transparent
- Circular Png
- Single Arrow Vector Transparent
- Goal Png
- Circle -Spoke Diagrams | Pyramid Diagram | Line Chart Examples ...
- Basic Flowchart Symbols and Meaning | UML Activity Diagram ...
- White Arrow Png
- Process Flow Diagram Symbols | Basic Flowchart Symbols and ...
- Labels Lines Png
- Physics Diagrams | How to Draw Physics Diagrams in ConceptDraw ...
- Process Flowchart | Chemical Engineering | Crude oil distillation unit ...
- Process Vector Png
- Conceptdraw.com: Mind Map Software, Drawing Tools | Project ...
- Process Flowchart | Chemical Engineering | Building Drawing ...
- Arrow Flow Png
- Water Circle Diagram
- Time Symbols Png
- Star Constellations Png
- Title Box Vector Png
- Basic Flowchart Symbols and Meaning | Audit Flowchart Symbols ...
.jpg)
.jpg)
