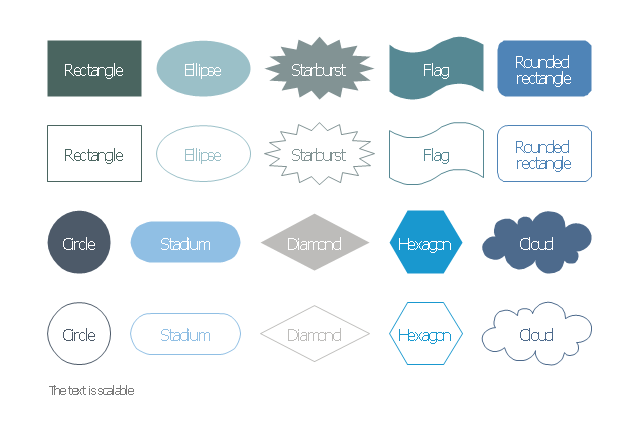
The vector stencils library "Management diagram" contains 20 solid and transparent geometric shapes: rectangle, rounded rectangle, ellipse, cloud, circle, diamond, hexagon, starburst, flag.
Use it to illustrate your management infograms with block diagrams.
"The term diagram in its commonly used sense can have a general or specific meaning:
(1) visual information device: Like the term "illustration" the diagram is used as a collective term standing for the whole class of technical genres, including graphs, technical drawings and tables.
(2) specific kind of visual display: This is the genre that shows qualitative data with shapes that are connected by lines, arrows, or other visual links. ...
In the specific sense diagrams and charts contrast with computer graphics, technical illustrations, infographics, maps, and technical drawings, by showing "abstract rather than literal representations of information". The essence of a diagram can be seen as:
(1) a form of visual formatting devices;
(2) a display that does not show quantitative data (numerical data), but rather relationships and abstract information;
(3) with building blocks such as geometrical shapes connected by lines, arrows, or other visual links." [Diagram. Wikipedia]
The shapes example "Design elements - Management diagram" was created using the ConceptDraw PRO diagramming and vector drawing software extended with the Management Infographics solition from the area "Business Infographics" in ConceptDraw Solution Park.
HelpDesk
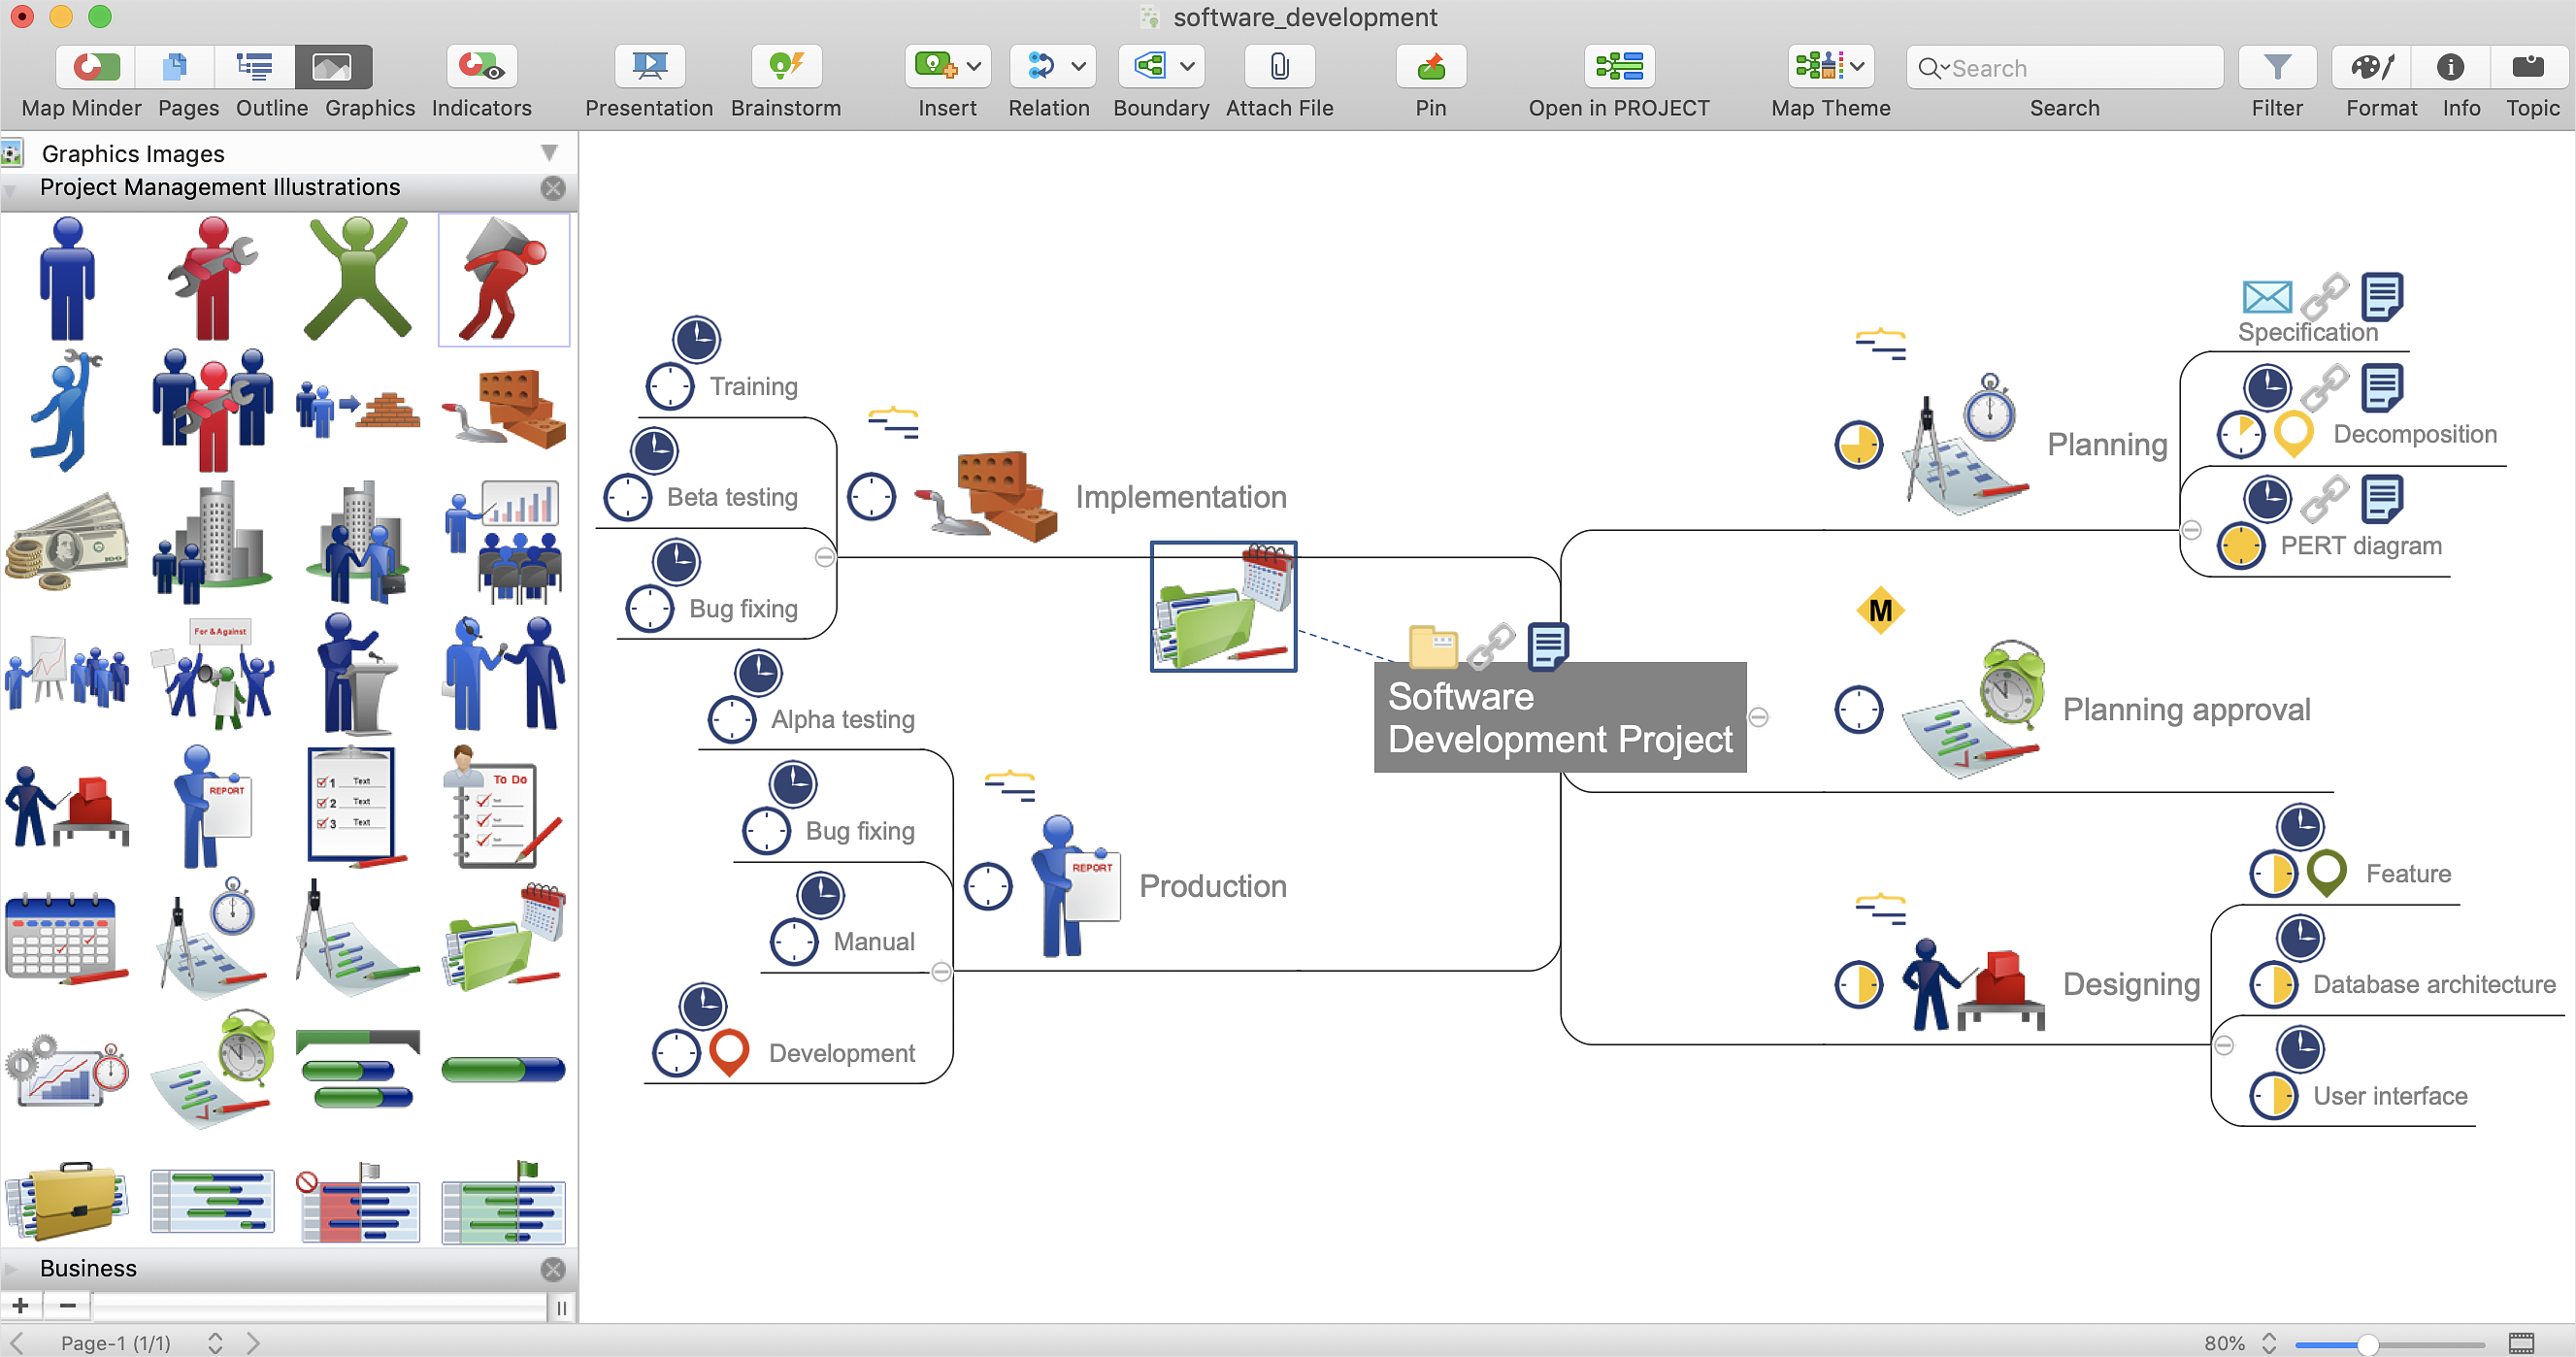
How to Connect an Image to a Topic in Your Mind Map
There is nothing easier than adding images to your mind map. Images can add creativity and functionality, and give your map a distinct style. ConceptDraw MINDMAP has a Graphics panel containing a clip art gallery so you can easily incorporate pictures into your maps making them even more memorable and intuitive. You can add images to any part of your mind map.
 ConceptDraw Solution Park
ConceptDraw Solution Park collects graphic extensions, examples and learning materials
Bubble diagrams in Landscape Design with ConceptDraw DIAGRAM
Bubble Diagrams are the charts with a bubble presentation of data with obligatory consideration of bubble's sizes. They are analogs of Mind Maps and find their application at many fields, and even in landscape design. At this case the bubbles are applied to illustrate the arrangement of different areas of future landscape design, such as lawns, flowerbeds, playgrounds, pools, recreation areas, etc. Bubble Diagram helps to see instantly the whole project, it is easy for design and quite informative, in most cases it reflects all needed information. Often Bubble Diagram is used as a draft for the future landscape project, on the first stage of its design, and in case of approval of chosen design concept is created advanced detailed landscape plan with specification of plants and used materials. Creation of Bubble Diagrams for landscape in ConceptDraw DIAGRAM software is an easy task thanks to the Bubble Diagrams solution from "Diagrams" area. You can use the ready scanned location plan as the base or create it easy using the special ConceptDraw libraries and templates.- Design elements - Transport map | Train Icon Transparent Background
- Vertical White Line Transparent Png
- Logo In Oval Transparent
- Design elements - Transparent trees | How To use Landscape ...
- Cisco Corporate Logo Transparent
- Professional Icon Transparent Background
- White Circle Png Transparent
- Transparent Circle Png
- How to Change the Form and Color of a Topic's Line in Your Mind Map
- Design elements - Transparent trees | Design elements - Bushes ...
- Mpls Lines Connection Diagram
- Symbol Email Transparent Png
- ConceptDraw PRO Compatibility with MS Visio | Value Stream ...
- Arrow Png Transparent
- Router Icon Transparent
- How to Set Line Jumps for Smart Connectors in ConceptDraw PRO ...
- Curved Png Transparent
- Template Restaurant Floor Plan for Kids | Electric Power Tower ...
- Basic Flowchart Symbols and Meaning | Audit Flowchart Symbols ...
- How to Create a Line Chart | How to Create a Column Chart ...


