How to draw Metro Map style infographics? Moscow, New York, Los Angeles, London
The solution handles designs of any complexity, and the comprehensive library covers all key aspects of a transportation system. To further enhance your map design, there is the option to embed links, that can display station images or other relevant, important information. We have also included a set of samples in the solution, that show the possible real-world application — complex tube systems including the London Tube and New York City Subway show the level of detail possible when using the Metro Map Solution.
 Metro Map
Metro Map solution extends ConceptDraw DIAGRAM software with templates, samples and library of vector stencils for drawing the metro maps, route maps, bus and other transport schemes, or design tube-style infographics.
Infographic design elements, software tools Subway and Metro style
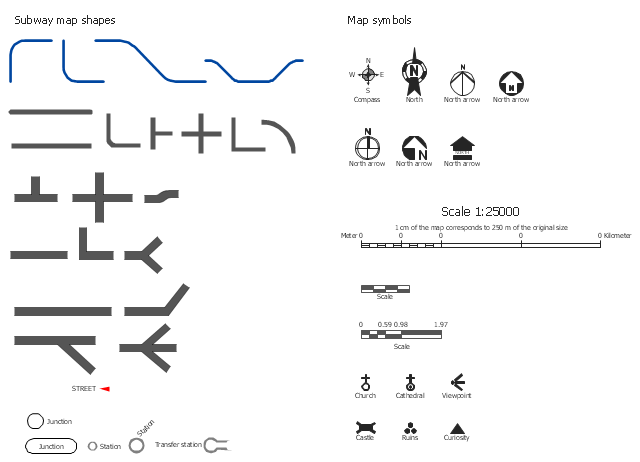
Subway infographic design elements for ConceptDraw DIAGRAM (mac and pc).The vector stencils library Map symbols contains 19 icons for labeling the maps using the ConceptDraw PRO diagramming and vector drawing software.
The vector stencils library Subway map contains 41 shapes for creating the subway (tube, metro) maps using the ConceptDraw PRO.
"The various features shown on a map are represented by conventional signs or symbols. For example, colors can be used to indicate a classification of roads. Those signs are usually explained in the margin of the map, or on a separately published characteristic sheet.
Some cartographers prefer to make the map cover practically the entire screen or sheet of paper, leaving no room "outside" the map for information about the map as a whole. These cartographers typically place such information in an otherwise "blank" region "inside" the map -- cartouche, map legend, title, compass rose, bar scale, etc. In particular, some maps contain smaller "sub-maps" in otherwise blank regions—often one at a much smaller scale showing the whole globe and where the whole map fits on that globe, and a few showing "regions of interest" at a larger scale in order to show details that wouldn't otherwise fit." [Map. Wikipedia]
The example "Design elements - Subway map, Map symbols" is included in the Directional Maps solution from the Maps area of ConceptDraw Solution Park.
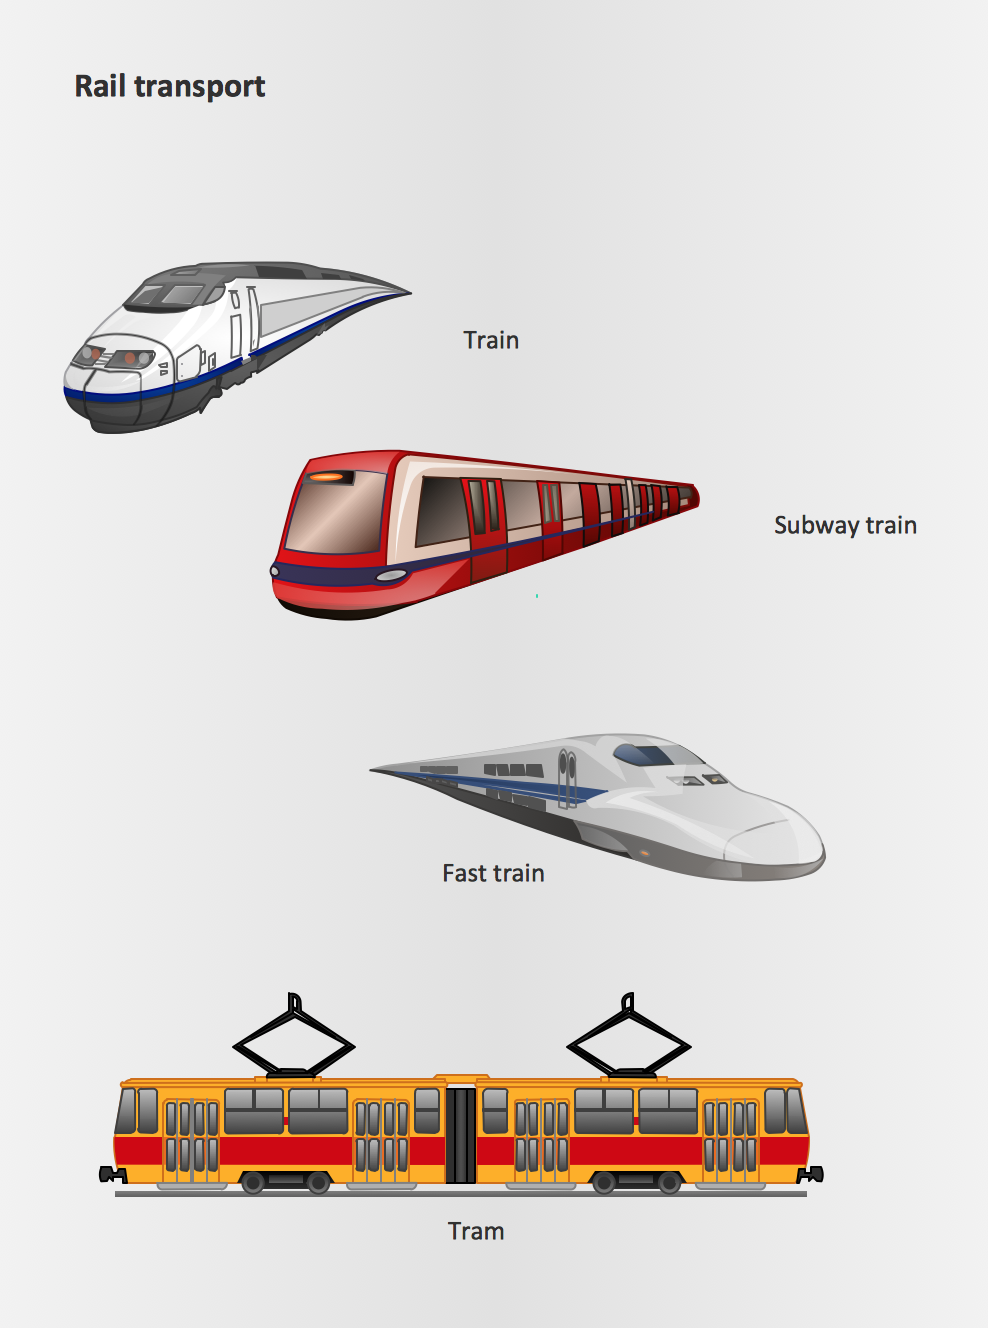
Rail transport - Design elements
The vector stencils library Rail transport contains clipart of railway transport for ConceptDraw DIAGRAM diagramming and vector drawing software. Use it to draw illustrations of trains and transportation of passengers and goods by railroads.Business Diagram Software
When managing the projects, people, or networks, there are daily designed and used different types of Business diagrams, so the powerful drawing software will be very useful for this. ConceptDraw DIAGRAM with large quantity of business solutions will meet your needs and will help you convey your ideas successful and rapidly, no matter are you professional or beginner. It is the best choice for business specialists and technical professionals who need quickly and easily explore, visualize, and communicate information. ConceptDraw DIAGRAM business diagram software is the most powerful business software and relational charting software. Create advanced, completely customizable Business Process Diagrams, Business Flow Charts, Work Flow Diagrams, Organizational Charts, Audit diagrams, Marketing diagrams, Value Stream Maps, TQM diagrams, ERD diagrams, EPC diagrams, Cause and Effect diagrams, Infographics, Dashboards, and other Relational business diagrams from your data using the powerful drawing tools of ConceptDraw Solution Park.
Examples of Flowcharts, Org Charts and More
ConceptDraw DIAGRAM covers a broad spectrum of business graphics categories and offers at ConceptDraw STORE enormous online collection of pictorial examples and samples for different thematics and application areas. It is a plentiful source of inspiration and wonderful examples of professionally designed diagrams, flowcharts, UML diagrams, organizational charts, databases, ERDs, network diagrams, business charts, different thematic charts, schematics, infographics and plans developed specially for knowledge workers, engineers, managers, businessmen, marketing specialists, analytics, scientists, students, professors, journalists and also for a large number of other people that every day use various diagrams and drawings in their work and life activity. Each of these examples is a real art, all they are well thought-out and designed without efforts with help of powerful tools of ConceptDraw DIAGRAM software. ConceptDraw examples display all variety of tasks, possibilities and results that ConceptDraw Product Line lets achieve fast and easy. ConceptDraw is one of the best Visio alternatives for Mac. It open all Visio formats like.vsdx,.vss,.vdx files and allows you to export files to Visio formats.
- How to draw Metro Map style infographics? (London) | Infographic ...
- Metro Map | Best Value Stream Mapping mac Software | Subway ...
- Building Drawing Software for Design Office Layout Plan | How To ...
- Infographic design elements, software tools Subway and Metro style ...
- Spatial infographics Design Elements: Transport Map | Maps | Metro ...
- How To Create Emergency Plans | Café Floor Plan Example ...
- How to draw Metro Map style infographics? (London)
- How to draw Metro Map style infographics? (London) | How to draw ...
- Map Infographic Creator | Map Infographic Design | Map Infographic ...
- How to draw Metro Map style infographics? (New York)
- Maps | How to draw Metro Map style infographics? (London) | How ...
- How to draw Metro Map style infographics? (New York) | How to ...
- Metro Map | How to draw Metro Map style infographics? Moscow ...
- Metro Map | How to draw Metro Map style infographics? Moscow ...
- London tube map | Design elements - Cable TV (CATV) | Transport ...
- How to draw Metro Map style infographics? (London) | Metro Map ...
- How to draw Metro Map style infographics? (London) | Value Stream ...
- How to draw Metro Map style infographics? Moscow, New York, Los ...
- Metro Map | How to draw Metro Map style infographics? Moscow ...
- Maps | Metro Map | Spatial Infographics |


