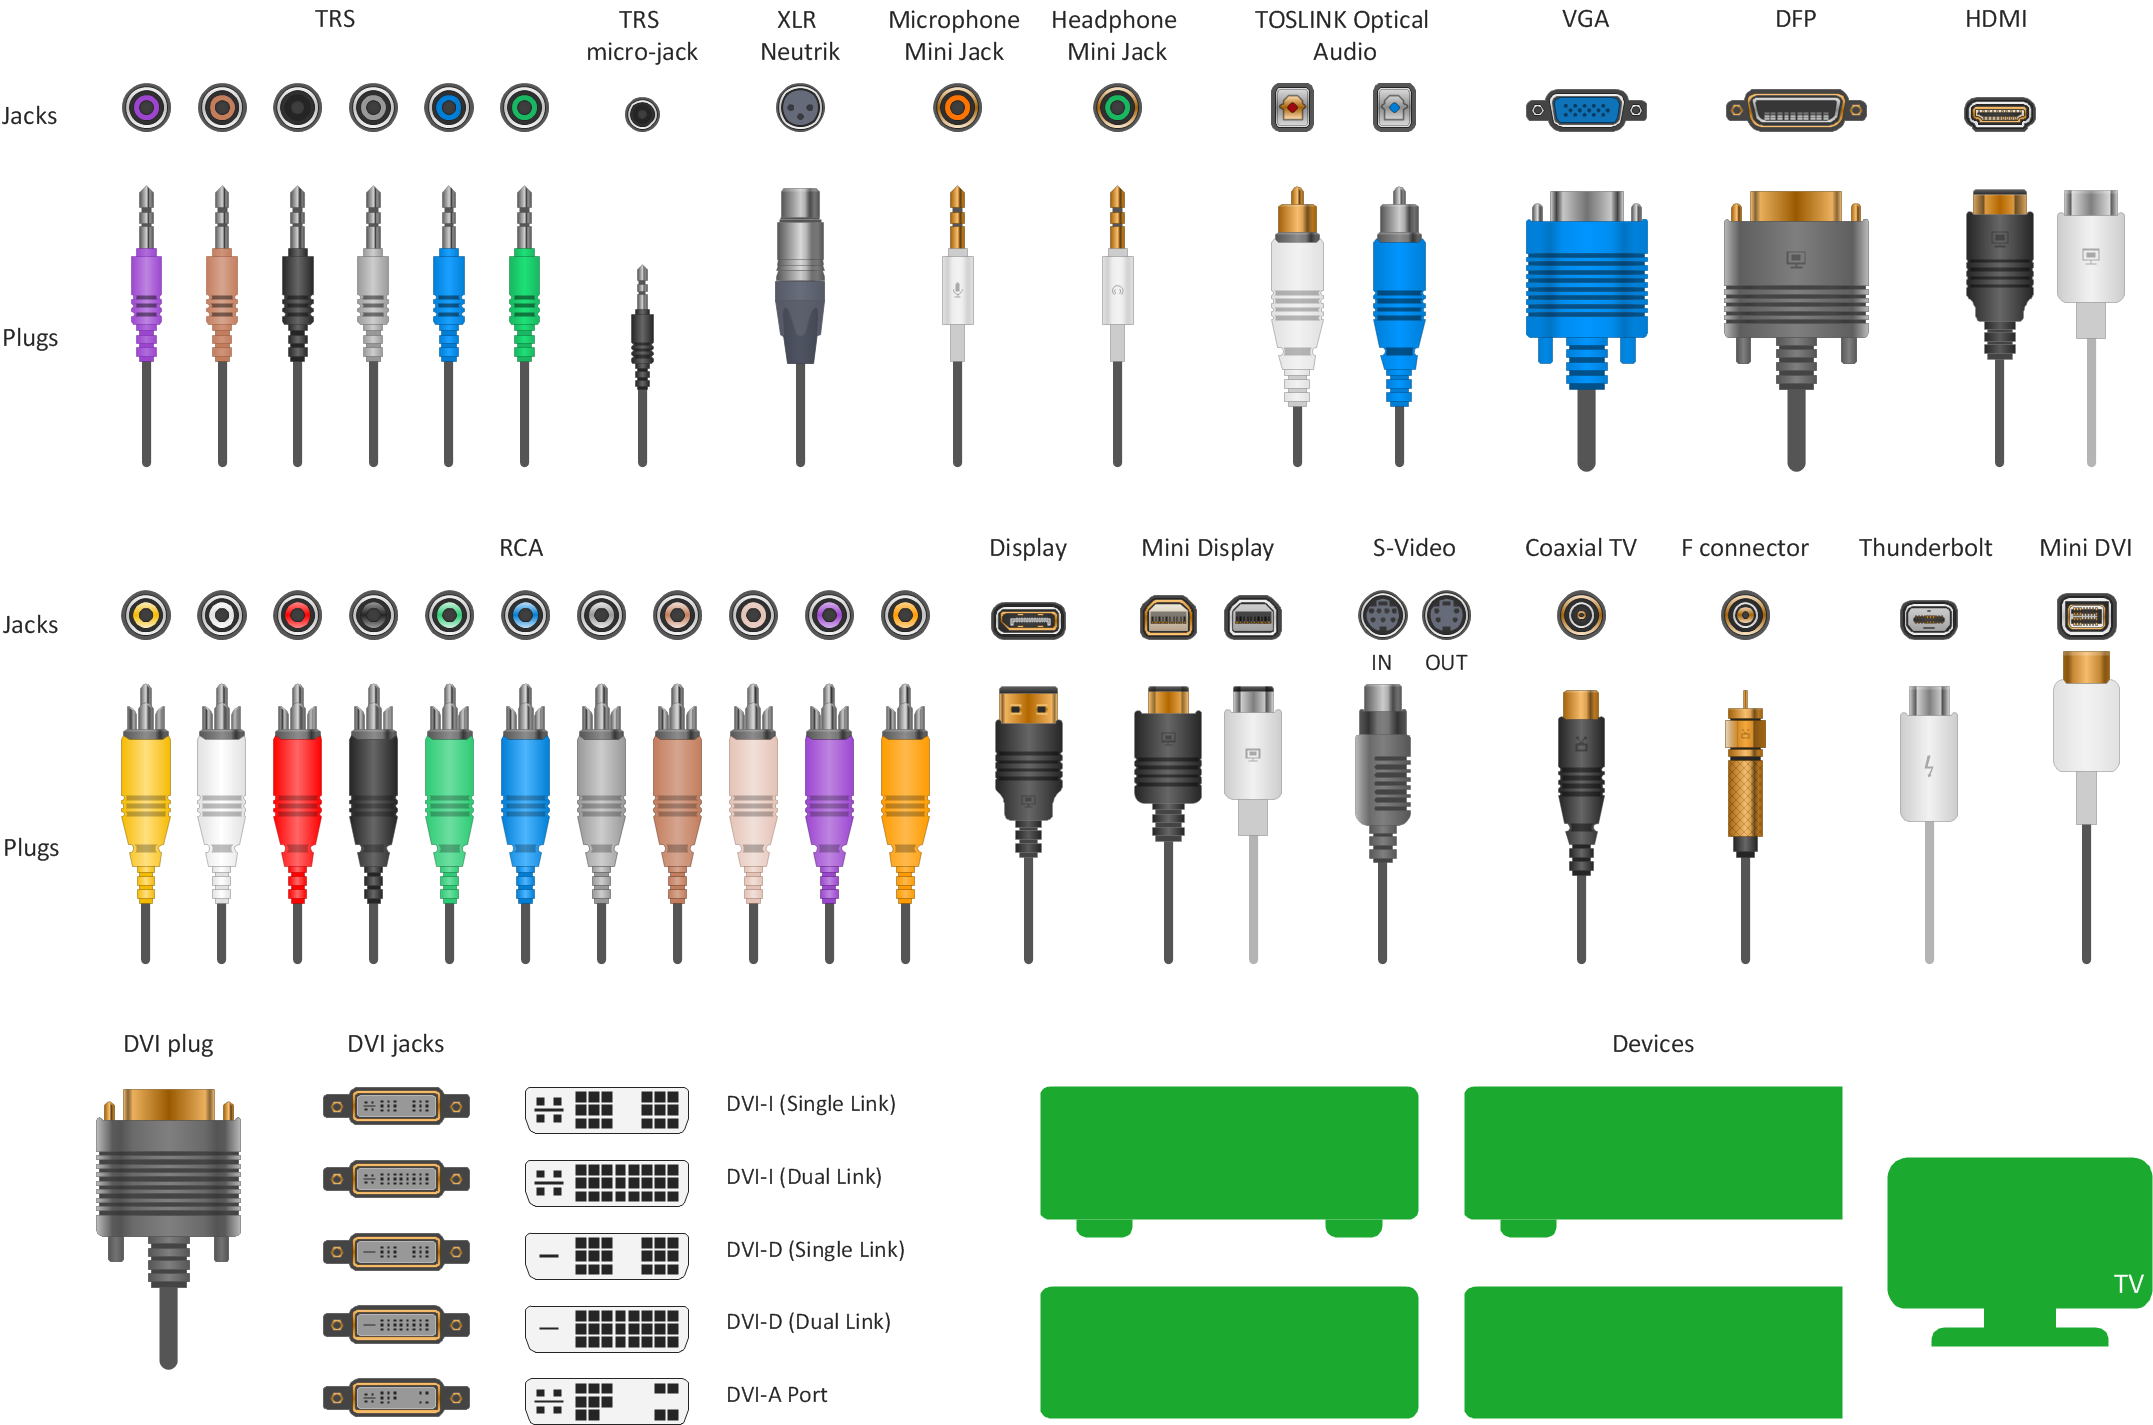
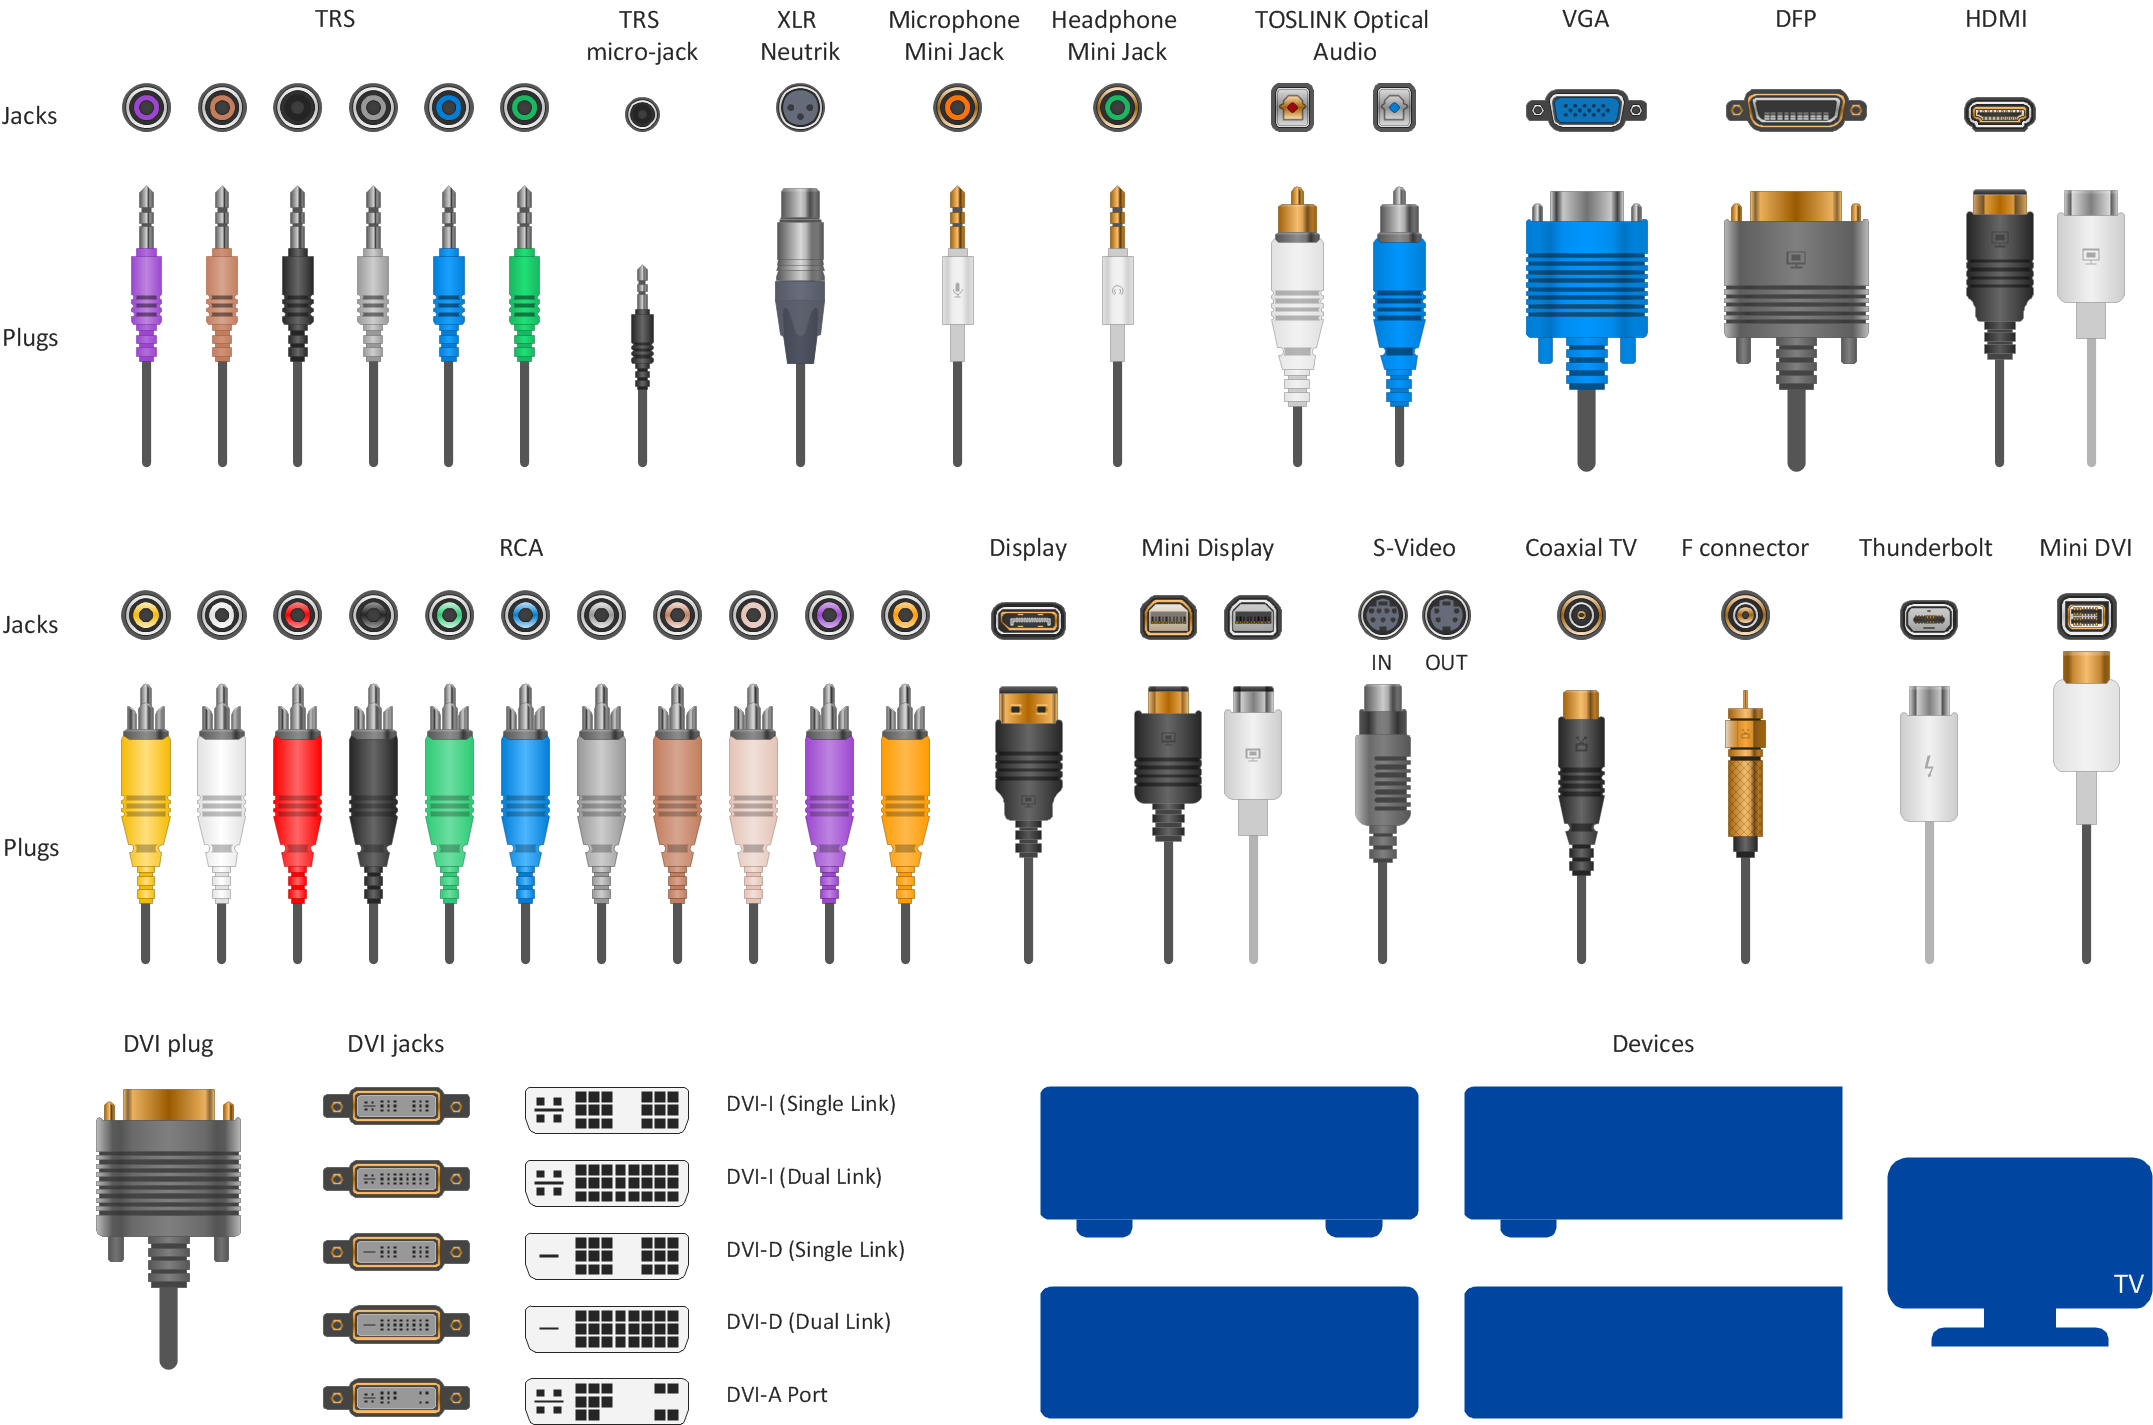
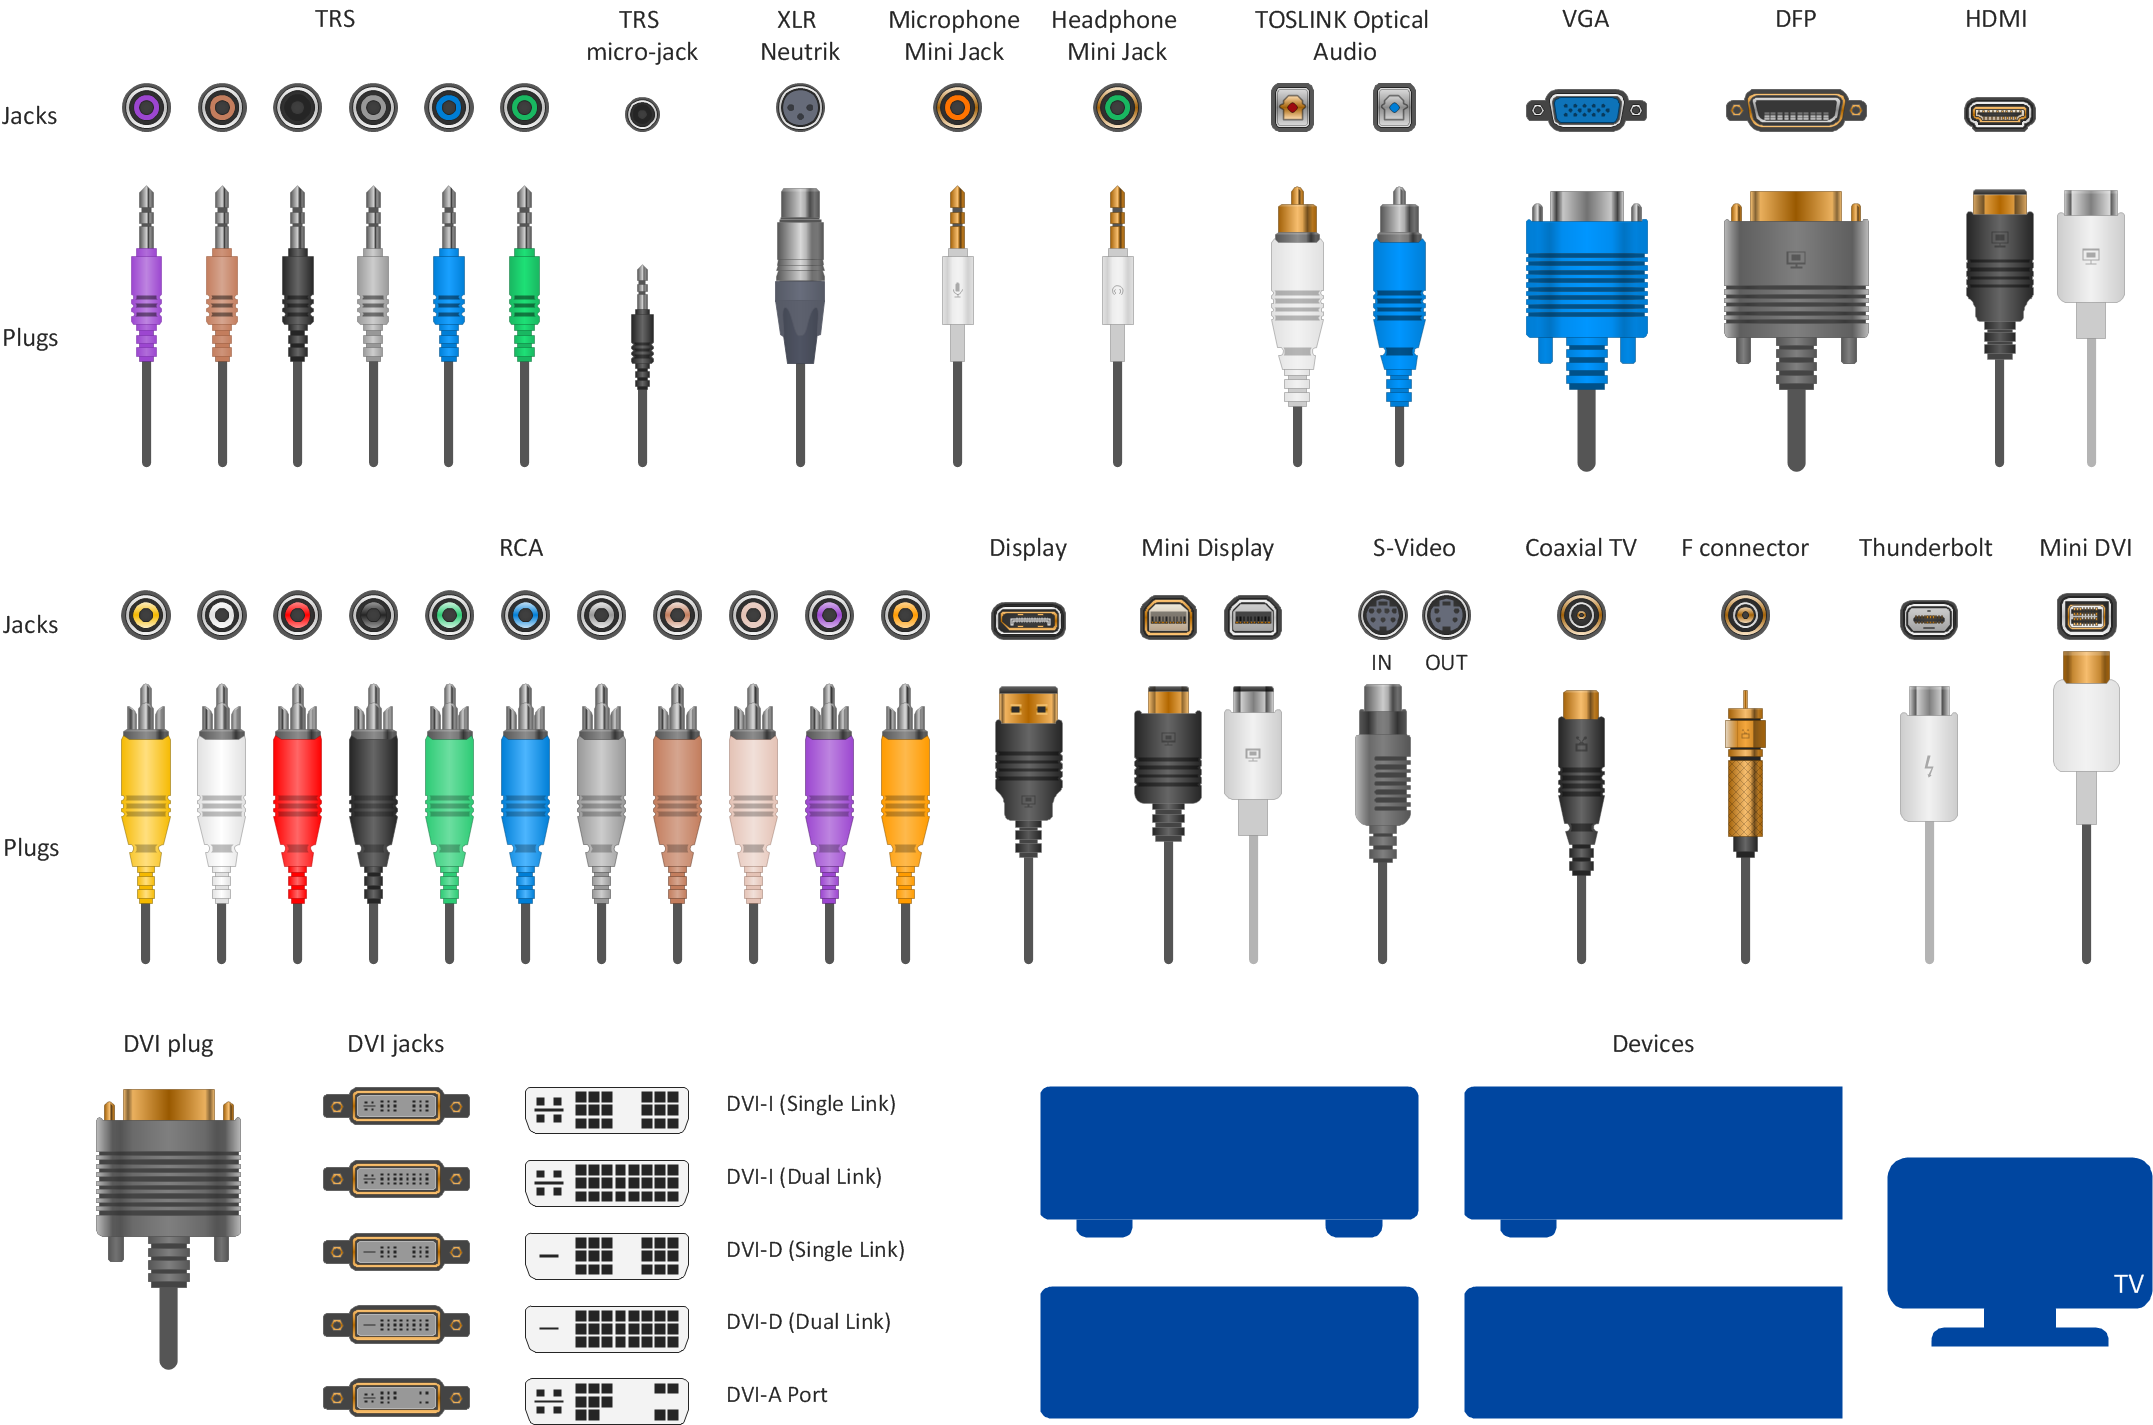
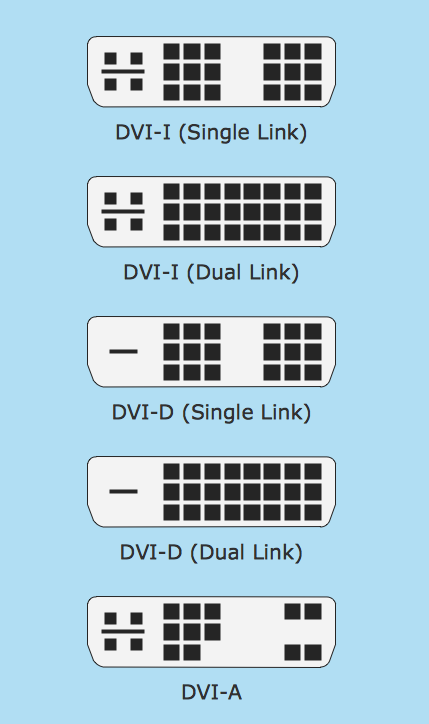
Standard Universal Audio & Video Connection Types
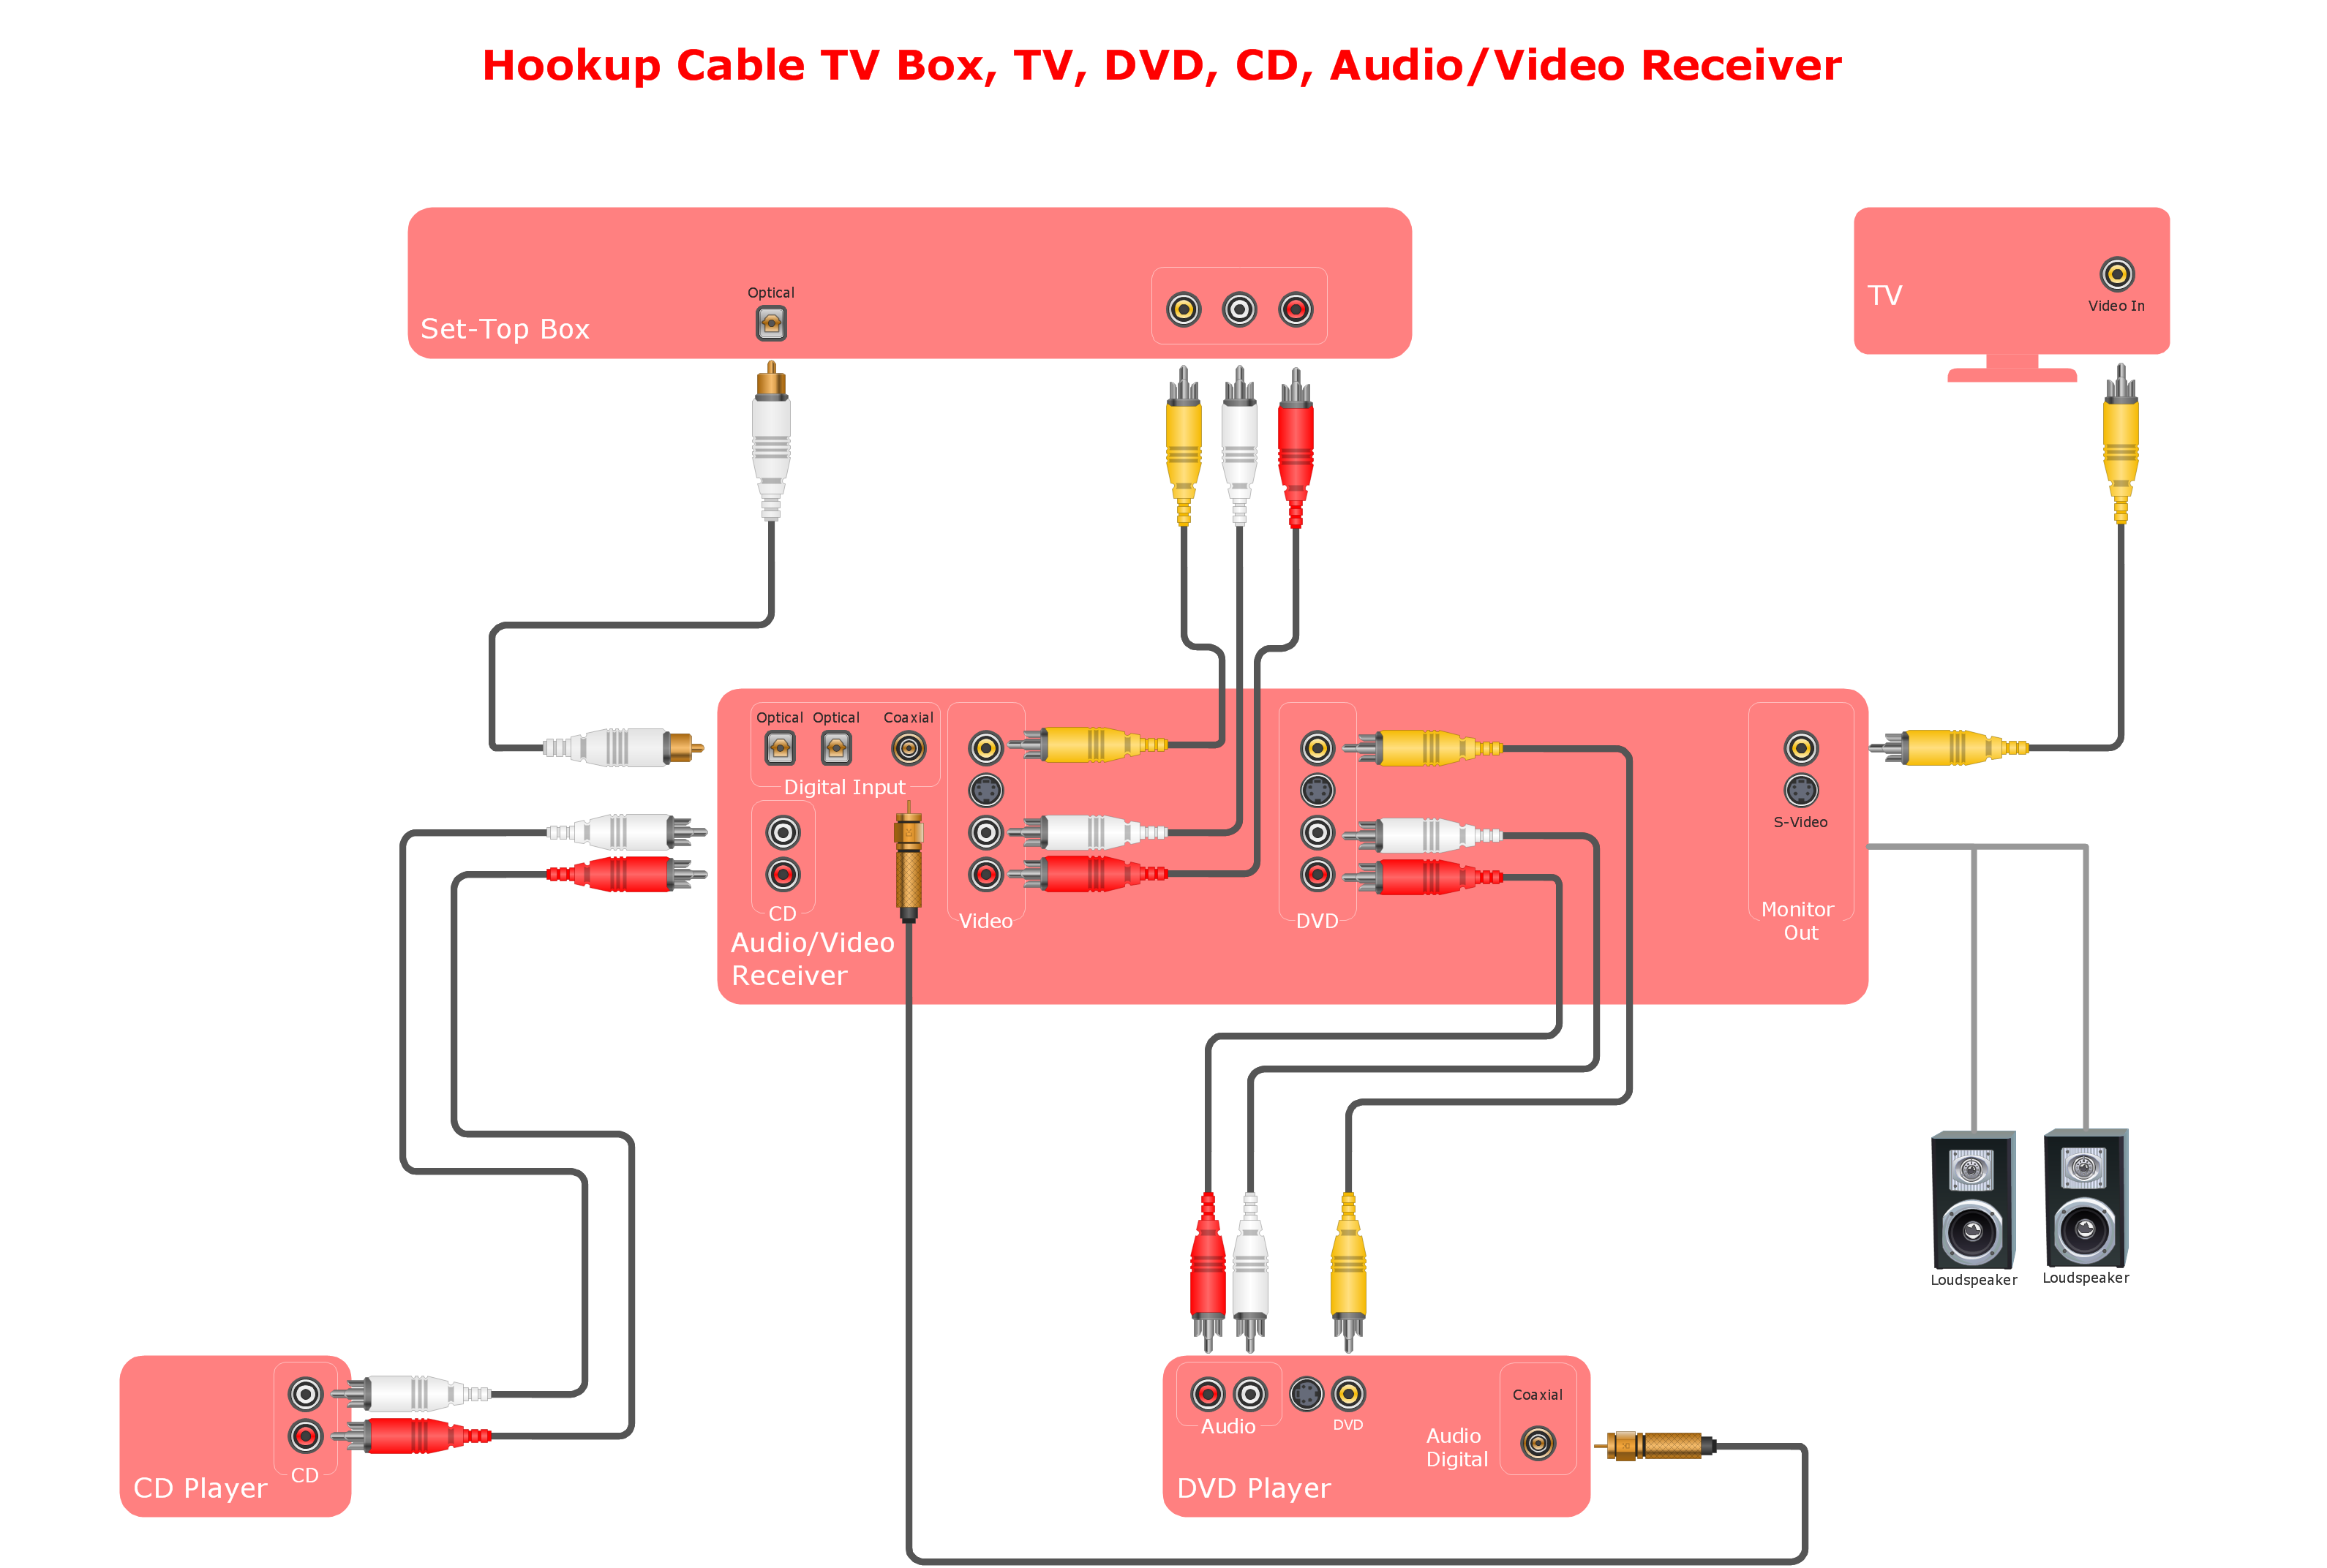
The Audio & Video Connectors solution contains a set of pre-designed objects, libraries, templates, and samples; allowing quick and easy diagramming of various configurations of audio and video devices.Audio Visual Connectors Types
The Audio & Video Connectors solution contains a set of pre-designed objects, libraries, templates, and samples; allowing quick and easy diagramming of various configurations of audio and video devices.Audio and Video Connector
The Audio & Video Connectors solution contains a set of pre-designed objects, libraries, templates, and samples; allowing quick and easy diagramming of various configurations of audio and video devices.Audio and Video Connections Explained
The Audio and Video Connectors solution contains a set of video connectors, audio connectors and s video connection; you will also find pre-designed objects, libraries, templates, and samples, allowing quick and easy diagramming of various configurations of audio and video devices.Video Connectors
Video connectors are electrical connectors (or optical connectors) which carry video signals. ConceptDraw PRO diagramming and vector drawing software supplied with Audio and Video Connectors Solution from the Industrial Engineering Area of ConceptDraw Solution Park offers powerful tools for designing configurations of video connectors for different video devices.S Video Connection
S-Video is a signaling standard for standard definition video. ConceptDraw PRO diagramming and vector drawing software extended with Audio and Video Connectors Solution from the Industrial Engineering Area can be helpful for demostrating and explaining the S Video connection which is widely used on TVs and home theater receivers.Basic Flowchart Symbols and Meaning
Flowcharts are the best for visually representation the business processes and the flow of a custom-order process through various departments within an organization. ConceptDraw PRO diagramming and vector drawing software extended with Flowcharts solution offers the full set of predesigned basic flowchart symbols which are gathered at two libraries: Flowchart and Flowcharts Rapid Draw. Among them are: process, terminator, decision, data, document, display, manual loop, and many other specific symbols. The meaning for each symbol offered by ConceptDraw gives the presentation about their proposed use in professional Flowcharts for business and technical processes, software algorithms, well-developed structures of web sites, Workflow diagrams, Process flow diagram and correlation in developing on-line instructional projects or business process system. Use of ready flow chart symbols in diagrams is incredibly useful - you need simply drag desired from the libraries to your document and arrange them in required order. There are a few serious alternatives to Visio for Mac, one of them is ConceptDraw PRO. It is one of the main contender with the most similar features and capabilities.
Calculate the cost of creating or updating a wireless computer network
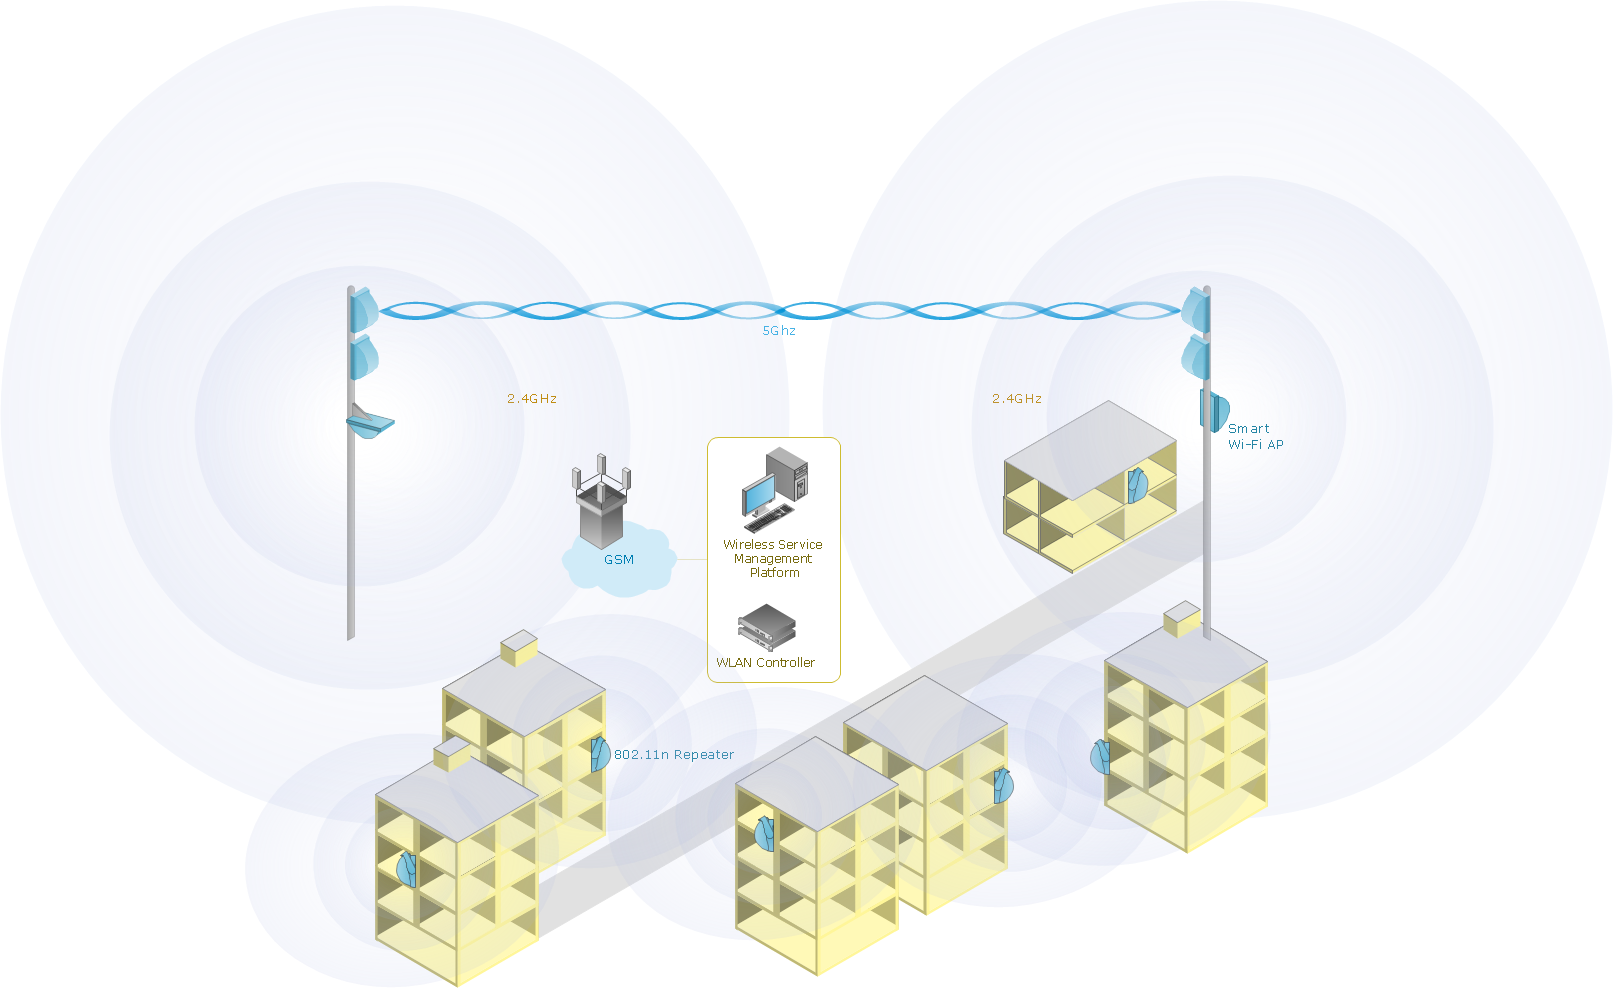
The Wireless Network solution helps users with quick transition from an idea to the implementation of a wireless computer network. ConceptDraw PRO is well placed to provide experienced and comprehensive assisitance in the workplace.Data modeling with ConceptDraw PRO
Data modelling will help you to study and analyze business processes in your organization for optimization and increase of effectiveness and production.Influence Diagram
This sample shows the Influence Diagram. It was created in ConceptDraw PRO diagramming and vector drawing software using the Basic Diagramming Solution from the Universal Diagramming area of ConceptDraw Solution Park. Influence diagram represents the directed acyclic graph with three types of nodes and three types of arcs that connect the nodes. Decision node is drawn as a rectangle, Uncertainty node is drawn as an oval, Value node is drawn as an octagon.Influence Diagram Software
Influence diagram (ID) is a graphical and mathematical representation of the decision. Influence diagrams are widely used in the decision analysis and in the game theory. They are the alternative to the decision tree. The influence diagram gives to analyst the high-level conceptual view that it can use to build the detailed quantitative model. This sample shows the Influence diagram. It is a directed acyclic graph with three types of nodes: Decision node is drawn as a rectangle, Uncertainty node is drawn as an oval, Value node is drawn as an octagon. The nodes are connected with arcs.HelpDesk
How to Create a Timeline Diagram in ConceptDraw PRO
A Timeline is a chart which displays a project plan schedule in chronological order. A Timeline is used in project management to depict project milestones and visualize project phases, and show project progress. The graphic form of a timeline makes it easy to understand critical project milestones, such as the progress of a project schedule. Timelines are particularly useful for project scheduling or project management when accompanied with a Gantt chart. It captures the main of what the project will accomplish and how it will be done. making a project timeline is one of the most important skills a project manager needs have. Making comprehensive, accurate timelines allows you getting every project off in the best way. ConceptDraw PRO allows you to draw a timeline charts using special library.- Standard Universal Audio & Video Connection Types | Audio ...
- Audio & Video Connector Types | Standard Universal Audio & Video ...
- Standard Universal Audio & Video Connection Types | S Video ...
- Standard Universal Audio & Video Connection Types
- Standard Universal Audio & Video Connection Types | Audio Visual ...
- Audio Visual Connectors Types | Standard Universal Audio & Video ...
- DVI connector types | Standard Universal Audio & Video Connection ...
- Standard Universal Audio & Video Connection Types | Audio and ...
- Standard Universal Audio & Video Connection Types | Audio ...
- Audio Visual Cables and Connectors | Standard Universal Audio ...
- S Video Connection | Standard Universal Audio & Video Connection ...
- Audio & Video Connector Types | Audio Visual Connectors Types ...
- Standard Universal Audio & Video Connection Types | Schematics ...
- Standard Universal Audio & Video Connection Types | Design ...
- Process Flowchart | Types of Flowcharts | Universal Diagramming ...
- Audio and Video Connectors | Audio Visual Connectors Types ...
- Design elements - Ports and Flows | Types of Flowcharts | Standard ...
- The Best Drawing Program for Mac | Types of Flowchart - Overview ...
- Different Types Of Audio Connectors
