"A commercial building is a building that is used for commercial use. Types can include office buildings, warehouses, or retail (i.e. convenience stores, 'big box' stores, shopping malls, etc.). In urban locations, a commercial building often combines functions, such as an office on levels 2-10, with retail on floor 1. Local authorities commonly maintain strict regulations on commercial zoning, and have the authority to designate any zoned area as such. A business must be located in a commercial area or area zoned at least partially for commerce." [Commercial building. Wikipedia]
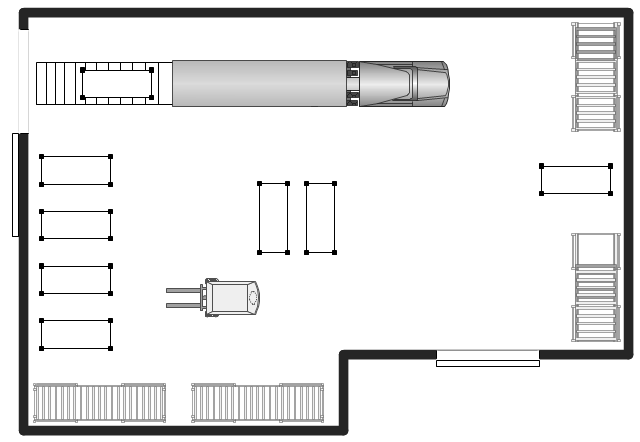
The warehouse floor plan example "Shipping, receiving and storage" was created using the ConceptDraw PRO diagramming and vector drawing software extended with the Plant Layout Plans solution from the Building Plans area of ConceptDraw Solution Park.
The warehouse floor plan example "Shipping, receiving and storage" was created using the ConceptDraw PRO diagramming and vector drawing software extended with the Plant Layout Plans solution from the Building Plans area of ConceptDraw Solution Park.
Network Diagram Software Enterprise Private Network
ConceptDraw - Perfect Network Diagramming Software with abundant examples and templates. ConceptDraw Network Diagram is ideal for network engineers and network designers who need to draw Enterprise Private Network diagrams.
 Plant Layout Plans
This solution extends ConceptDraw PRO v.9.5 plant layout software (or later) with process plant layout and piping design samples, templates and libraries of vector stencils for drawing Plant Layout plans. Use it to develop plant layouts, power plant desig
Bubble Chart
How to design a Bubble Chart? It’s very easy! All that you need is a powerful software. Never before creation of a Bubble Chart wasn’t so easy as now with tools of Bubble Diagrams Solution from the "Diagrams" Area for ConceptDraw Solution Park.UML Class Diagram Tutorial
The Rapid UML Solution from the Software Development area of ConceptDraw Solution Park helps you to create the UML Class Diagrams quick and easy using ConceptDraw PRO diagramming and vector drawing software.Examples of Flowchart
This sample shows the Flowchart of the ACC general account creation. This Flowchart describes the Start point, the process of the handling the user requests and the End point – creating of the account. The shapes represent the subprocesses and the arrows between the shapes shows the sequence of the actions. This sample was created in ConceptDraw PRO diagramming and vector drawing software using the Flowcharts solution from the "Diagrams" area of ConceptDraw Solution Park.
Flow chart Example. Warehouse Flowchart
Warehouse Flowcharts are various diagrams that describe the warehousing and inventory management processes on the warehouses. Typical purposes of Warehouse Flowcharts are evaluating warehouse performance, measuring efficiency of customer service and organizational performance. This type of Workflow diagrams can be used for identifying any disconnection between business activities and business objectives. They are effectively used by warehouse-related people and organizations, manufacturers, wholesalers, exporters, importers, transporters, and others. Standard Warehousing process flow diagram and standard Workflow diagram are used for process identification for further evaluating effectiveness and profitability of overall business process. Use the ConceptDraw PRO vector graphic software extended with Flowcharts solution to design your own professional-looking Workflow diagrams and Flowcharts of any types, including the Warehouse flowchart, Process flow diagrams which depict in details all steps of Warehouse packages flow. Microsoft Visio, designed for Windows users, can’t be opened directly on Mac. But fortunately, there are several Visio alternatives for Mac which will help Mac users to work Visio files. With ConceptDraw PRO, you may open, edit and save files in Visio format.
Selecting & Creating Flowcharts
ConceptDraw Flowcharts visualize a process or algorithm of program as step/operation blocks of various shapes connected with arrowed lines showed the process flow direction. They are used to visualize business or technical processes and software algorithms.Cross Functional Flowchart Examples
Take a look on an example of Cross-Functional-Flowchart, showing the software service cross-function process flowcharts among the different departments. It presents a simple flowchart among the customer, sales, technical support, tester and development. Try now Flowchart Software and Cross-Functional library with 2 libraries and 45 vector shapes of the Cross-Functional Flowcharts solution. Then you can use built-in templates to create and present your software service cross-function process flowcharts.How to Create Presentation of Your Project Gantt Chart
During the planning, discussing and execution of a project you may need to prepare a presentation using project views such as the Gantt Chart, Multiproject Dashboard or Resource Usage View. It’s easy do with ConceptDraw PROJECT!How to Draw Pictorial Chart. How to Use Infograms
How to draw pictorial chart quick, easy and effective? ConceptDraw PRO offers the unique Pictorial Infographics Solution that will help you! Pictorial Infographics solution contains large number of libraries with variety of predesigned vector pictograms that allows you design infographics in minutes. There are available 10 libraries with 197 vector pictograms.Planogram
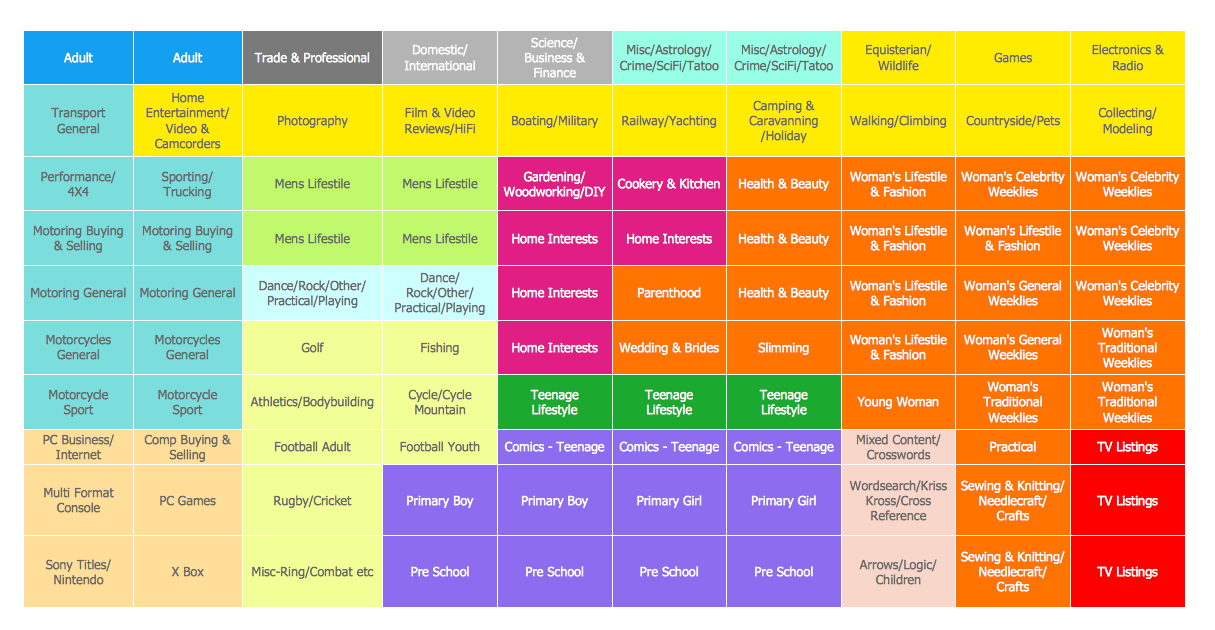
This example shows the planogram for magazines. This example was created in ConceptDraw PRO diagramming and vector drawing software using the Basic Diagramming Solution from the Universal Diagramming area of ConceptDraw Solution Park.Technical Flow Chart Example
What illustrates a technical flow chart? Technical flow chart is a diagrammatic representation which visually illustrates the sequence of operations that must to be performed to get the problem's solution. ConceptDraw PRO enhanced with Flowcharts Solution from the "Diagrams" Area of ConceptDraw Solution is a perfect software for drawing Technical Flow Chart Example illustrating the essence and importance of the technical flow chart use.Process Flow Diagram
A Process Flow Diagram (PFD) is a diagram which shows the relationships between the main components in a system. Process Flow Diagrams are widely used by engineers in chemical and process engineering, they allows to indicate the general flow of plant process streams and equipment, helps to design the petroleum refineries, petrochemical and chemical plants, natural gas processing plants, and many other industrial facilities. ConceptDraw PRO diagramming and vector drawing software extended with powerful tools of Flowcharts Solution from the "Diagrams" Area of ConceptDraw Solution Park is effective for drawing: Process Flow Diagram, Flow Process Diagram, Business Process Flow Diagrams.- Warehouse layout floor plan | Warehouse with conveyor system ...
- Type Of Warehouse Floor Plan To Prevent Dents
- What Type Of Warehouse Floor Plan Is Suitable For White Goods
- Type Of Floor Plan Suitable For The Warehouse
- Flow chart Example. Warehouse Flowchart | What Type Of Floor ...
- Warehouse Floor Plan That Has A Storage Of White Goods
- Types Of A Floor Plan Suitable For White Goods
- Floor Plan For Warehouse That Stores White Goods
- What Type Of Floor Plan Is Suitable To Prevent White Goods
- Type Of Warehouse Floor Plan
- White Goods Warehouse Floor Plan
- Plant Layout Plans | Warehouse layout floor plan | Emergency Plan ...
- What Type Of Floor Plan Is Suitable To Prevent Dents
- Types Of Warehouse Floor Plan
- Warehouse Floor Plan For White Goods
- Which Type Of Warehouse Is Suitable For Storage Of White Goods
- Flow chart Example. Warehouse Flowchart | Plant Layout Plans ...
- Which Type Of Warehouse Is Suitable For White Goods
- Business Process Flowchart Symbols | Suitable Warehouse For The ...


