Pyramid Diagram
A Venn-diagram style chart of the "project triangle" showing visually the potential overlaps between speed, quality and low cost, along with the "inability" to accomplish all three.
 Project Management Area
Project Management area provides Toolbox solutions to support solving issues related to planning, tracking, milestones, events, resource usage, and other typical project management functions.
Venn Diagram
Venn diagrams are illustrations used in the branch of mathematics known as set theory. They show the mathematical or logical relationship between different groups of things (sets). A Venn diagram shows all the possible logical relations between the sets.Radar Chart
This sample shows the Radar Chart that compares the internet dimensions in the four countries. The Radar Chart represents the multivariate data as a two-dimensional chart with three or more variables displayed on the axes that start in one point. The Radar Charts are used in the quality management, business, analytics and sport.Polar Graph
This sample shows the Polar Graph. The Polar Graph is a graph in the polar coordinate system in which the each point on the plane is defined by two values - the polar angle and the polar radius. The certain equations have very complex graphs in the Cartesian coordinates, but the application of the polar coordinate system allows usually produce the simple Polar Graphs for these equations.
 Universal Diagramming Area
This area collects solutions for drawing diagrams, charts, graphs, matrices, geographic and road maps for education, science, engineering, business.
Idea Outline
ConceptDraw MINDMAP is a powerful brainstorming software, the best application for ideas communication, for outlining ideas and data, for organizing arguments and other information. ConceptDraw MINDMAP software and solutions offered by ConceptDraw Solution Park help to hold the brainstorming session, to brainstorm a lot of new ideas, to outline your ideas, to make the Mind Map from the new ideas and concepts, to show new ideas at the presentation, efffectively communicate them and report at the meetings and conferences. The good ideas outline saves your time and helps visually explain your ideas for other people. Outline effectively your ideas using varied tools offered by ConceptDraw MINDMAP and make sure that it is very easy. The wide export capabilities of ConceptDraw MINDMAP are also helpful for ideas communication and collaboration with colleagues which don't have installed ConceptDraw Office applications. You can create automatically the MS PowerPoint presentation or MS Word document from the content of the active page of your map with a simple click.Household Moving Checklist
This sample was created in ConceptDraw PRO diagramming and vector drawing software using the Basic Diagramming Solution from the Universal Diagramming area of ConceptDraw Solution Park. This sample shows the household moving checklist. It's very important to make the checklist of the things when you move from one house to another. When you have the checklist your moving will be easy and simple, and you will not forget anything.Step Area Graph
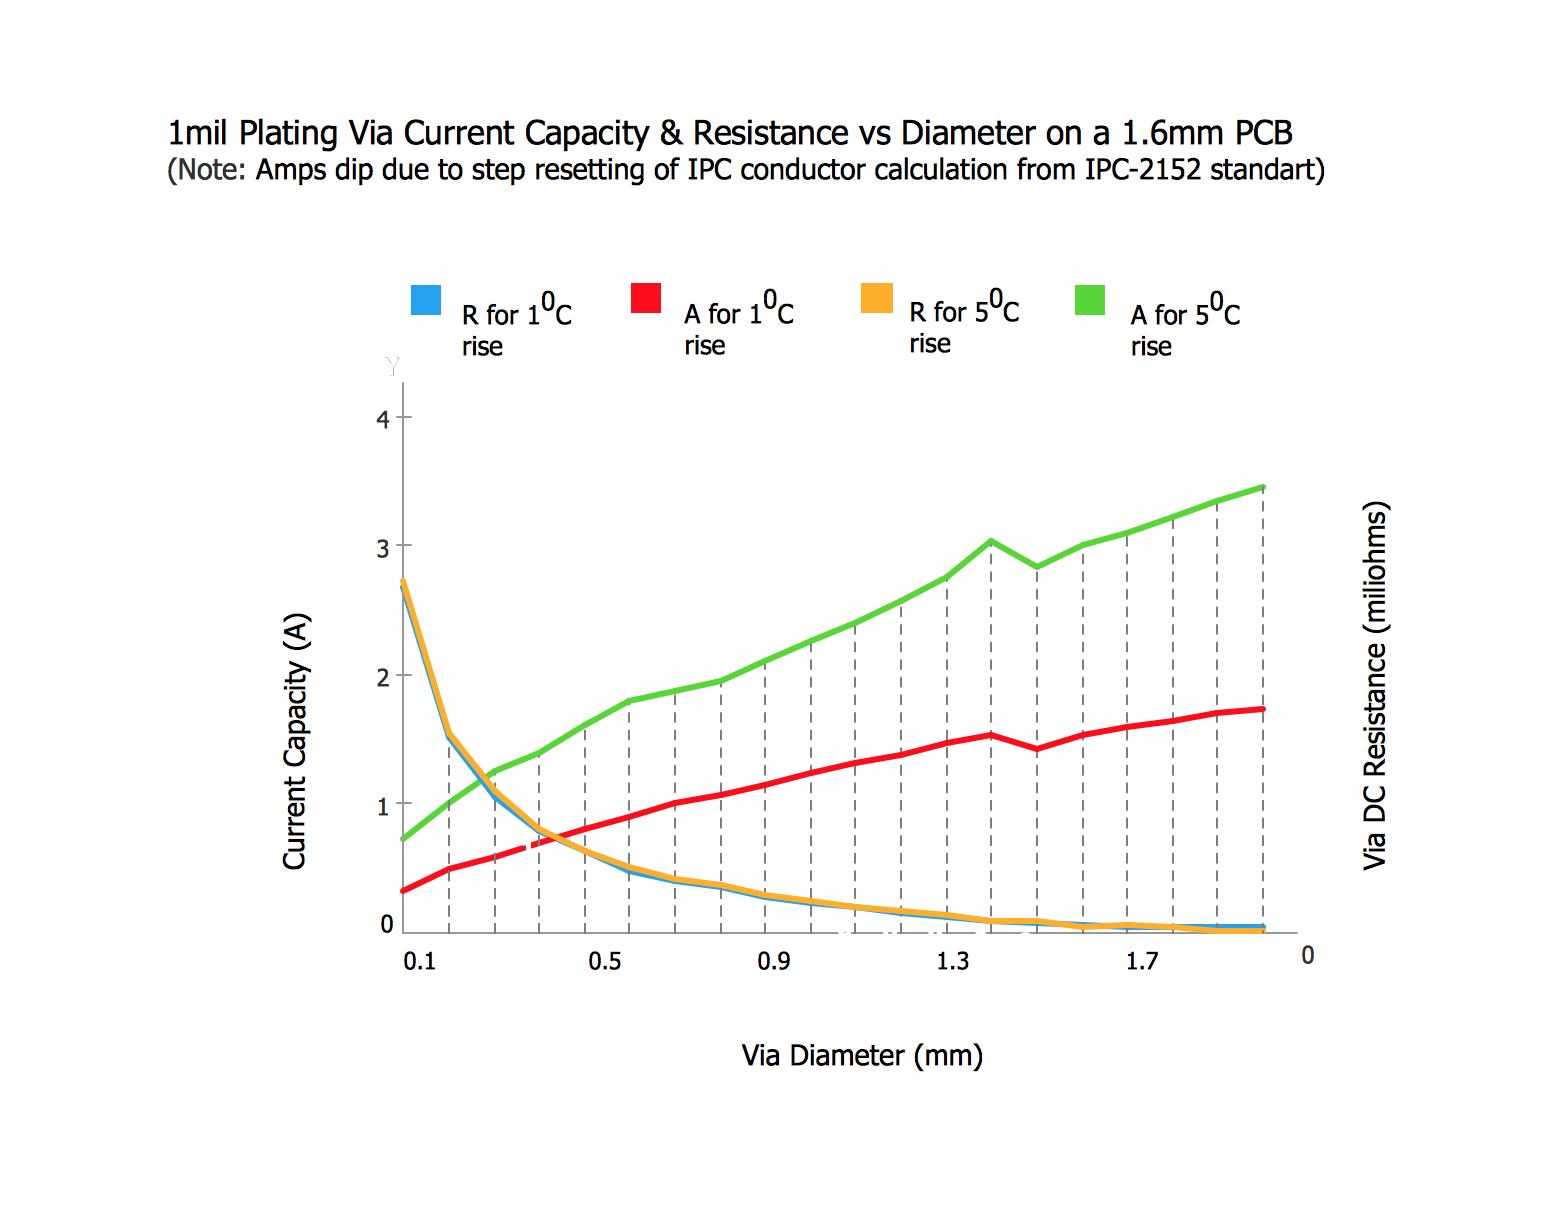
This sample shows the Step Area Graph of the PCB (Printed circuit board) Via current capacity and can be useful in electronics. It is displayed 1 mil plating Via current capacity and the resistance vs diameter on a 1.6 mm PCB. A via is an electrical connection between the layers in the electronical circuit that in PCB consists of two pads on the different electrically connected layers of the board.Feature Comparison Chart Software
An example of marketing analysis diagram, can be used to analyse product market and define marketing strategy. This sample shows the Feature Comparison Chart of the digital scouting cameras. It can be useful for digital cameras production field, marketing, sales, etc.Spider Chart Template
This sample shows the Spider Chart that represents the budget and spending for one organization and allows to compare them. The multivariate data are represented on the Spider Chart as a two-dimensional chart with four or more variables displayed on the axes that start in one point. The Spider Charts are used in the management, business and sport.
 Computer and Networks Area
The solutions from Computer and Networks Area of ConceptDraw Solution Park collect samples, templates and vector stencils libraries for drawing computer and network diagrams, schemes and technical drawings.
- Pyramid Project In Marketing Sales
- Marketing Diagrams | Gant Chart in Project Management | Pyramid ...
- Pyramid Diagram | Triangle chart - Template | Project triangle chart ...
- Pyramid Diagram | Project triangle chart | Pyramid Charts | Building ...
- Venn Diagrams | Pyramid Diagram | Best Tool for Infographic ...
- How to Draw a Computer Network Diagrams | Universal ...
- Pyramid Diagram | Pyramid Chart Examples | Pyramid Charts | How ...
- Pyramid Diagram | Pyramid Diagram | Project management triangle ...
- Pyramid Diagram | Project triangle chart | Pyramid Charts | Chart Of ...
- Pyramid Diagram | Project triangle chart | Triangular chart ...
- Pyramid Diagram | Software Work Flow Process in Project ...
- Software Work Flow Process in Project Management with Diagram ...
- Triangular Pyramids For A Project
- Pyramid Diagram | Project — Assigning Resources | Software Work ...
- Process Flowchart | Pyramid Diagram | Pyramid Diagram | Project ...
- Triangle scheme with arrows - Template | Pyramid Diagram . Project ...
- Pyramid Diagram | Project Management Area | Social Sciences ...
- Marketing | Gant Chart in Project Management | Pyramid Charts ...
- 4 Level pyramid model diagram - Information systems types ...


