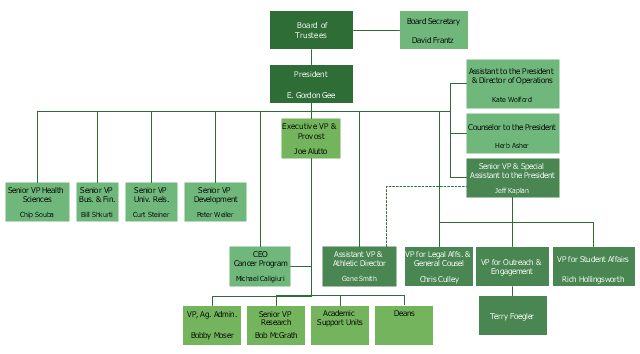
This example is based on the organizational chart from the Ohio State University website. [osu.edu/ vpsearch/ images/ University_ Org_ Chart.png]
"The Ohio State University, a multi-campus land grant institution with an international presence, is a world-class public research university and the leading comprehensive teaching and research institution in the state, Ohio's flagship university. Ohio State provides a distinctive educational experience for students and pursues cutting-edge interdisciplinary research that brings together scholars from diverse disciplines to solve key problems in society.
One of the University's core values is to "ignite a lifelong love of learning" in students. Ohio State students benefit from a scholarly environment in which research inspires and informs teaching.
The Vice President for Student Life provides vision, leadership, and strategic direction to the Office of Student Life, a comprehensive unit dedicated to supporting the educational mission of the University and promoting the best possible overall experience for the diverse student body of approximately 60,000. The Office of Student Life supports every aspect of Ohio State students experience. Its scope includes housing, campus dining, disability services, the multicultural center, counseling and health services, student organizations and leadership development, and other related operations." [osu.edu/ vpsearch/ ]
The organizational chart example "University leadership" was created using the ConceptDraw PRO diagramming and vector drawing software extended with the Organizational Charts solution from the Management area of ConceptDraw Solution Park.
This SWOT matrix diagram example was created on the base of article "An Easy Way To Jumpstart Your Strategic Plan: SWOT" by Leslie Wolf from the website of the California Digital Library, the University of California. "Strategic planning doesn’t have to be a daunting and lengthy process. The goal is really a simple one: to help you understand your world and build a road map to guide your efforts. ...
This analysis tool can help you focus your attention on the specific success factors that are right for your team.
The tool is called a SWOT analysis. SWOT stands for Strengths and Weaknesses, Opportunities and Threats. Here’s what it means:
(1) Strengths are those positive internal attributes that strengthen your business or team. You can develop plans to capitalize on those strengths.
(2) Weaknesses are those negative internal attributes that are working against your success. You can shore up those weaknesses so they don’t stop your success.
(3) Opportunities are those external conditions that can have a positive effect on your goals. These opportunities can point you in the right direction.
(4) Threats are those external conditions that can have a negative effect on your goals. These threats will affect you less if you can identify and minimize them. ...
We thought it would be helpful to show you a sample SWOT analysis for a business you can easily visualize: a small independent bookstore in a university town. The store owner brought the team together to think about how the bookstore could survive during the continuing financial downturn. After an hour of brainstorming, this is the SWOT analysis they developed." [cdlib.org/ cdlinfo/ 2010/ 09/ 29/ an-easy-way-to-jumpstart-your-strategic-plan-swot/ ]
The matrix diagram example "SWOT analysis for a small independent bookstore" was created using the ConceptDraw PRO diagramming and vector drawing software extended with the SWOT Analysis solution from the Management area of ConceptDraw Solution Park.
The vector stencils library "Transport map" contains 96 pictograms for drawing transport maps.
Use it in your spatial infographics for visual representation of transport schemes and plans as metro maps in the ConceptDraw PRO diagramming and vector drawing software extended with the Spatial Infographics solution from the area "What is Infographics" of ConceptDraw Solution Park.
Use it in your spatial infographics for visual representation of transport schemes and plans as metro maps in the ConceptDraw PRO diagramming and vector drawing software extended with the Spatial Infographics solution from the area "What is Infographics" of ConceptDraw Solution Park.
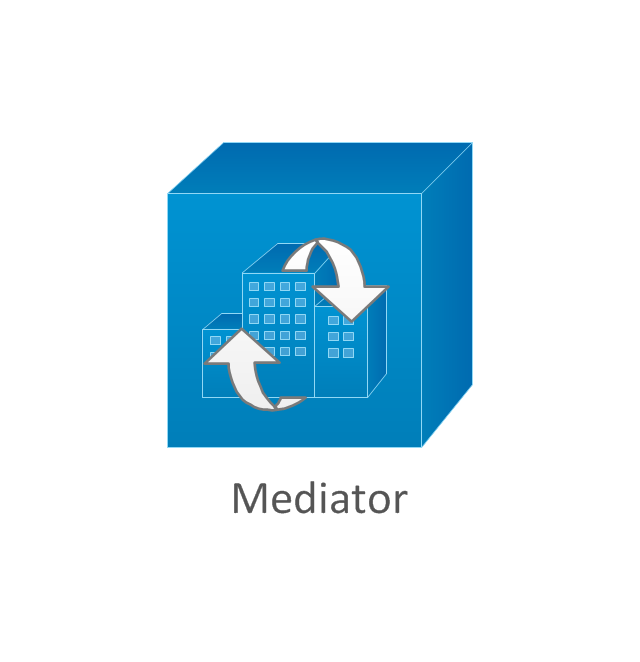
The vector stencils library "Cisco buildings" contains 21 symbols: Government building, University, Small business, Branch office, Headquarters, Router in building, House, Telecommuter house, Home office, Medium building, Multidwelling unit (MDU), Mediator.
The symbols example "Cisco buildings - Vector stencils library" was created using the ConceptDraw PRO diagramming and vector drawing software extended with the Cisco Network Diagrams solution from the Computer and Networks area of ConceptDraw Solution Park.
www.conceptdraw.com/ solution-park/ computer-networks-cisco
Diagram Software - The Best Choice for Diagramming
For vector shapes and connector tools for quick and easy drawing diagrams for business, technology, science and education - The best choice for Diagramming is ConceptDraw PRO.The vector stencils library "Landmarks" contains 69 landmark symbols of buildings, waterways, scale and directional indicators for labeling transportation and directional maps, road and route maps, street and transit maps, locator and tourist maps.
The pictograms example "Landmarks - Vector stencils library" was created using the ConceptDraw PRO diagramming and vector drawing software extended with the Directional Maps solution from the Maps area of ConceptDraw Solution Park.
The pictograms example "Landmarks - Vector stencils library" was created using the ConceptDraw PRO diagramming and vector drawing software extended with the Directional Maps solution from the Maps area of ConceptDraw Solution Park.
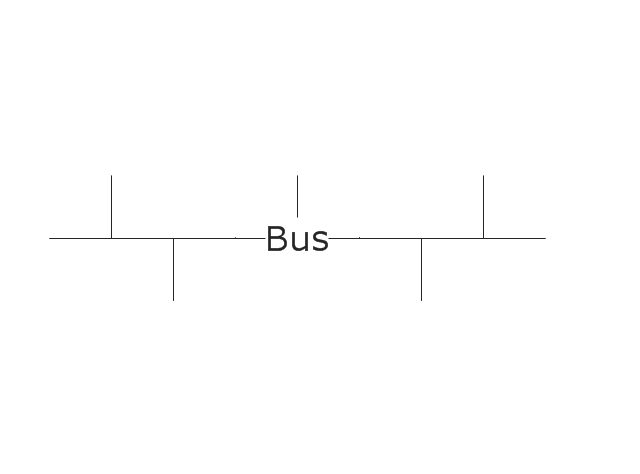
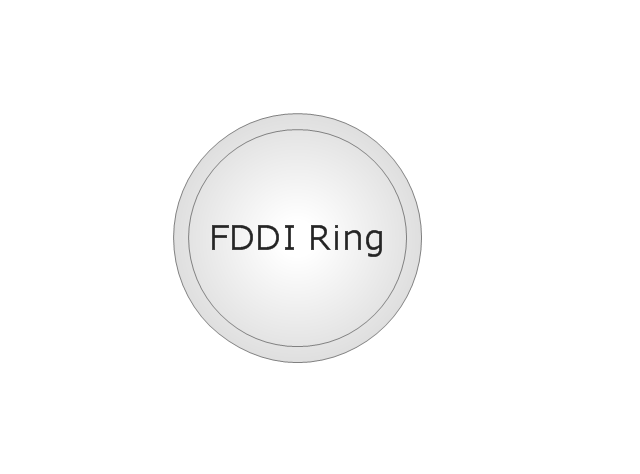
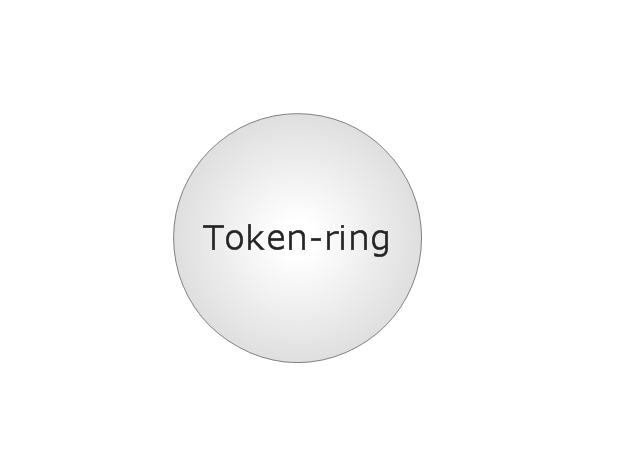
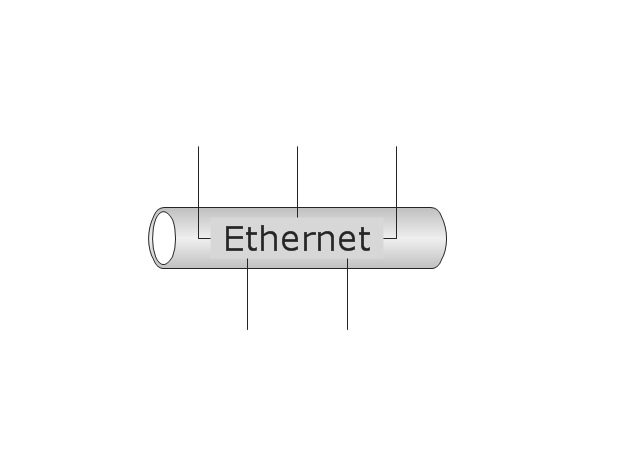
The vector stencils library "Logical symbols" contains 49 logical symbols for drawing logical network topology diagrams.
"Logical topology, or signal topology, is the arrangement of devices on a computer network and how they communicate with one another. How devices are connected to the network through the actual cables that transmit data, or the physical structure of the network, is called the physical topology. Physical topology defines how the systems are physically connected. It represents the physical layout of the devices on the network. The logical topology defines how the systems communicate across the physical topologies.
Logical topologies are bound to network protocols and describe how data is moved across the network. ... EXAMPLE : twisted pair Ethernet is a logical bus topology in a physical star topology layout. While IBM's token ring is a logical ring topology, it is physically set up in star topology." [Logical topology. Wikipedia]
The icons example "Logical symbols - Vector stencils library" was created using the ConceptDraw PRO diagramming and vector drawing software extended with the Computer and Networks solution from the Computer and Networks area of ConceptDraw Solution Park.
www.conceptdraw.com/ solution-park/ computer-and-networks
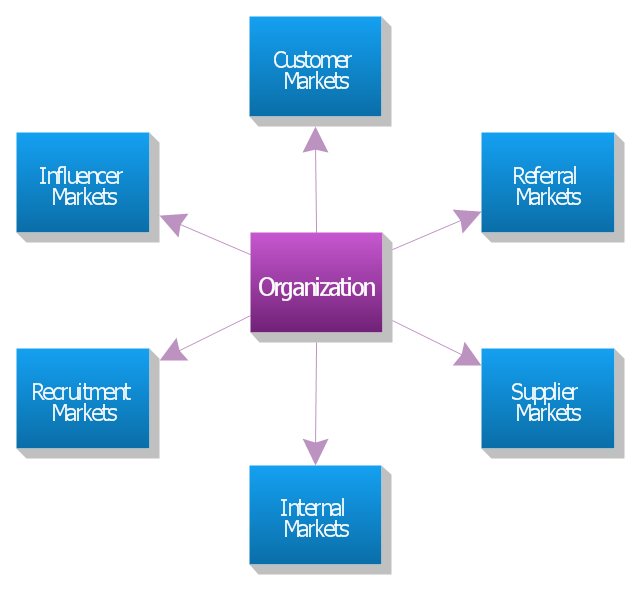
"The six markets model.
Christopher, Payne and Ballantyne (1991) from Cranfield University goes further. They identify six markets which they claim are central to relationship marketing. They are: internal markets, supplier markets, recruitment markets, referral markets, influence markets, and customer markets.
Referral marketing is developing and implementing a marketing plan to stimulate referrals. Although it may take months before you see the effect of referral marketing, this is often the most effective part of an overall marketing plan and the best use of resources.
Marketing to suppliers is aimed at ensuring a long-term conflict-free relationship in which all parties understand each other's needs and exceed each other's expectations. Such a strategy can reduce costs and improve quality.
Influence markets involve a wide range of sub-markets including: government regulators, standards bodies, lobbyists, stockholders, bankers, venture capitalists, financial analysts, stockbrokers, consumer associations, environmental associations, and labor associations. These activities are typically carried out by the public relations department, but relationship marketers feel that marketing to all six markets is the responsibility of everyone in the organization. Each market may require its own explicit strategies and a separate marketing mix for each." [Relationship marketing. Wikipedia]
The block diagram example "Six markets model" was created using the ConceptDraw PRO diagramming and vector drawing software extended with the Block Diagrams solution from the area "What is a Diagram" of ConceptDraw Solution Park.
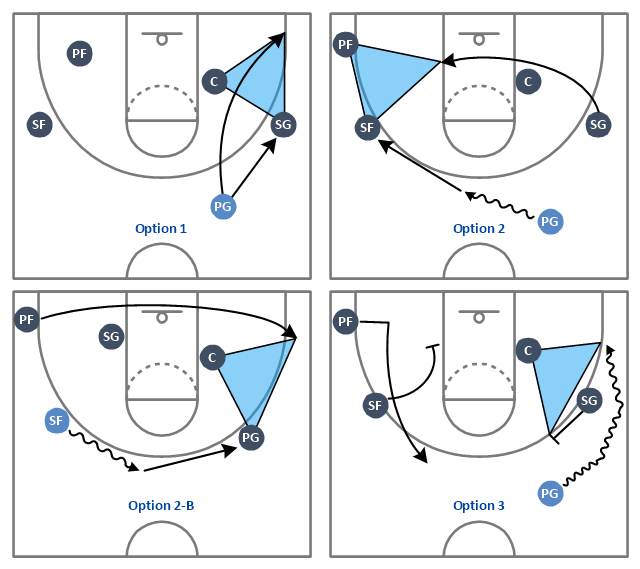
"The triangle offense, also known as the triple-post offense, is an offensive strategy in basketball. Its basic ideas were initially established by Hall of Fame coach Sam Barry at the University of Southern California. His system was later refined by former Houston Rockets and Kansas State University basketball head coach Tex Winter, who played for Barry in the late 1940s. Winter also served as an assistant coach for the Chicago Bulls in the 1980s and 1990s and was also an assistant coach for the Los Angeles Lakers in the 2000s.
The system's most important feature is the sideline triangle created by the center, who stands at the low post, the forward at the wing, and the guard at the corner. The team's other guard stands at the top of the key and the weak-side forward is on the weak-side high post - together forming the "two-man game." The goal of the offense is to fill those five spots, which creates good spacing between players and allows each one to pass to four teammates. Every pass and cut has a purpose and everything is dictated by the defense." [Triangle offense. Wikipedia]
The basketball positions diagram example "Basketball plays - Triangle offense" was created using the ConceptDraw PRO diagramming and vector drawing software extended with the Basketball solution from the Sport area of ConceptDraw Solution Park.
www.conceptdraw.com/ solution-park/ sport-basketball
HelpDesk
Replace Your Current Diagramming Tool
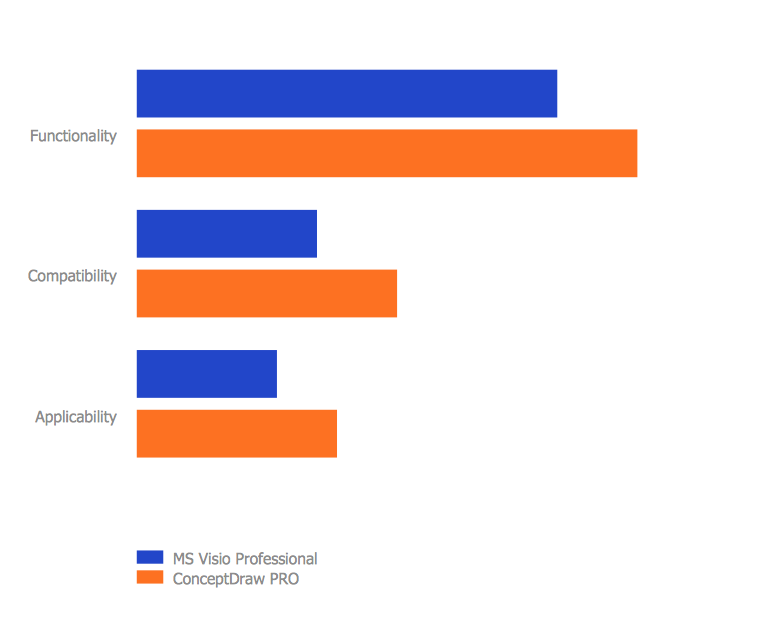
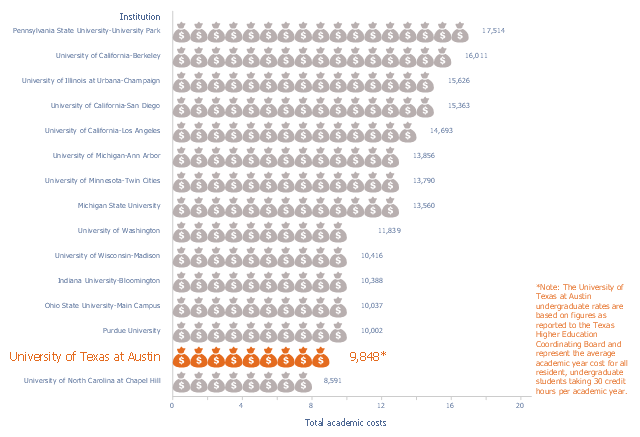
Migrate from Visio to ConceptDraw for the entire organization at super low price. By means of a ConceptDraw PRO Site License any employer in your company can get advantages of ConceptDraw PRO in just a $ 2995 per year. There is no need to count both licenses and users. Every co-worker in your organization will get permission to access at no extra charge. At half-price of Microsoft Visio®, you can supply your company with a ConceptDraw Site License. Reduced price and effortless administrating are just a couple of the causes to change Visio to ConceptDraw PRO. Here are just a few reasons.This picture bar graph sample shows the UT Austin Tuition Ranks 6th Compared to Other Texas Public Universities (Tuition and fees per semester, fall 2015). It was designed using data of the diagram "Compare UT Tuition" from the website of the University of Texas at Austin.
[tuition.utexas.edu/ compare]
The pictorial chart "Academic costs for residents, 2015-16" was created using the ConceptDraw PRO diagramming and vector drawing software extended with the Picture Graphs solution from the Graphs and Charts area of ConceptDraw Solution Park.
[tuition.utexas.edu/ compare]
The pictorial chart "Academic costs for residents, 2015-16" was created using the ConceptDraw PRO diagramming and vector drawing software extended with the Picture Graphs solution from the Graphs and Charts area of ConceptDraw Solution Park.
- How to Draw an Organization Chart | How to Draw an ...
- Create Organizational Chart | Organizational chart - University ...
- University Organizational Chart Sample
- Organizational chart - University leadership | Organizational ...
- Example of Organizational Chart | Organizational chart - University ...
- Organizational chart - University leadership | Army Flow Charts ...
- Organizational chart - University leadership | IDEF0 standard with ...
- Diagram On A University Organogram
- Organizational chart - University leadership | Organizational chart ...
- Coad/Yourdon's Object-Oriented Analysis model | Dfd For University ...
- Organisational Structure Examples For University
- Organizational chart - University leadership
- Geo Map - USA - Ohio | Organizational chart - University leadership ...
- Draw A University Organisational Structure Of A University
- Process Flowchart | Dfd Diagram For University Library ...
- Basic Flowchart Symbols and Meaning | Process Flowchart ...
- University Management Structure
- Daigram Of A University Structure
- Dfd For University Management System




















-logical-symbols---vector-stencils-library.png--diagram-flowchart-example.png)


