HelpDesk
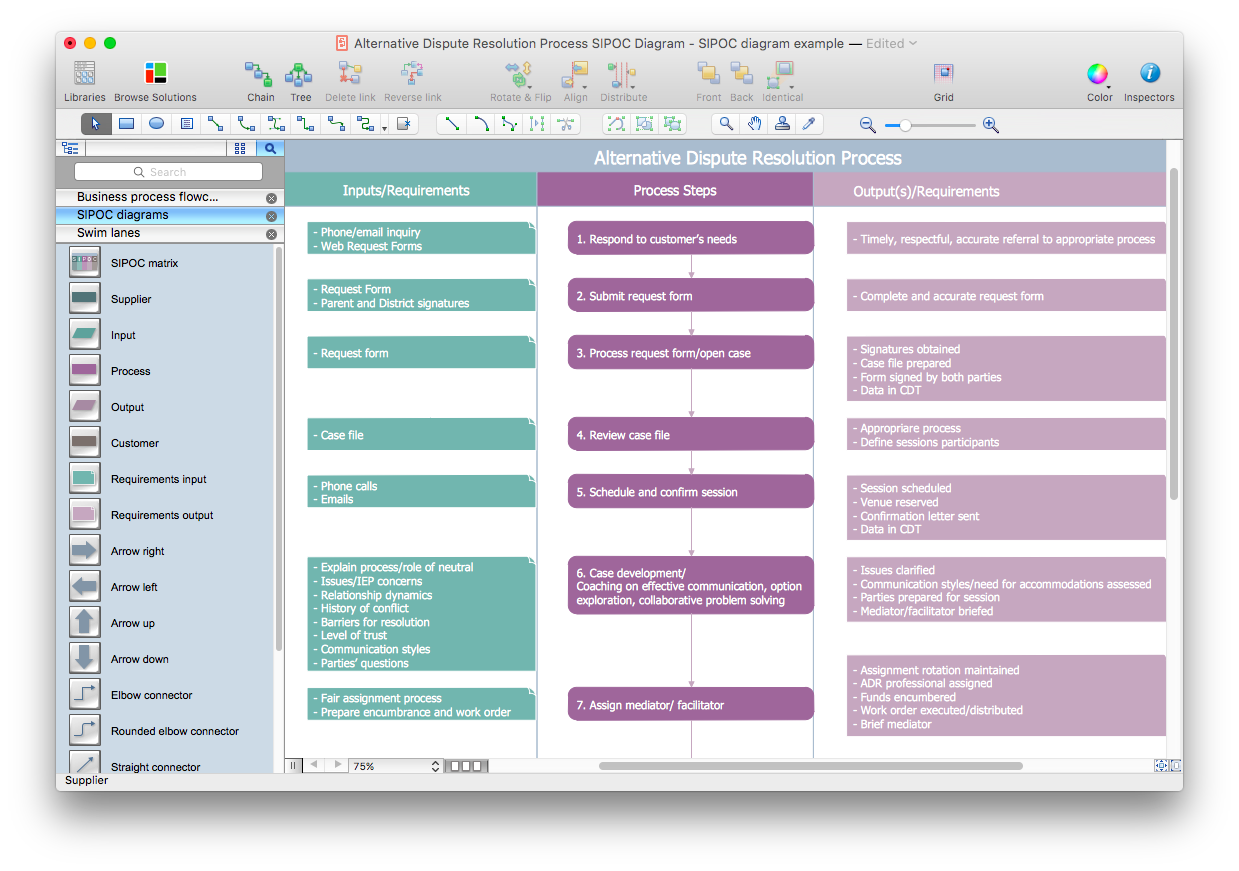
How to Create a SIPOC Diagram Using ConceptDraw PRO
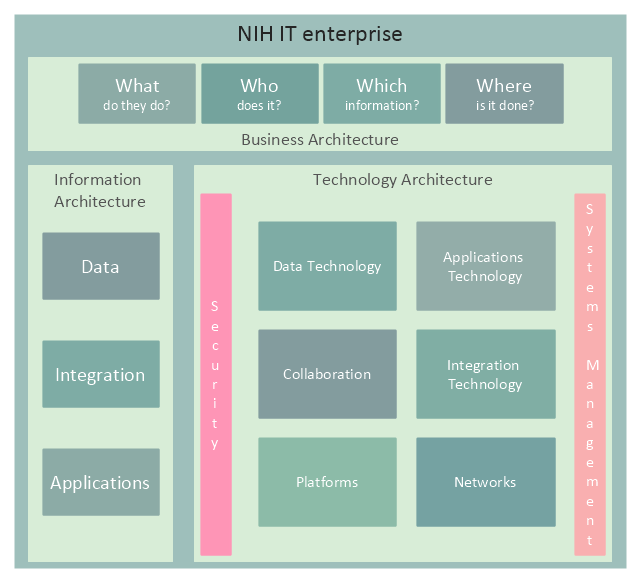
SIPOC (suppliers, inputs, process, outputs, customers) diagram is focused on the quality of a business process inputs and outputs. SIPOC diagram has a form of a segmented table that gives comprehensive outline for each category. SIPOC diagram depicts the start and end of a process, and the relationships between a company and its suppliers. SIPOC diagram is an important part of the Six Sigma methodology. With its Business Process Mapping solution, ConceptDraw PRO offers a power set of process mapping tools to empower quality management within an organization.This enterprise architecture diagram sample was redesigned from the illustration of the NIH Enterprise Architecture website. [enterprisearchitecture.nih.gov/ Pages/ Framework.aspx]
"Enterprise architecture is a comprehensive framework used to manage and align an organization's Information Technology (IT) assets, people, operations, and projects with its operational characteristics. In other words, the enterprise architecture defines how information and technology will support the business operations and provide benefit for the business.
It illustrates the organization’s core mission, each component critical to performing that mission, and how each of these components is interrelated. These components include:
(1) Guiding principles,
(2) Organization structure,
(3) Business processes,
(4) People or stakeholders,
(5) Applications, data, and infrastructure,
(6) Technologies upon which networks, applications and systems are built.
Guiding principles, organization structure, business processes, and people don’t sound very technical. That’s because enterprise architecture is about more than technology. It is about the entire organization (or enterprise) and identifying all of the bits and pieces that make the organization work." [enterprisearchitecture.nih.gov/ Pages/ what.aspx]
The example "NIH IT enterprise architecture framework" was created using the ConceptDraw PRO diagramming and vector drawing software extended with the Enterprise Architecture Diagrams solution from the Management area of ConceptDraw Solution Park.
HelpDesk
How to Draw a Block Diagram in ConceptDraw PRO
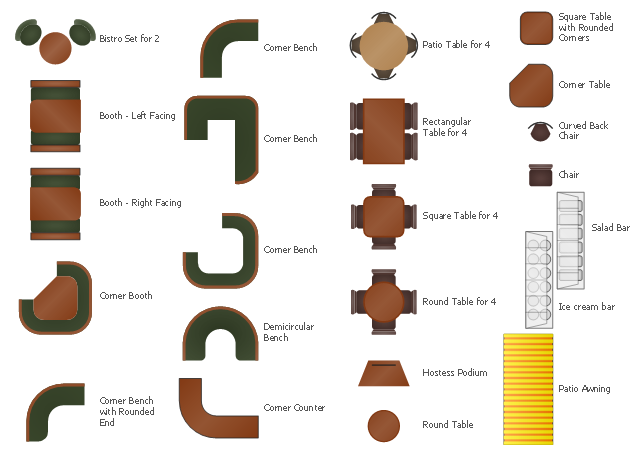
Block diagram is a simple chart that use blocks to show some elements or activities, and connectors that show the relationship between neighboring blocks. They are commonly simple, giving an overview of a process without necessarily going into the specifics of implementation. Block diagrams are commonly used to depict a general description of a system and its activity. A most known sample of a block diagram is a flow chart, used in many types of business as a common method of representing repeated processes. Easy and a simple creation, a number of objects and connectors make the block diagram a many-sided tool for various industries. The ability to make block diagrams is delivered by the ConceptDraw Block Diagrams solution.The vector stencils library Cafe and restaurant contains symbols of furniture, equipment and interior design elenebts.
Use the shapes library Cafe and restaurant to draw the interior design floor plans and furniture and equipment layouts of coffeehouses, restaurants and bars using the ConceptDraw PRO diagramming and vector drawing software.
"Various types of restaurant fall into several industry classifications based upon menu style, preparation methods and pricing. Additionally, how the food is served to the customer helps to determine the classification.
Historically, restaurant referred only to places that provided tables where one sat down to eat the meal, typically served by a waiter. Following the rise of fast food and take-out restaurants, a retronym for the older "standard" restaurant was created, sit-down restaurant. Most commonly, "sit-down restaurant" refers to a casual dining restaurant with table service, rather than a fast food restaurant or a "diner", where one orders food at a counter." [Types of restaurant. Wikipedia]
The design elements library Cafe and restaurant is included in the Cafe and Restaurant Floor Plans solution from the Building Plans area of ConceptDraw Solution Park.
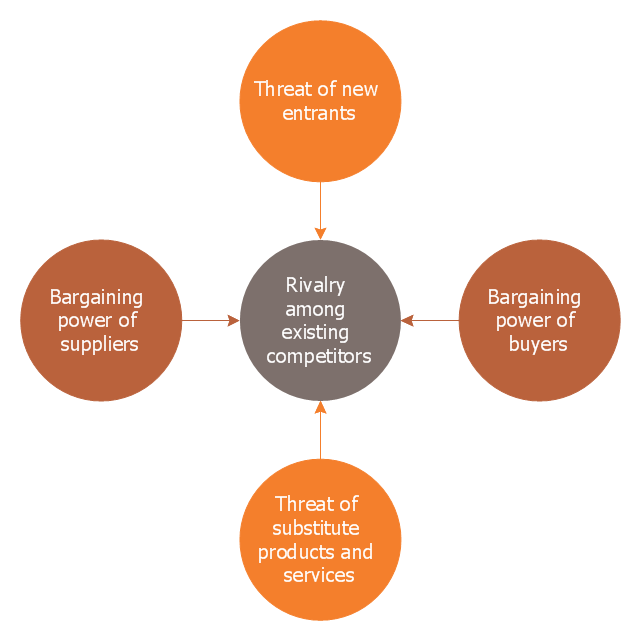
This circle-spoke diagram sample shows the Porter five forces model. It was designed on the base of the Wikimedia Commons file: Modelo Porter.png. [commons.wikimedia.org/ wiki/ File:Modelo_ Porter.png]
"Porter's five forces analysis is a framework that attempts to analyze the level of competition within an industry and business strategy development. It draws upon industrial organization (IO) economics to derive five forces that determine the competitive intensity and therefore attractiveness of an Industry. Attractiveness in this context refers to the overall industry profitability. An "unattractive" industry is one in which the combination of these five forces acts to drive down overall profitability. A very unattractive industry would be one approaching "pure competition", in which available profits for all firms are driven to normal profit. This analysis is associated with its principal innovator Michael E. Porter of Harvard University. ...
Porter's five forces include – three forces from 'horizontal' competition: the threat of substitute products or services, the threat of established rivals, and the threat of new entrants; and two forces from 'vertical' competition: the bargaining power of suppliers and the bargaining power of customers." [Porter's five forces analysis. Wikipedia]
The hub-and-spoke diagram example "Porter five forces model" was created using the ConceptDraw PRO diagramming and vector drawing software extended with the Circle-Spoke Diagrams solution from the area "What is a Diagram" of ConceptDraw Solution Park.
Software development with ConceptDraw Products
Internet solutions on ConceptDraw base. What may interest developers of Internet solutions.- Graphs And Pie Charts Upon Influence Of Mass Media
- Mind Maps for Business - SWOT Analysis | Block diagram - Porter's ...
- Porter's Value Chain | Competitor Analysis | SWOT Analysis Solution ...
- Draw A Diagram Of Porters Five Force Model And Explain
- Block diagram - Porter's five forces model
- Porters 5 Forces Wiki
- Foreign labor certification workflow
- Project plan timeline - Request for proposal (RFP) | Project plan ...
- Target market - Onion diagram
- CS Odessa Personal Privacy Policy
- Project plan timeline - Request for proposal (RFP) | PERT chart ...
- IDEF0 diagram - Inter-box connections | Top-level context diagram ...
- Baseball | Simple baseball field | Baseball fields - Vector stencils ...
- Simple baseball field | Design elements - Baseball fields | Simple ...
- Competitor Analysis | Block diagram - Porter's five forces model ...
- Interactive voice response (IVR) - Vector stencils library | IVR ...
- Competitor Analysis | Porter's Value Chain | Block diagram - Porter's ...
- UML sequence diagram - GET request
- Block diagram - Porter's five forces model | Porter's Value Chain ...


