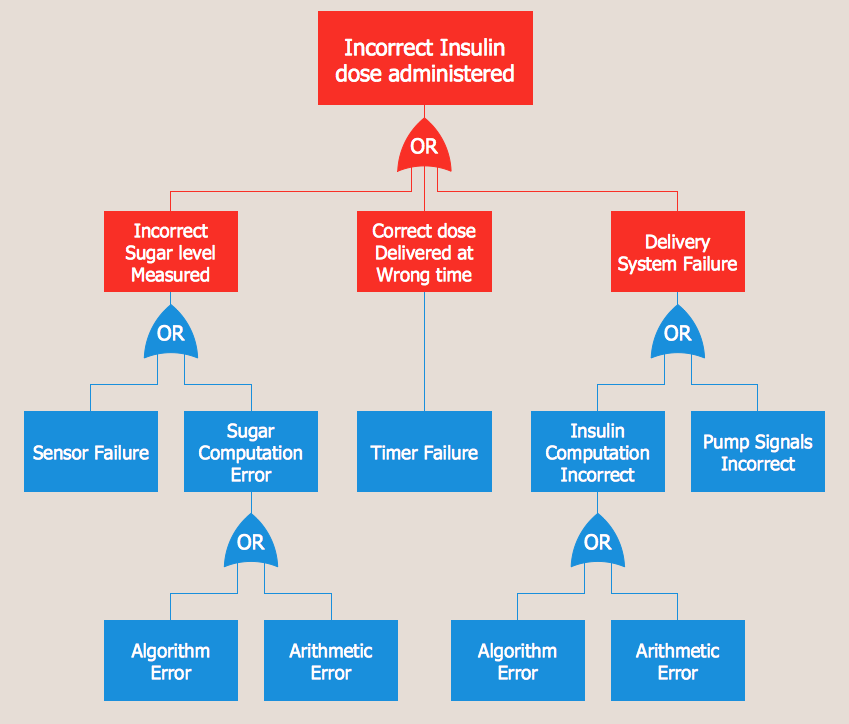
The vector stencils library "Fault tree analysis diagrams" contains 12 symbols for drawing FTA diagrams in the ConceptDraw PRO diagramming and vector drawing software extended with the Fault Tree Analysis Diagrams solution from the Engineering area of ConceptDraw Solution Park.
www.conceptdraw.com/ solution-park/ engineering-fault-tree-analysis-diagrams
Winter Sports Vector Clipart. Medal Map. Spatial Infographics
Tracking Olympic results in visual format is the most modern way to deliver statistics to a broad audience. This is a good example of an illustrated table you may easily modify, print, or publish on web from ConceptDraw Winter Sports solution.
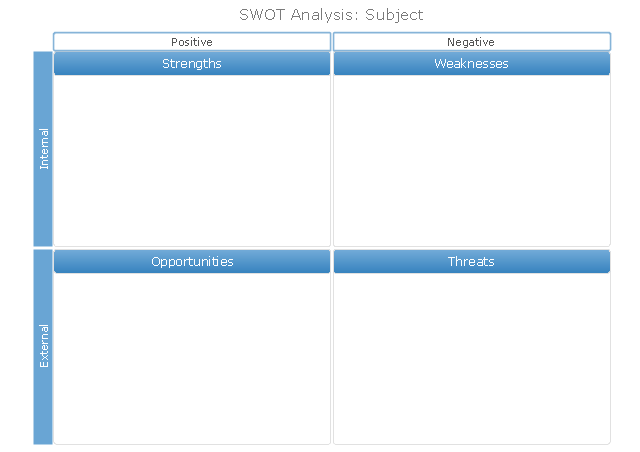
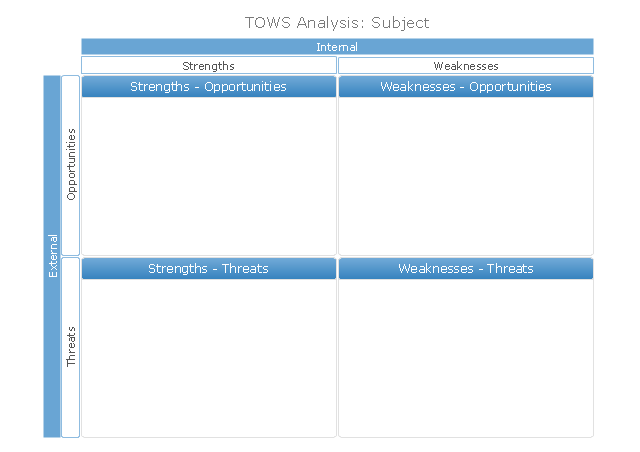
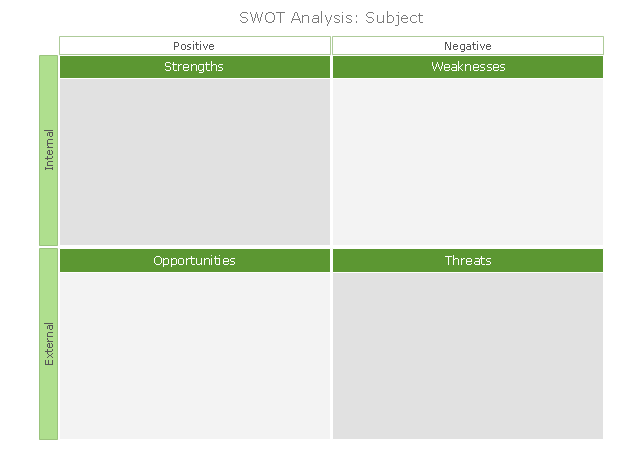
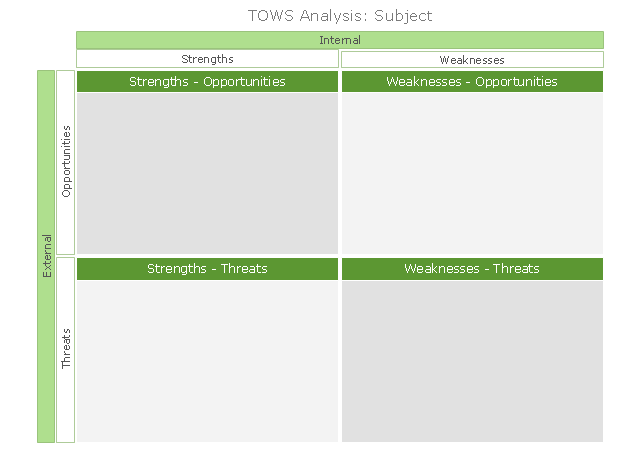
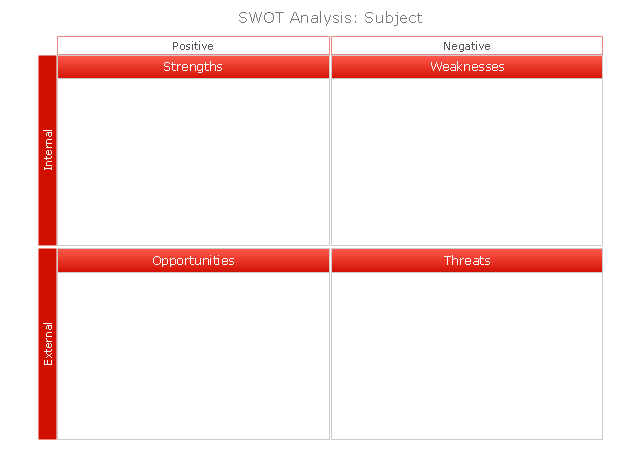
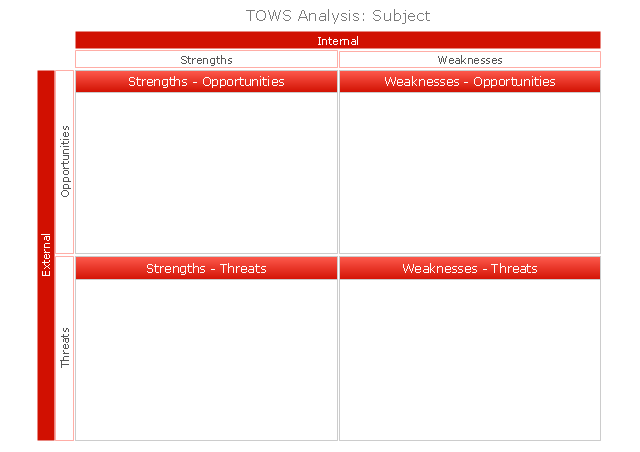
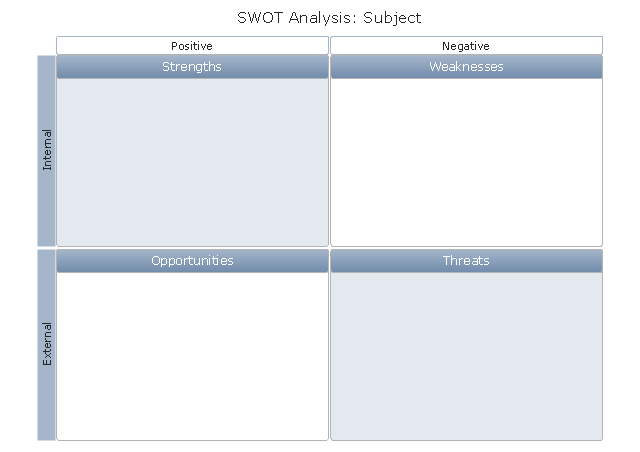
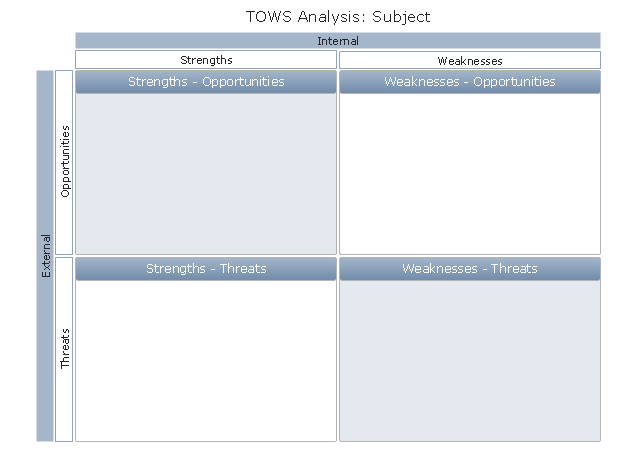
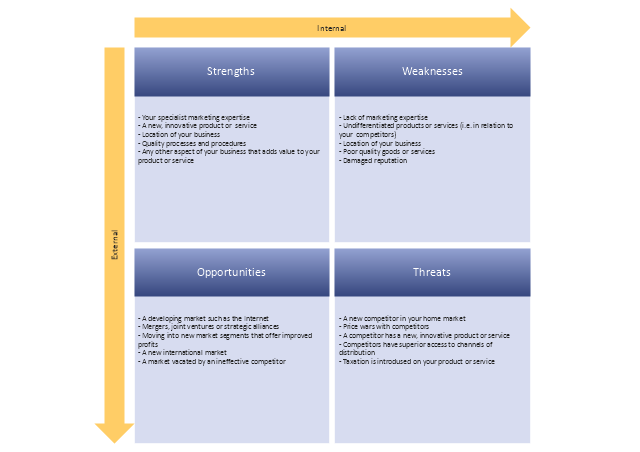
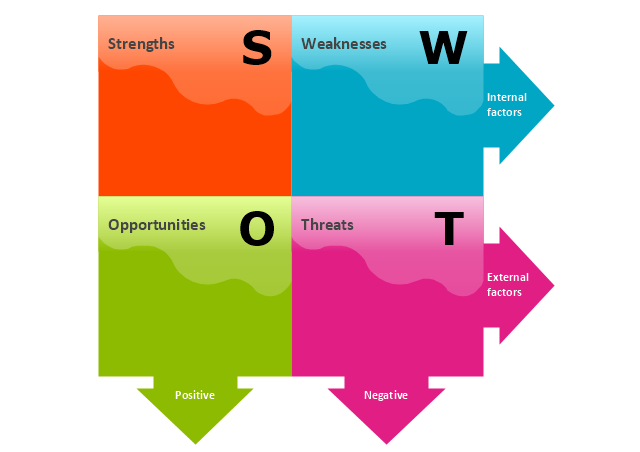
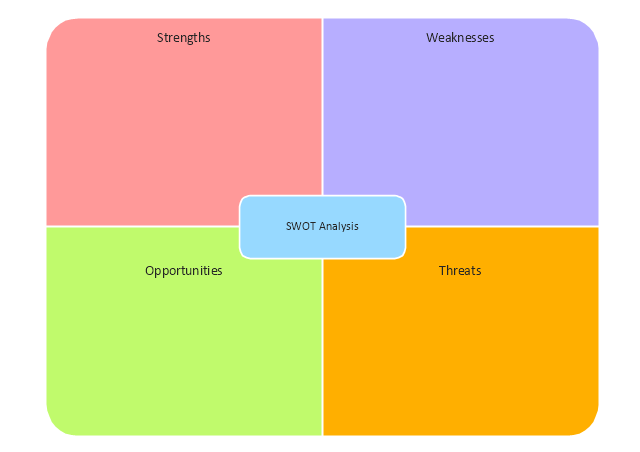
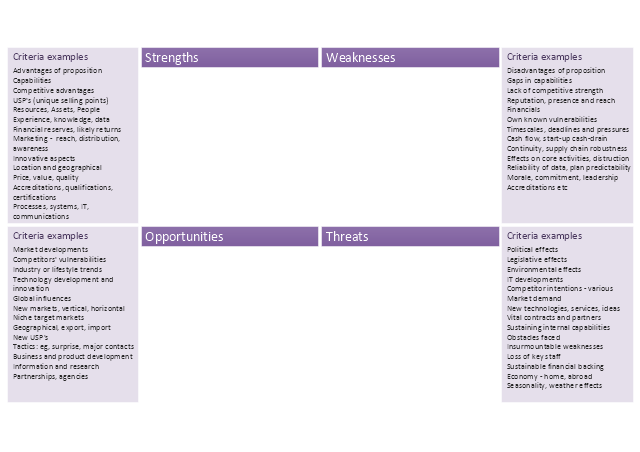
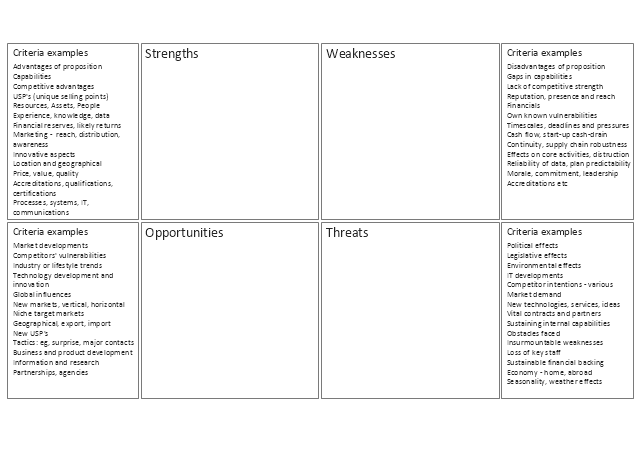
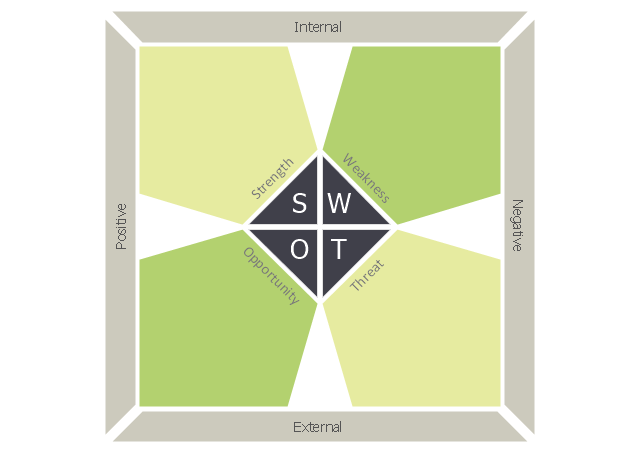
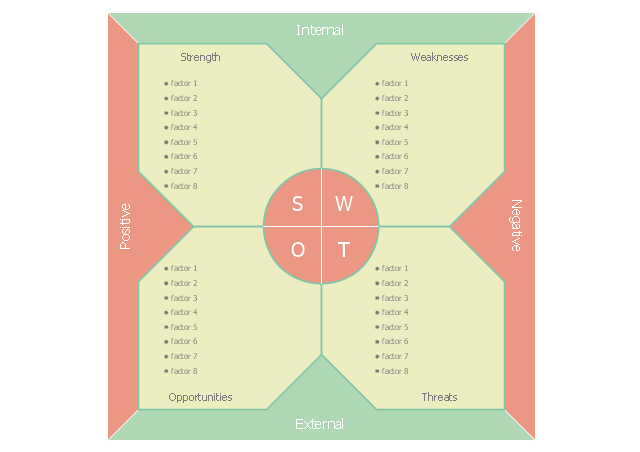
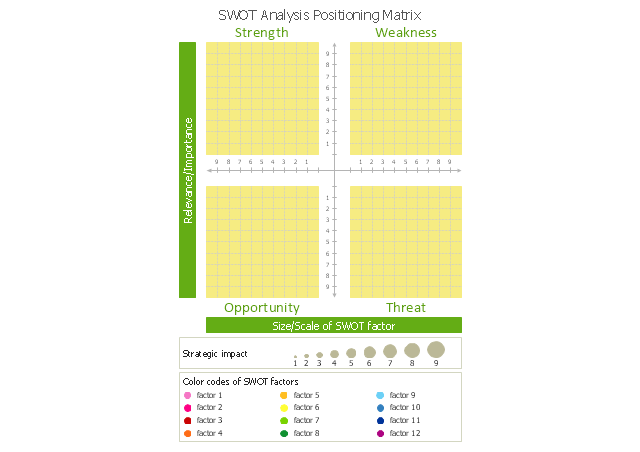
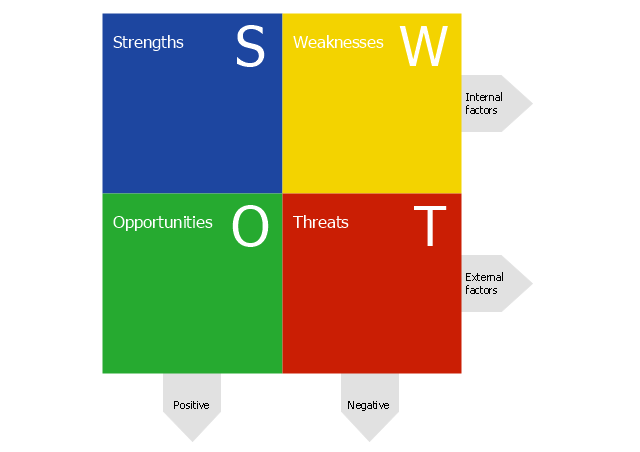
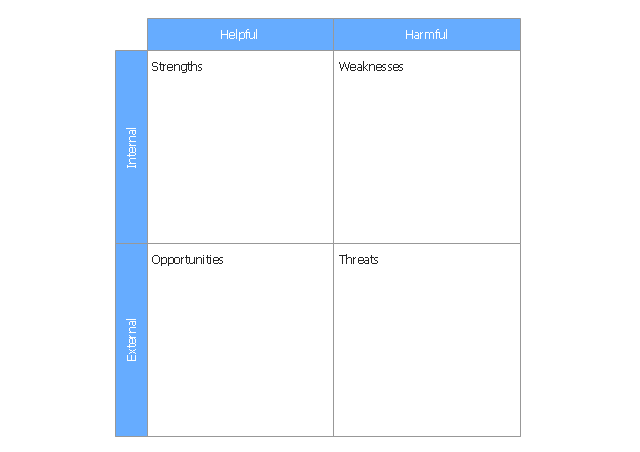
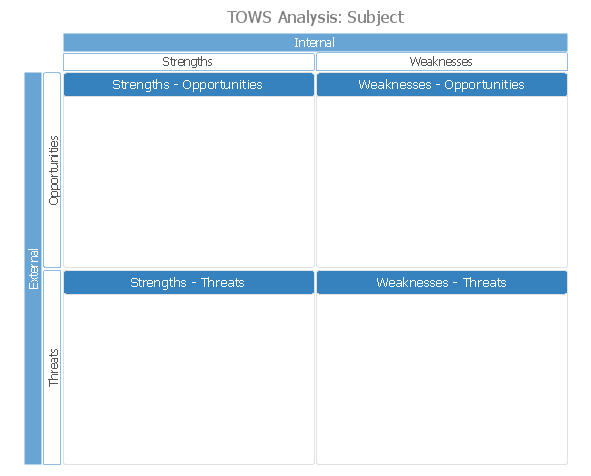
The vector stencils library "SWOT" contains 19 SWOT and TOWS analysis matrix diagram templates. Use it to create your SWOT and TOWS matrices in the ConceptDraw PRO diagramming and vector drawing software extended with the SWOT Analysis solution from the Management area of ConceptDraw Solution Park.
Cause and Effect Diagram
ConceptDraw DIAGRAM software extended with Fishbone Diagrams solution from the Management area of ConceptDraw Solution Park is perfect for Cause and Effect Diagram creating. It gives the ability to draw fishbone diagram that identifies many possible causes for an effect or a problem. Causes and Effects are usually grouped into major categories to identify these sources of variation. Causes and Effects in the diagram show relationships among various factor. Fishbone diagram shows factors of Equipment, Process, People, Materials, Environment and Management, all affecting the overall problem.Data Flow Diagram Symbols. DFD Library
Data Flow Diagrams show information transfers and process steps of a system. The general concept is an approach of a depicting how occurs input in a system, further processes and what runs out. The aim of DFD is in accomplishing of understanding between developers and users. Data flow diagrams are maintained with other methods of structured systems analysis.Pyramid Diagram
A three level pyramid model of different types of Information Systems based on the type of decisions taken at different levels in the organization.Fault Tree Analysis Example
Designing the Fault Tree Analysis (FTA) Diagrams first of all it is important to have a powerful software. ConceptDraw DIAGRAM diagramming and vector drawing software extended with Fault Tree Analysis Diagrams Solution from the Industrial Engineering Area is exactly what you need. It is also convenient to have professional looking Fault Tree Analysis example before the eyes, and it is excellent that this solution includes large collection of such examples.Value Stream Mapping Icons
The library with 40 vector stencils is included in the ConceptDraw Value Stream Mapping solution.TOWS Analysis Software
TOWS analysis is a method of strategic analysis which is oriented on the study of the threats (T) which are danger for the company and new opportunities (O) which are closely connected with weaknesses (W) and strengths (S) sides of its activity.ConceptDraw DIAGRAM diagramming and vector drawing software extended with SWOT and TOWS Matrix Diagrams Solution from the Management Area is the best for realization TOWS analysis and for quick and easy construction TOWS Matrix.
TOWS Matrix
TOWS Matrix is an effective tool which allows to analize the external opportunities and threats by means of analyzing the internal strengths and weaknesses of a company. ConceptDraw DIAGRAM diagramming and vector drawing software extended with SWOT and TOWS Matrix Diagrams Solution from the Management Area will help design TOWS Matrix for your company without efforts.- Vectors For Site Analysis Png
- Site Analysis Symbols Png
- Sales workflow - Vector stencils library | Pyramid Chart Examples ...
- Lifestyle analysis - Method of travel to school | Stars and planets ...
- Performance Appraisal Report Vector Png
- Architecture Site Analysis Arrow Png
- Interview Icon Vector Png
- Sales Flowcharts | Sales workflow - Vector stencils library | Sales ...
- Report Vector Png
- Payment Vector Png
- ERD | Entity Relationship Diagrams, ERD Software for Mac and Win
- Flowchart | Basic Flowchart Symbols and Meaning
- Flowchart | Flowchart Design - Symbols, Shapes, Stencils and Icons
- Flowchart | Flow Chart Symbols
- Electrical | Electrical Drawing - Wiring and Circuits Schematics
- Flowchart | Common Flowchart Symbols