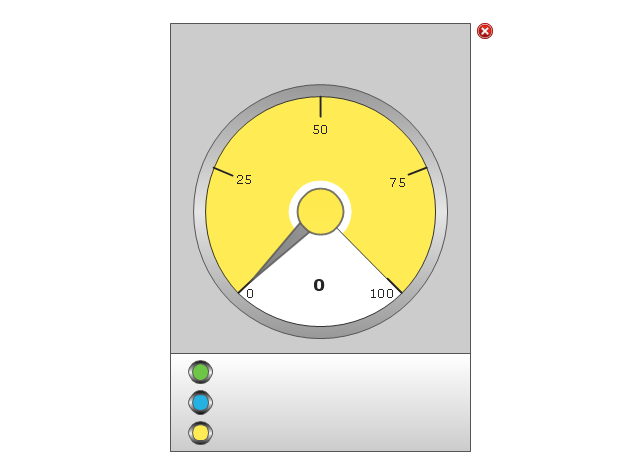
The vector stencils library "Meter indicators 2" (for dark background) contains 29 Live Objects: speedometer gauge, dial, bullet, slider and level meter visual indicators.
The Live Objects designed to display actual measures of performance metrics from external data source files. Some of them also display comparative measures, and colored zones of qualitative ranges with legend.
Use this library to create visual dashboards in the ConceptDraw PRO diagramming and vector drawing software extended with the Meter Dashboard solution from the area "What is a Dashboard" of ConceptDraw Solution Park.
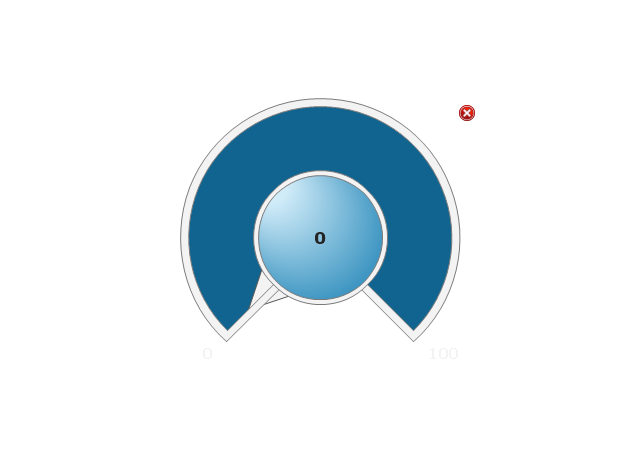
Speedometer Gauge 1

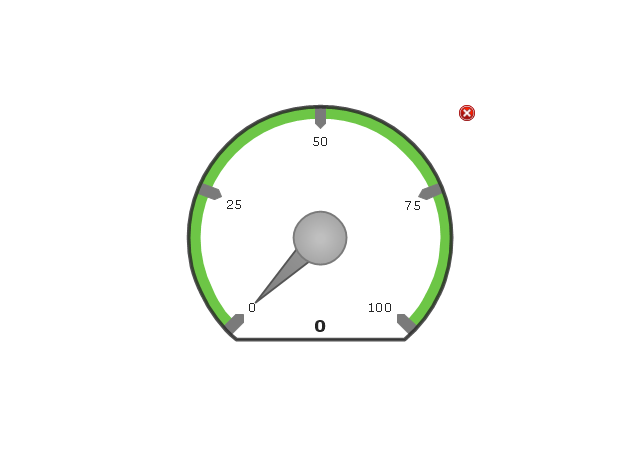
Speedometer Gauge 2
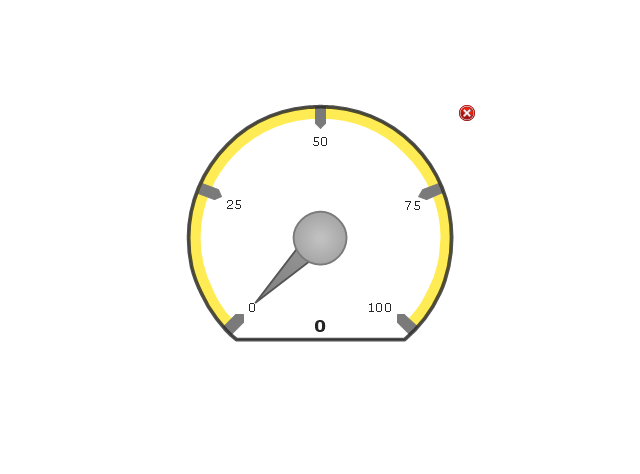
Speedometer Gauge 3
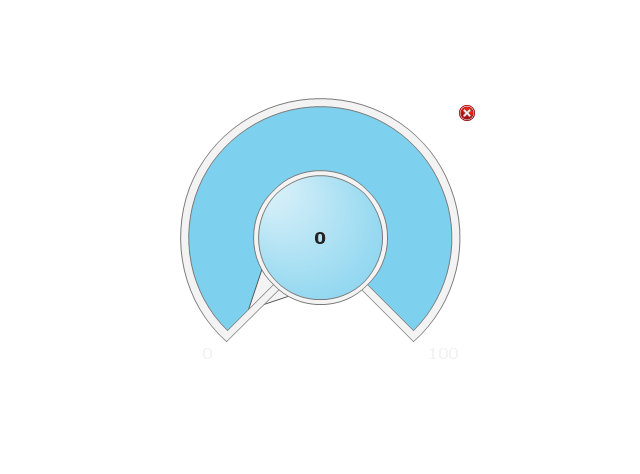
Speedometer Gauge 4
Dial 1
Dial 2
Bullet 1

Bullet 2
Bullet 3
Bullet 4

Bullet 5

Bullet 6

Directed Bullet 1
Directed Bullet 2

Slider Horizontal 1
Slider Horizontal 2
Slider Horizontal 3
Slider Horizontal 4
Slider Vertical 1
Slider Vertical 2
Slider Horizontal 5
Slider Horizontal 6
Slider Horizontal 7
Slider Vertical 3
Level Meter 1
Level Meter 2
Level Meter 3
Level Meter 4
Level Meter 5
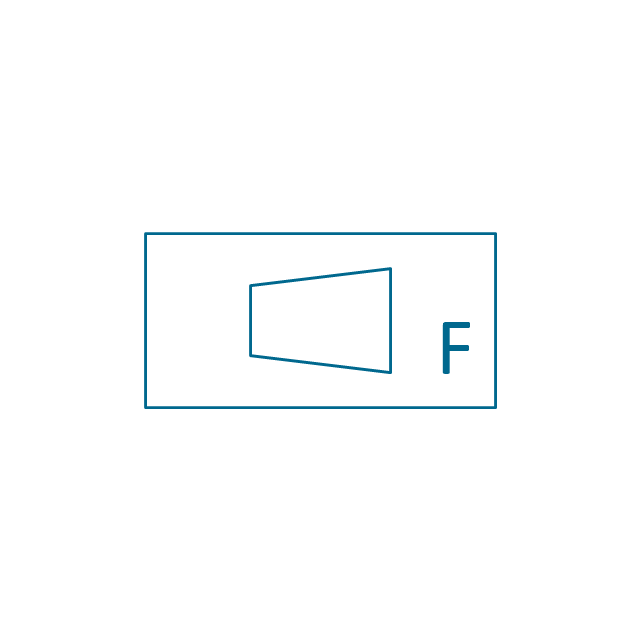
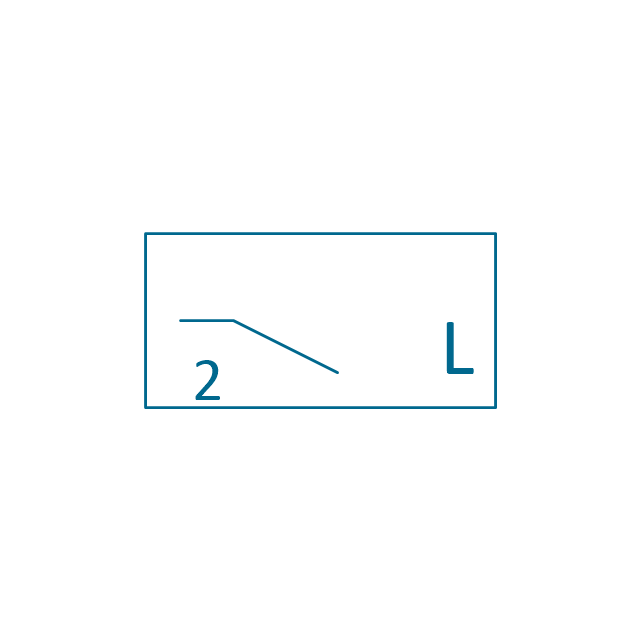
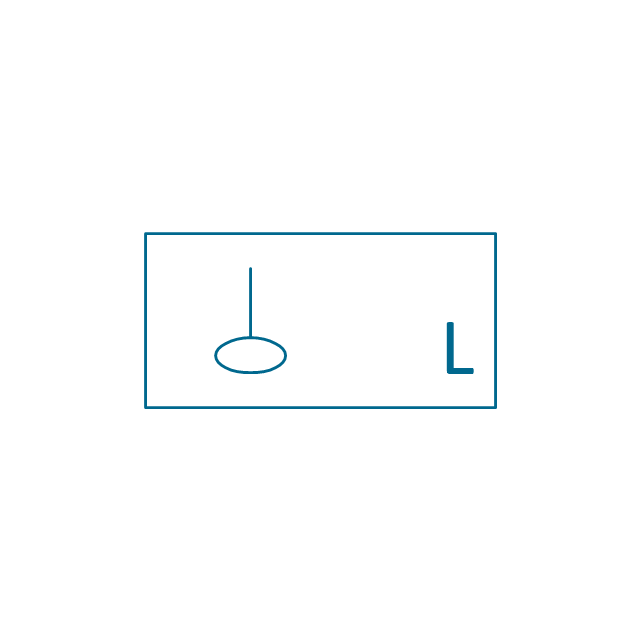
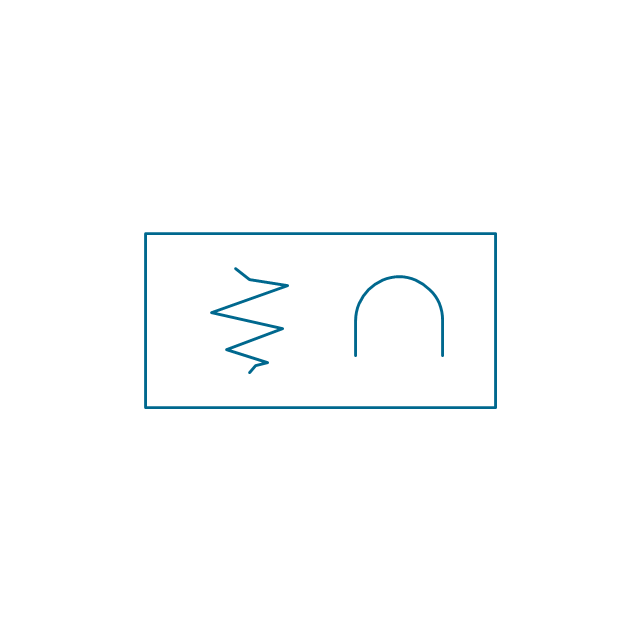
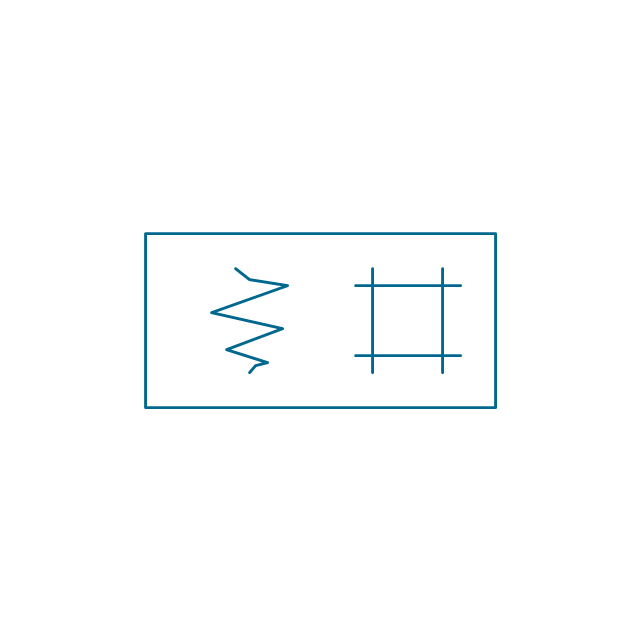
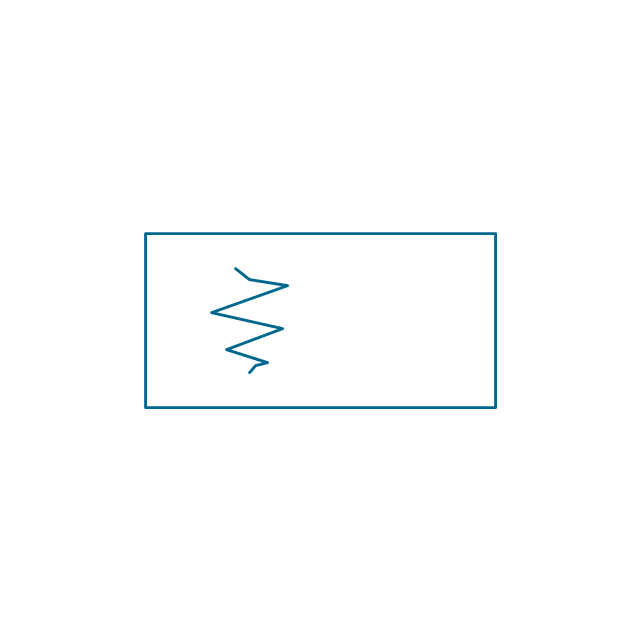
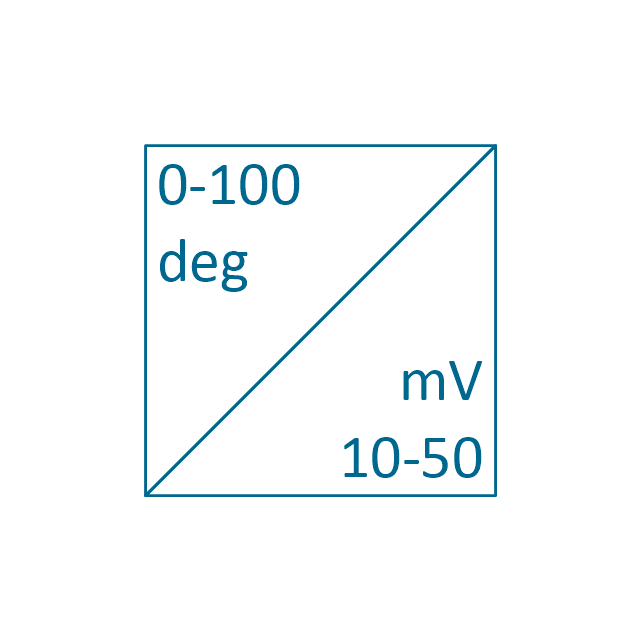
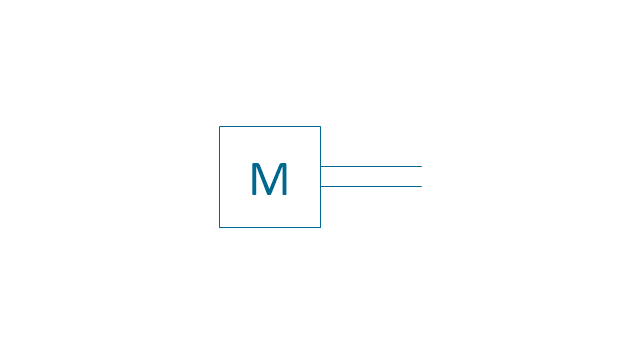
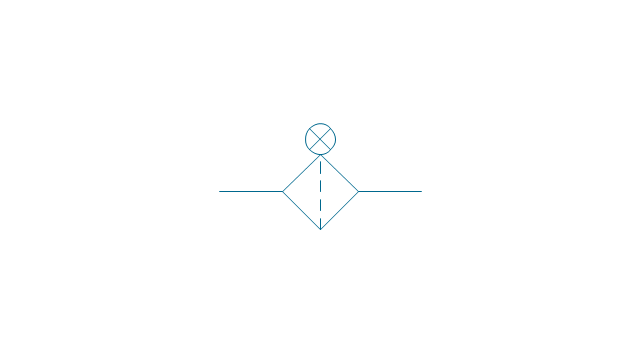
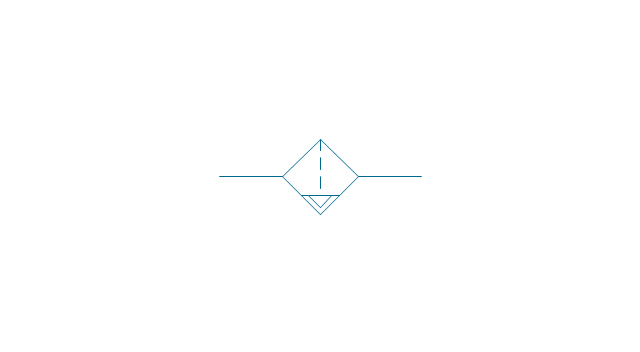
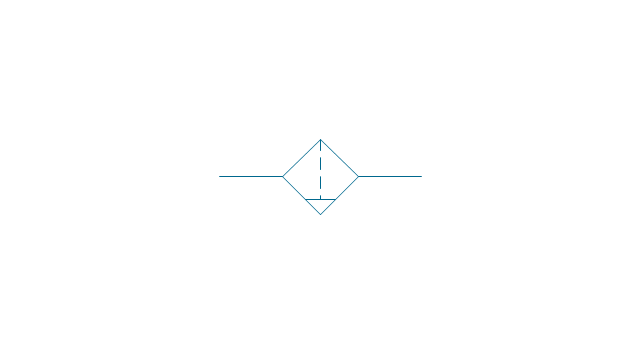
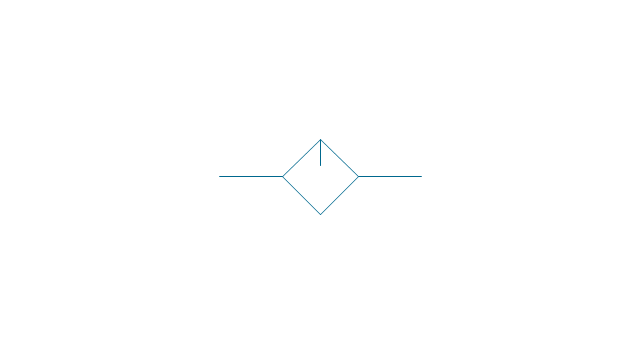
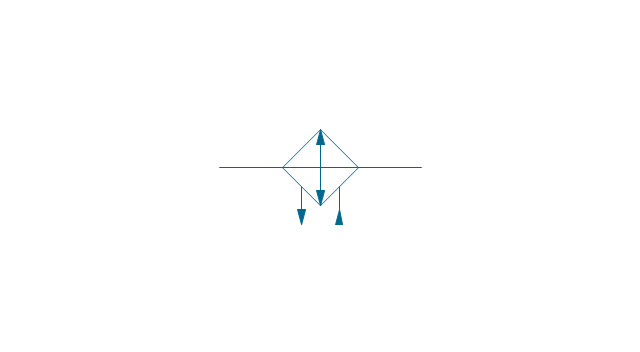
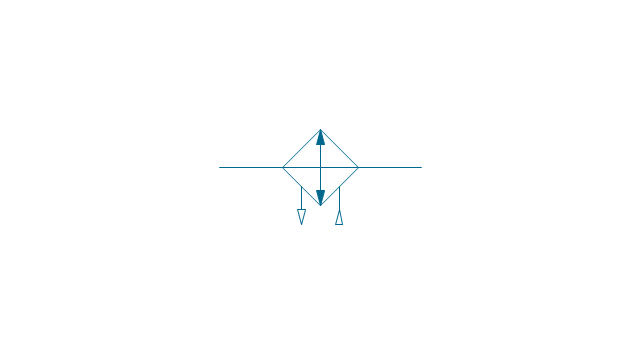
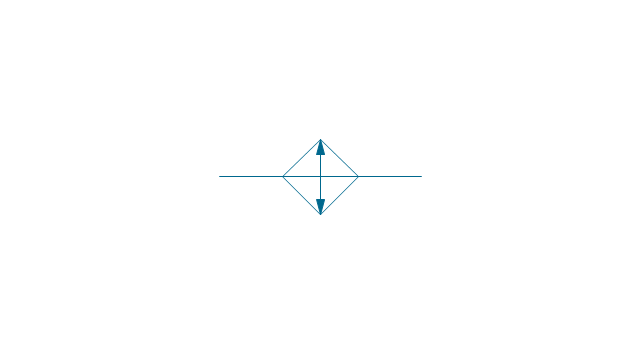
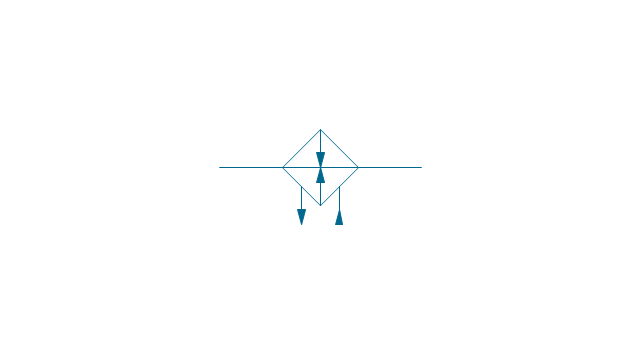
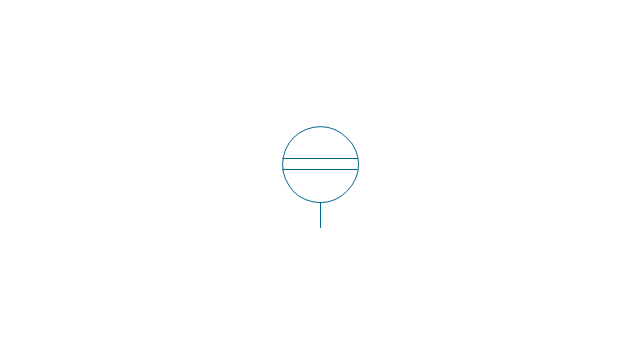
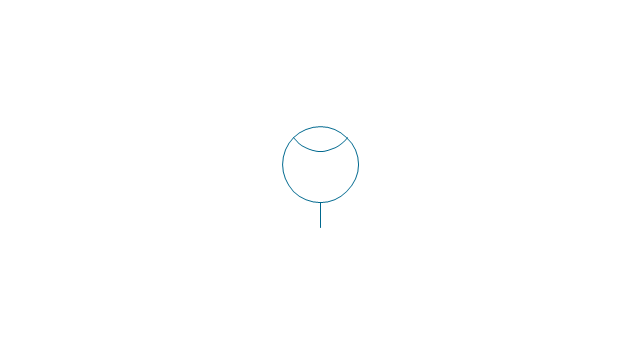
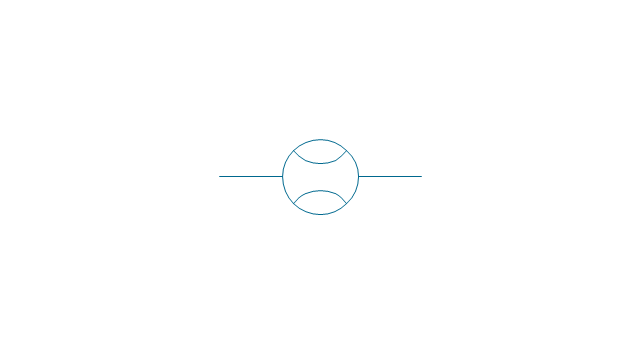
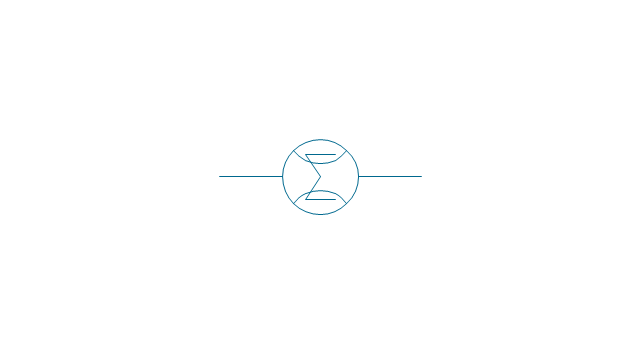
The vector stencils library "Instruments" contains 72 symbols of control instruments and measuring devices: meters and gauges, and callouts, text boxes, and inserts.
Use these shapes to create annotated process flow diagrams (PFD), flow control, manufacturing processes, and distribution system diagrams in the ConceptDraw PRO software extended with the Chemical and Process Engineering solution from the Chemical and Process Engineering area of ConceptDraw Solution Park.
www.conceptdraw.com/ solution-park/ engineering-chemical-process
Indicator local

Indicator remote
Indicator auxiliary
CRT local

CRT remote
CRT auxiliary
PLC local

PLC auxiliary

PLC remote

Computer local

Computer auxiliary

Computer remote

Light local

Light remote
Light auxiliary
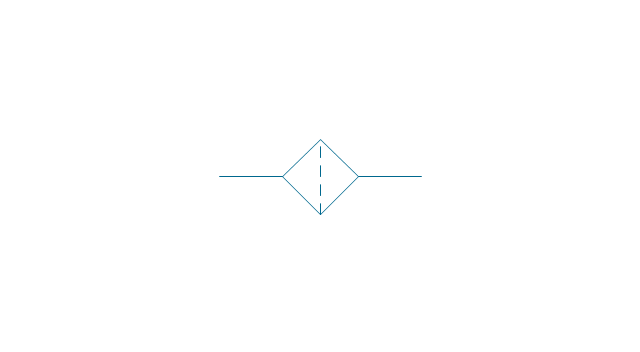
Indicator auxiliary (dashed)
-instruments---vector-stencils-library.png--diagram-flowchart-example.png)
Indicator remote (dashed)
-instruments---vector-stencils-library.png--diagram-flowchart-example.png)
Steam traced auxiliary

Steam traced remote

Steam traced local

Level meter auxiliary
Level meter remote
Level meter local

Pressure gauge diaphragm
Pressure gauge
Pressure gauge liquid filled
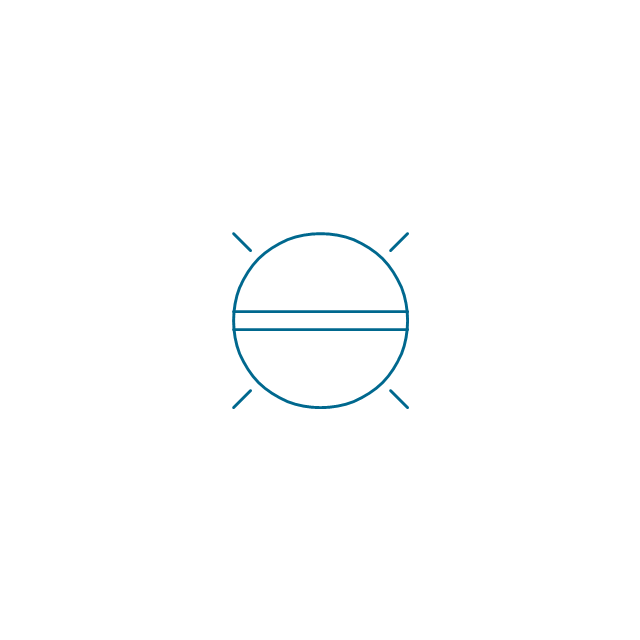
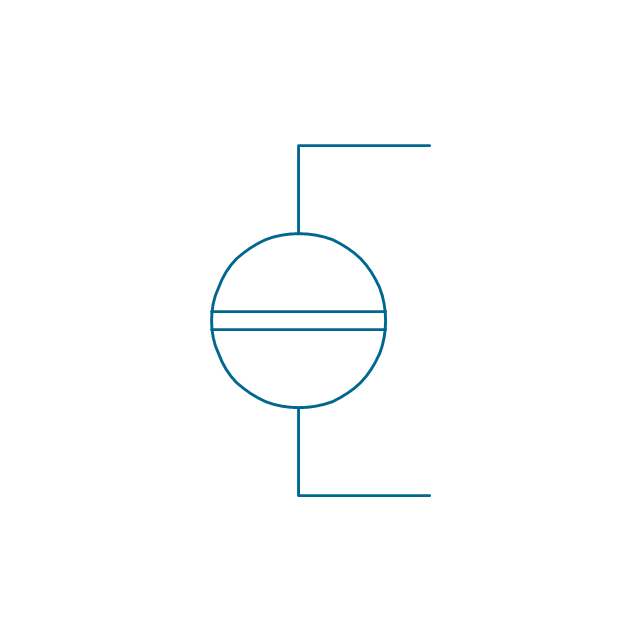
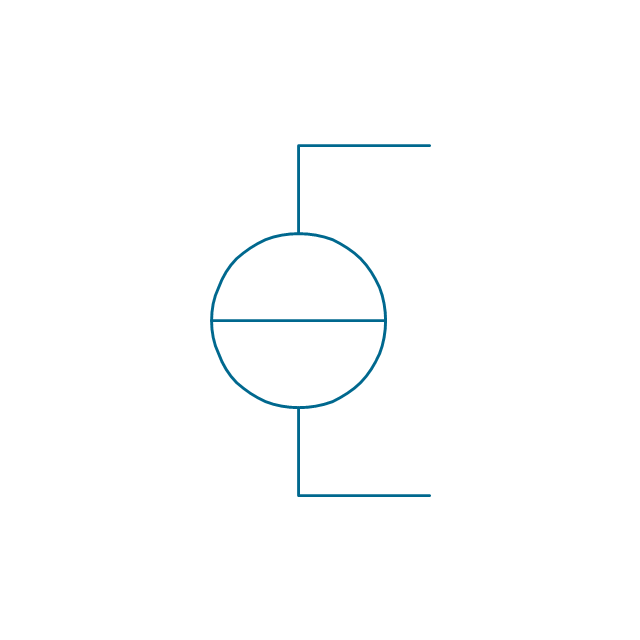
Strain gauge
Thermometer bi-metallic
Thermometer gas
Thermometer general

Thermometer glass

Thermometer liquid
Thermometer resistance
Thermometer thermocouple

Flowmeter electromagnetic

Flowmeter general

Flowmeter nozzle

Flowmeter orifice

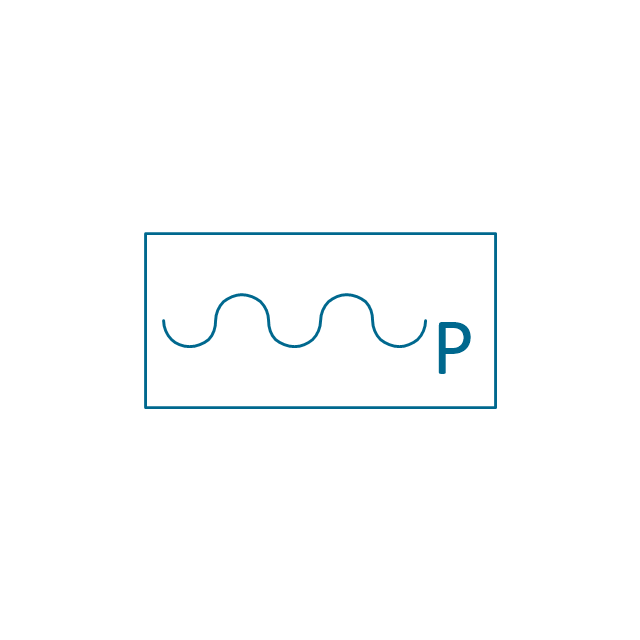
Flowmeter positive displacement
Flowmeter turbine

Flowmeter variable area
Flowmeter Venturi

Level meter capacitive

Level meter conductive
Level meter displacer

Level meter float
Level meter general

Level meter sonic

Indicator analoque

Indicator digital
Indicator general

Recorder analoque
Recorder digital
Recorder general
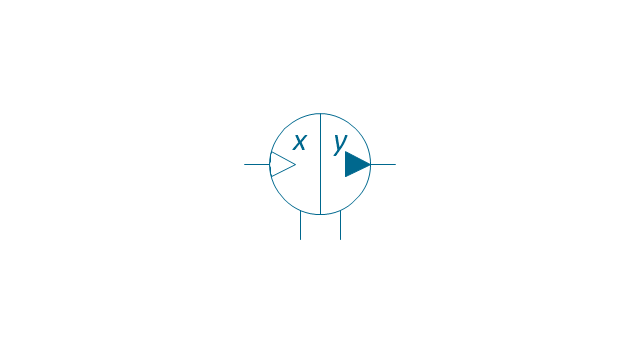
Converter
Converter 2 (1st half filled)
-instruments---vector-stencils-library.png--diagram-flowchart-example.png)
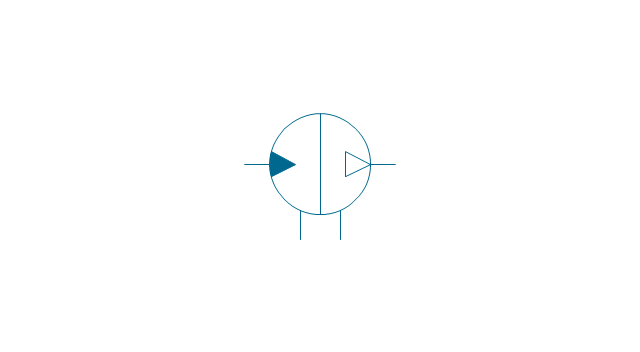
Converter 3 (2nd half filled)
-instruments---vector-stencils-library.png--diagram-flowchart-example.png)
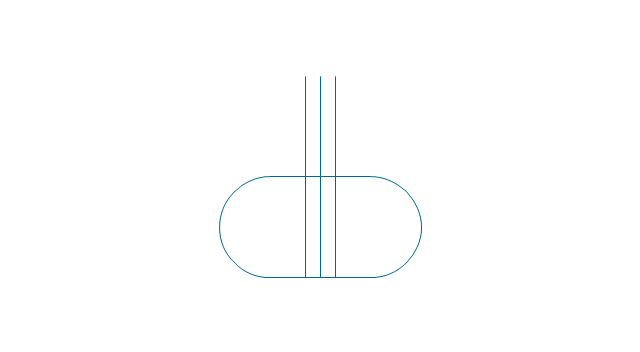
Venturi

Venturi (pressure taps)
-instruments---vector-stencils-library.png--diagram-flowchart-example.png)
Flowmeter

Rotameter

Vortex sensor

Propeller meter

Generic utility

Operator box

Operator box 2 (1st half filled)
-instruments---vector-stencils-library.png--diagram-flowchart-example.png)
Operator box 3 (2nd half filled)
-instruments---vector-stencils-library.png--diagram-flowchart-example.png)
AND gate

OR gate

NOT gate

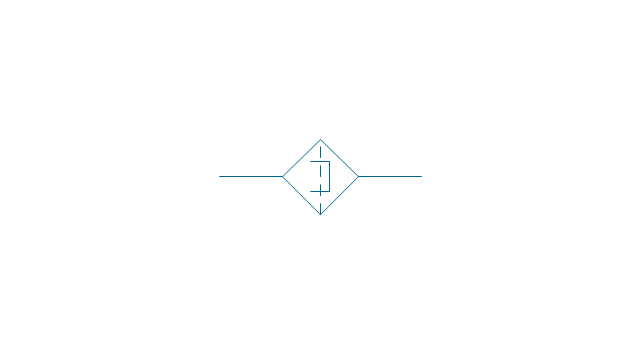
Correcting element

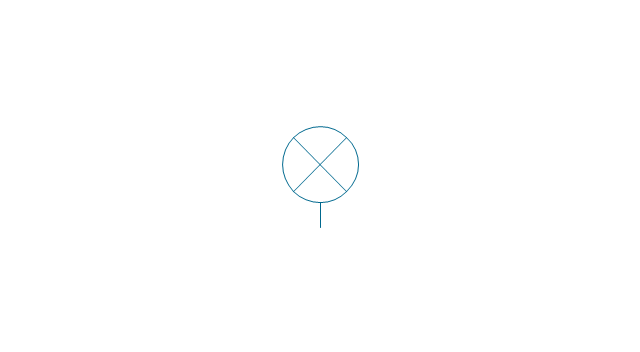
Diamond

The vector stencils library "Sales dashboard" contains 27 charts and graphic indicators.
Use it for drawing sales dashboards in the ConceptDraw PRO diagramming and vector drawing software extended with the Sales Dashboard solution from the Marketing area of ConceptDraw Solution Park.
Use it for drawing sales dashboards in the ConceptDraw PRO diagramming and vector drawing software extended with the Sales Dashboard solution from the Marketing area of ConceptDraw Solution Park.
Column Chart

Bar Chart

Line Chart

Divided Bar

Pie Chart

Two Bubbles Indicator

Speedometer Gauge 1

Speedometer Gauge 2

Speedometer Gauge 3

Speedometer Gauge 4

Slider Horizontal 1

Slider Horizontal 2

Slider Horizontal 3

Slider Horizontal 4

Slider Horizontal 5

Slider Horizontal 6

Slider Horizontal 7

Slider Vertical 1

Slider Vertical 2

Slider Vertical 3

Bullet 1

Bullet 2

Bullet 3

Bullet 4

Backgroung 1

Backgroung 2

Backgroung 3

The vector stencils library "Education indicators" contains 12 graphic indicators.
Use these visual indicators to design your educational infogram.
The vector stencils library "Education indicators" is included in the Education Infographics solution from the Business Infographics area of ConceptDraw Solution Park.
Use these visual indicators to design your educational infogram.
The vector stencils library "Education indicators" is included in the Education Infographics solution from the Business Infographics area of ConceptDraw Solution Park.
1-Sector donut chart

2-Sectors donut chart

1-Sector pie chart

2-Sectors pie chart

2-Bars horizontal bar chart

2-Columns arrow chart
Bullet indicator

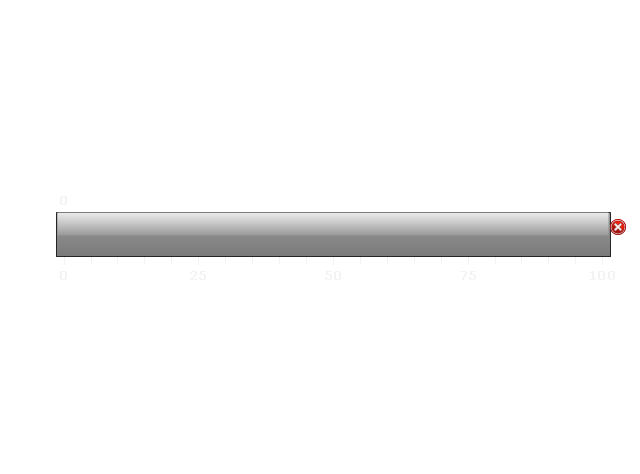
Progress bar

Radial gauge

Semi-radial gauge

Square chart 10x10 - filling from above

Stickman row pictograph

The vector stencils library "Sales dashboard" contains 27 charts and graphic indicators.
Use it for drawing sales dashboards in the ConceptDraw PRO diagramming and vector drawing software extended with the Sales Dashboard solution from the Marketing area of ConceptDraw Solution Park.
Use it for drawing sales dashboards in the ConceptDraw PRO diagramming and vector drawing software extended with the Sales Dashboard solution from the Marketing area of ConceptDraw Solution Park.
Column Chart
Bar Chart
Line Chart
Divided Bar
Pie Chart
Two Bubbles Indicator
Speedometer Gauge 1
Speedometer Gauge 2
Speedometer Gauge 3
Speedometer Gauge 4
Slider Horizontal 1
Slider Horizontal 2
Slider Horizontal 3
Slider Horizontal 4
Slider Horizontal 5
Slider Horizontal 6
Slider Horizontal 7
Slider Vertical 1
Slider Vertical 2
Slider Vertical 3
Bullet 1
Bullet 2
Bullet 3
Bullet 4
Backgroung 1
Backgroung 2
Backgroung 3
The vector stencils library "Education indicators" contains 12 graphic indicators.
Use these visual indicators to design your educational infogram.
The vector stencils library "Education indicators" is included in the Education Infographics solution from the Business Infographics area of ConceptDraw Solution Park.
Use these visual indicators to design your educational infogram.
The vector stencils library "Education indicators" is included in the Education Infographics solution from the Business Infographics area of ConceptDraw Solution Park.
1-Sector donut chart
2-Sectors donut chart
1-Sector pie chart
2-Sectors pie chart
2-Bars horizontal bar chart
2-Columns arrow chart
Bullet indicator
Progress bar
Radial gauge
Semi-radial gauge
Square chart 10x10 - filling from above
Stickman row pictograph
The vector stencils library "Management indicators" contains 14 visual indicators.
Use it to create your management infogram in the ConceptDraw PRO diagramming and vector drawing software.
The example "Management indicators - Vector stencils library" is included in the solution "Marketing infographics" from the "Business infographics" area of ConceptDraw Solution Park.
Use it to create your management infogram in the ConceptDraw PRO diagramming and vector drawing software.
The example "Management indicators - Vector stencils library" is included in the solution "Marketing infographics" from the "Business infographics" area of ConceptDraw Solution Park.
1-Sector donut chart

1-Sector pie chart

2-Bars horizontal bar chart

2-Columns arrow chart
2-Columns arrow chart 2
2-Sectors donut chart

2-Sectors pie chart

Bullet indicator

Progress bar

Radial gauge

Semi-radial gauge

Square chart 10x10 - filling from above

Square chart 10x10 - filling from below

Stickman row pictograph

The vector stencils library "Management indicators" contains 14 visual indicators.
Use it to create your management infogram in the ConceptDraw PRO diagramming and vector drawing software.
The example "Management indicators - Vector stencils library" is included in the solution "Marketing infographics" from the "Business infographics" area of ConceptDraw Solution Park.
Use it to create your management infogram in the ConceptDraw PRO diagramming and vector drawing software.
The example "Management indicators - Vector stencils library" is included in the solution "Marketing infographics" from the "Business infographics" area of ConceptDraw Solution Park.
1-Sector donut chart
1-Sector pie chart
2-Bars horizontal bar chart
2-Columns arrow chart
2-Columns arrow chart 2
2-Sectors donut chart
2-Sectors pie chart
Bullet indicator
Progress bar
Radial gauge
Semi-radial gauge
Square chart 10x10 - filling from above
Square chart 10x10 - filling from below
Stickman row pictograph
This vector stencils library contains 195 cloud computing icons.
Use it to design cloud computing infographic and diagrams with ConceptDraw PRO software.
"Cloud computing, also on-demand computing, is a kind of Internet-based computing that provides shared processing resources and data to computers and other devices on demand. It is a model for enabling ubiquitous, on-demand access to a shared pool of configurable computing resources (e.g., networks, servers, storage, applications and services), which can be rapidly provisioned and released with minimal management effort. Cloud computing and storage solutions provide users and enterprises with various capabilities to store and process their data in third-party data centers.
Cloud computing has become a highly demanded service or utility due to the advantages of high computing power, cheap cost of services, high performance, scalability, accessibility as well as availability." [Cloud computing. Wikipedia]
The vector stencils library "Cloud clipart" is included in the Cloud Computing Diagrams solution from the Computer and Networks area of ConceptDraw Solution Park.
Access point

Airport

Alert

Banknote

Banknote bundle

Banknote bundles

Backup

Bar chart

Big data

Book (closed)
-cloud-clipart---vector-stencils-library.png--diagram-flowchart-example.png)
Book (open)
-cloud-clipart---vector-stencils-library.png--diagram-flowchart-example.png)
Books

Box, close

Box, open

Braces

Brackets

Bug

Building

Bus

Cable connection

Calculator

Calendar

Car

CD/DVD

Check list

Check mark

Clock

Cloud

Cloud computing

Cloud database

Cloud hosting

Cloud storage

Code

Coffee cup

Coin

Coins stack

Coins stacks

Communication

Computer terminal

Console

CPU

Credit card

Cubes

Dashboard

Database

Databases

Datacenter

Dialog box

Dialog boxes

Document

Documents

Dollar sign

Download

Earth

Email

Equal sign

Ethernet jack

Ethernet plug

Euro sign

Exclamation mark

Eye

Feed symbol

Feedback

File

Files

Filter

Firewall

Flash drive

Folder

Folders

Gamepad

Gauge

Gear

Gears, 2

Gears, 3

Globe

Hacker

Hard drive

Heart

Heart rhythm

Home

Hosting

Hotel

House

Image

Info

IP phone

Jet

Key

Keyboard

Laptop

Lego

Letter

Light bulb

Lightning

Line chart

Linux penguin

List

Load balancer

Location mark

Lock, close

Lock, open

Lock and key

Log

Login

Logout

Magnifying glass

Mail

Map

Memory (RAM)
-cloud-clipart---vector-stencils-library.png--diagram-flowchart-example.png)
Microphone

Minus sign

Mobile phone

Monitor

Mouse

Movie

Music

Music player

Network

Network bus

Newspaper

NIC (Network interface controller)
-cloud-clipart---vector-stencils-library.png--diagram-flowchart-example.png)
Not found (Error 404)
-cloud-clipart---vector-stencils-library.png--diagram-flowchart-example.png)
Notebook

Office printer

Operator

Page

Pages

PC

Pencil

Photo

Photo camera

Pie chart

Platform

Plus sign

Pound sign

Printer

Puzzle

Puzzles, 2x2

Puzzles, 3x3

Question sign

Rackmount server

Router

Safe

Satellite

Satellite antenna

Schedule

Sensor

Server

Server rack

Shield

Ship

Shopping bag

Shopping basket

Shopping cart

Sign up

Smartphone

Social network

Software box

Sound

Spider

Spreadsheet

SSD

Star

Stars, 5

Stethoscope

Stickman

Stickmen

Suitcase

Support

Switch

Syringe

Tablet computer

Tools

Train

Truck

Truck 2

TV

Umbrella

Upload

User man

User woman

User profile

Video

Video camera

Video mail

Virtual disk

Virus

Wallet

Web camera

Wifi antenna

Wireless

Wrench

X cross symbol

Yen sign

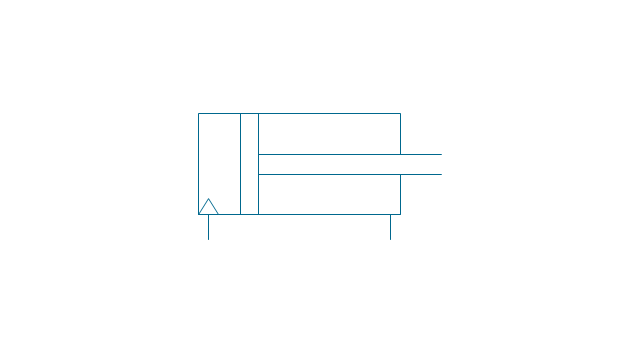
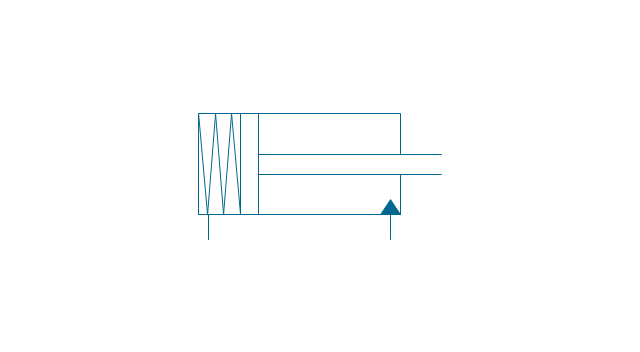
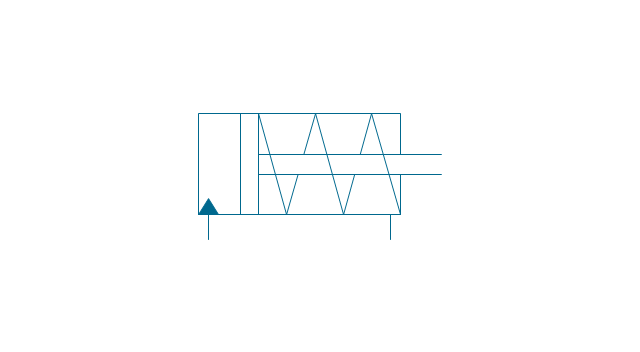
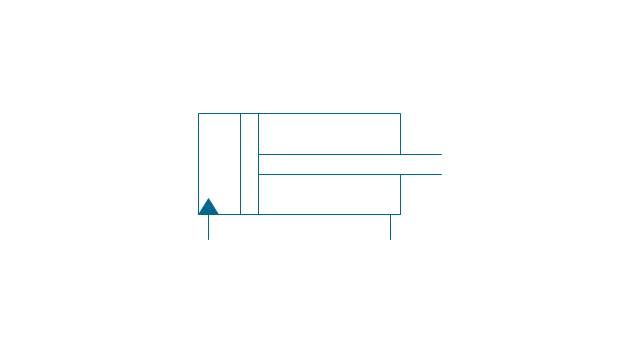
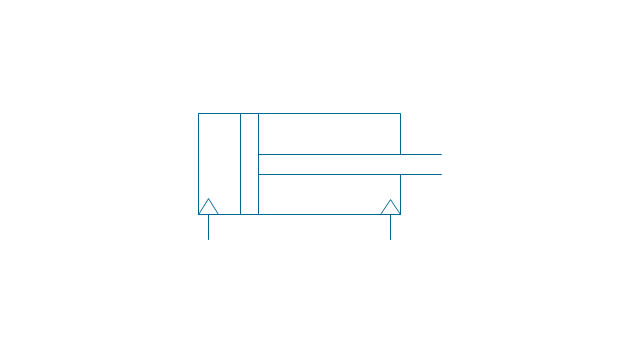
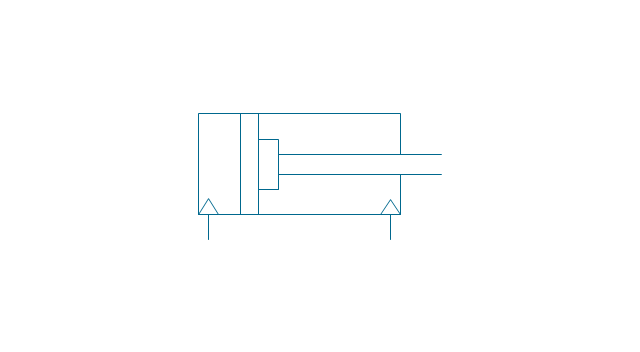
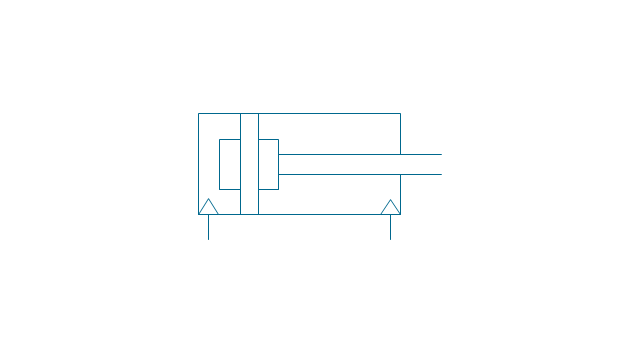
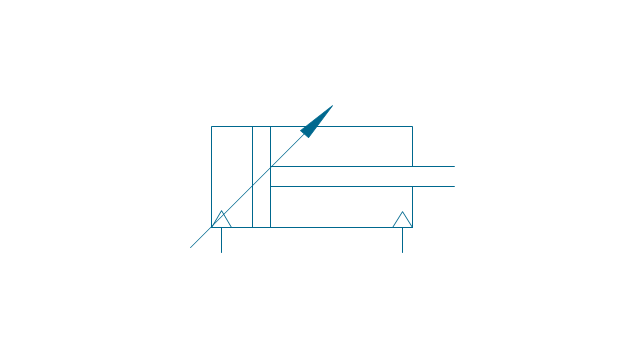
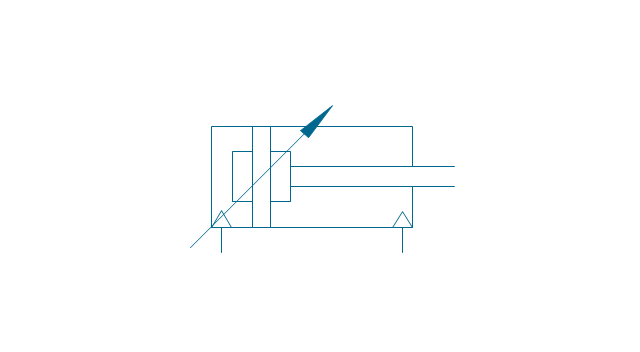
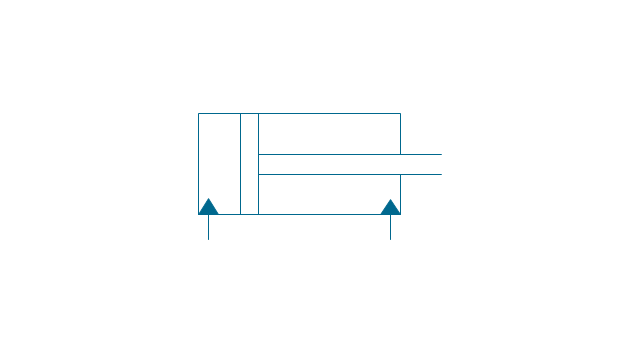
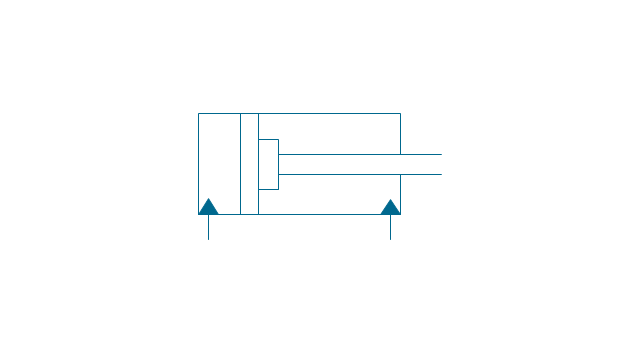
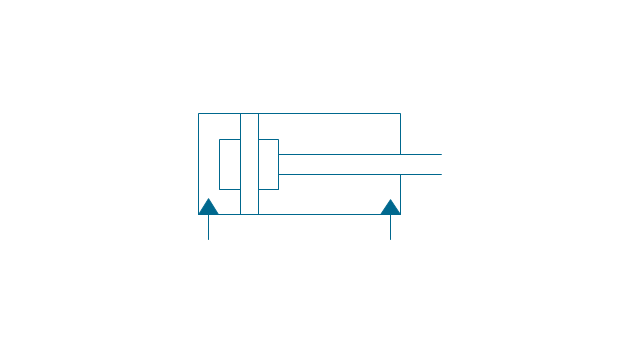
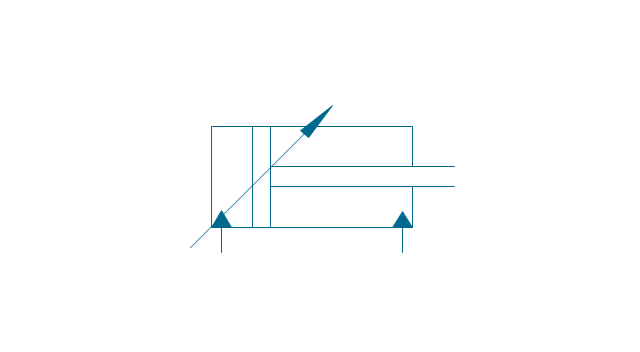
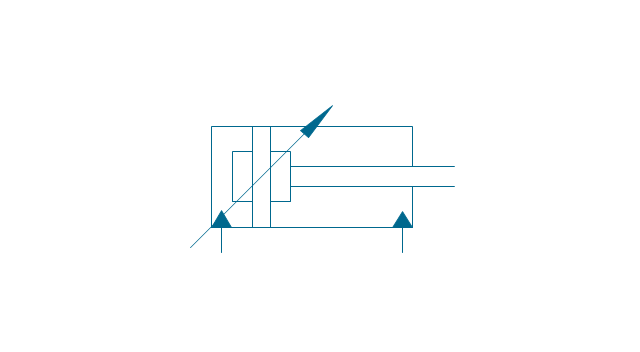
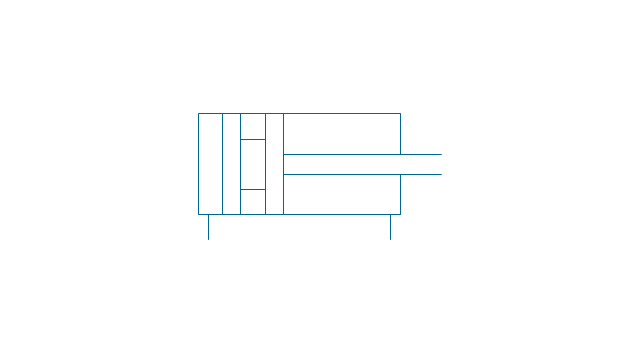
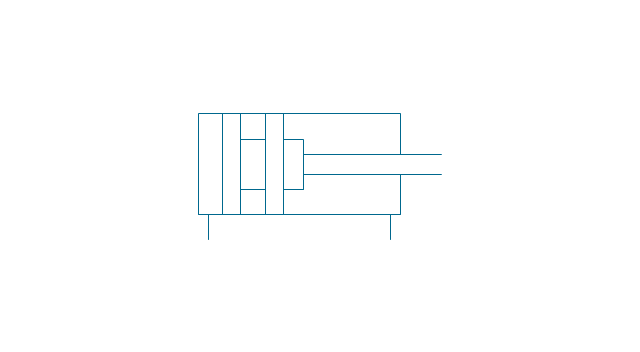
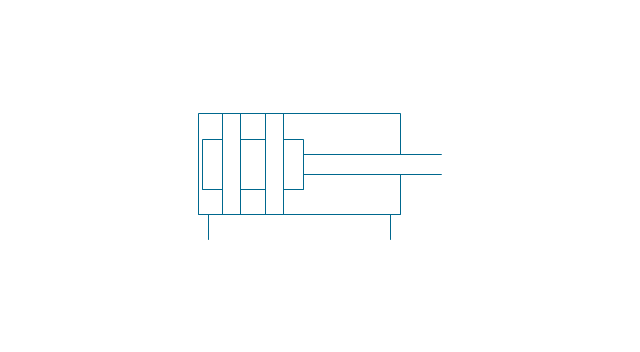
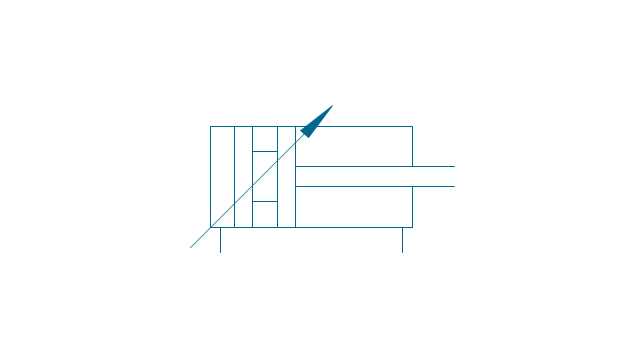
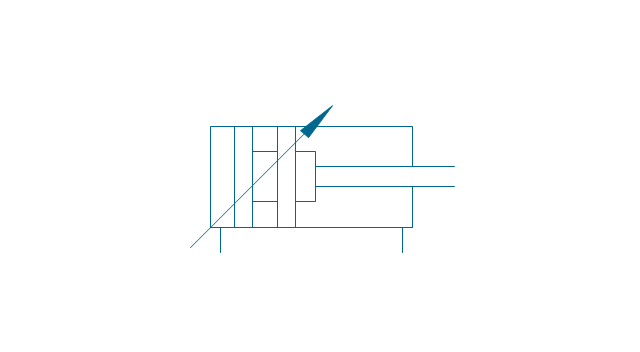
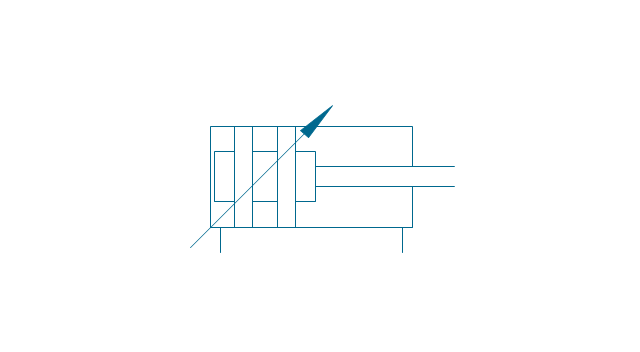
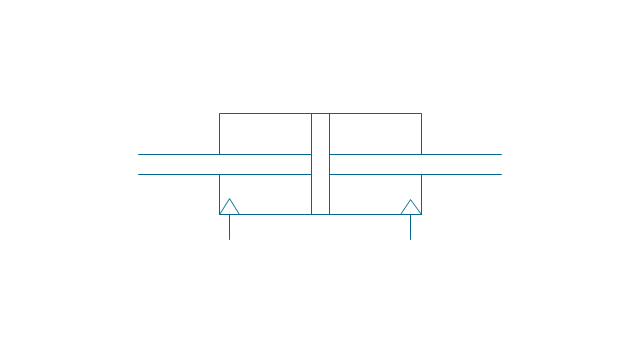
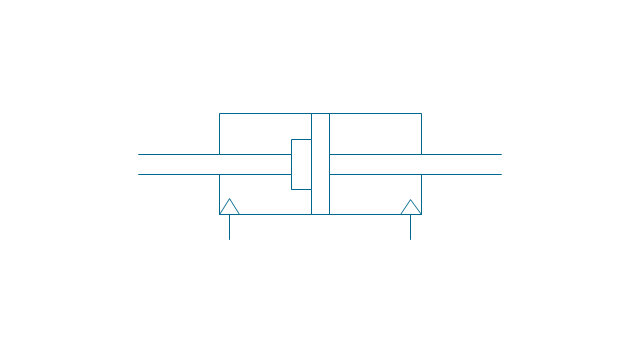
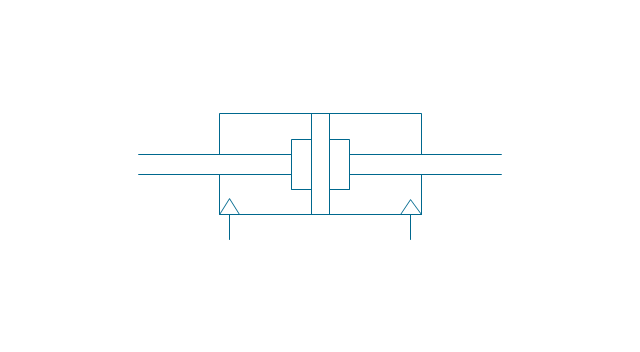
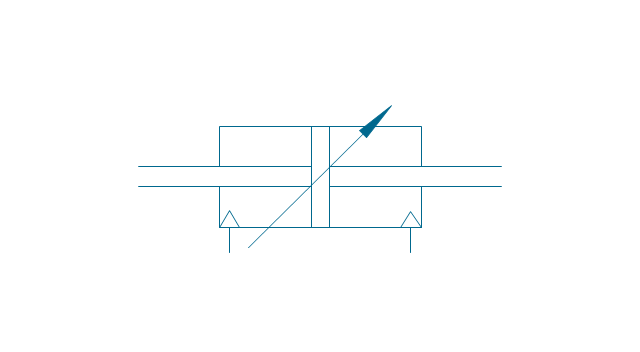
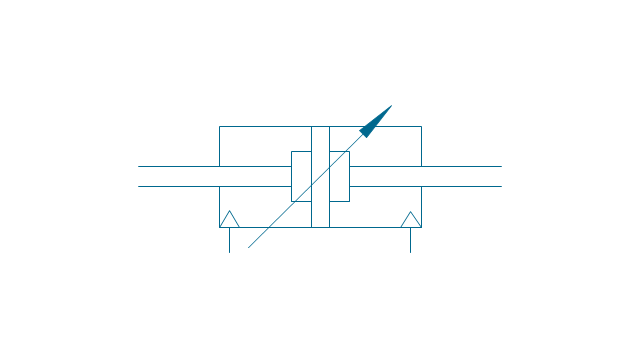
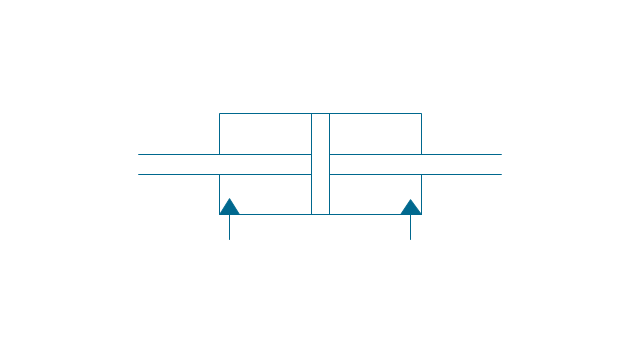
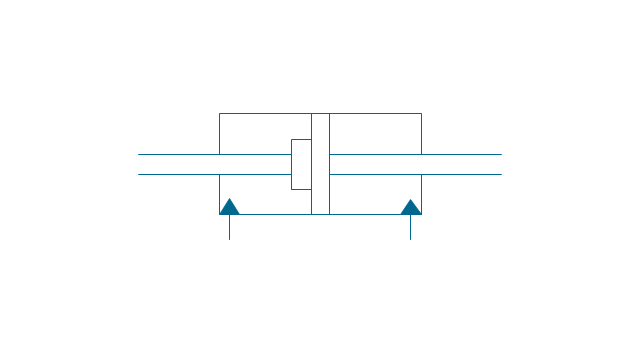
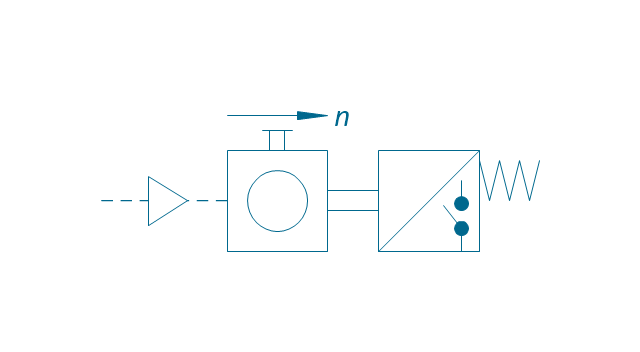
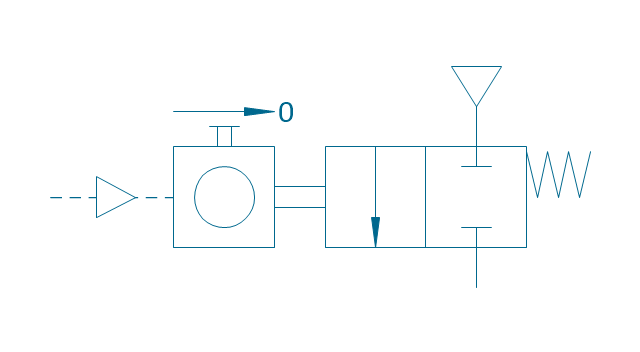
The vector stencils library "Fluid power equipment" contains 113 symbols of hydraulic and pneumatic equipment including pumps, motors, air compressors, cylinders, meters, gauges, and actuators.
Use it to design fluid power and hydraulic control systems in the ConceptDraw PRO diagramming and vector drawing software extended with the Mechanical Engineering solution from the Engineering area of ConceptDraw Solution Park.
www.conceptdraw.com/ solution-park/ engineering-mechanical
Use it to design fluid power and hydraulic control systems in the ConceptDraw PRO diagramming and vector drawing software extended with the Mechanical Engineering solution from the Engineering area of ConceptDraw Solution Park.
www.conceptdraw.com/ solution-park/ engineering-mechanical
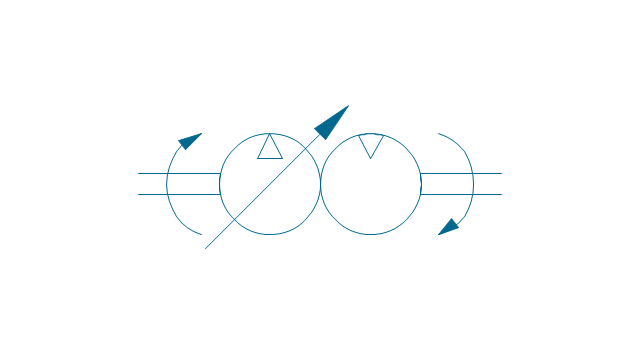
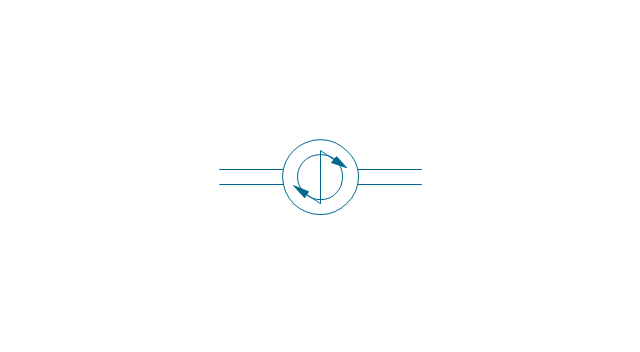
Actuator (semi-rotary), pneumatic
,-pneumatic-fluid-power-equipment---vector-stencils-library.png--diagram-flowchart-example.png)
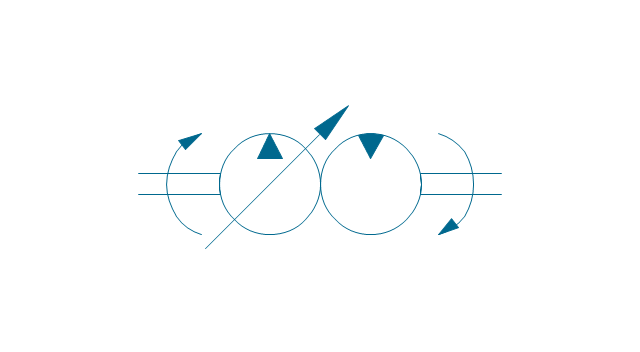
Actuator (semi-rotary), hydraulic
,-hydraulic-fluid-power-equipment---vector-stencils-library.png--diagram-flowchart-example.png)
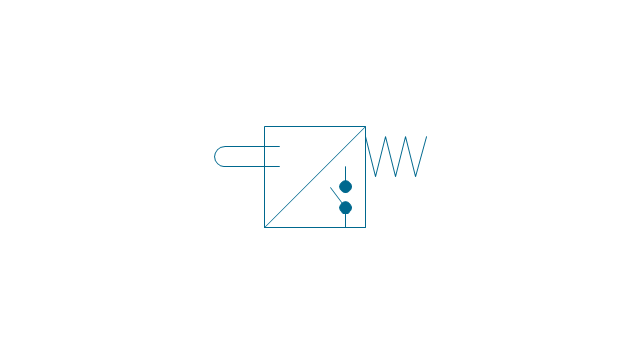
Drive unit, pneumatic
Drive unit, hydraulic
Sgl-act. cylinder, pneum., left spring
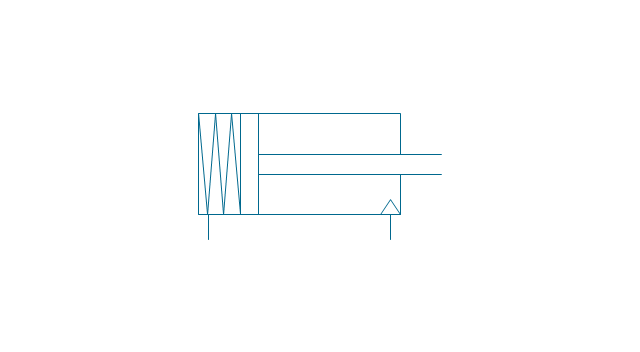
Sgl-act. cylinder, pneum., right spring
Sgl-act. cylinder, pneumatic
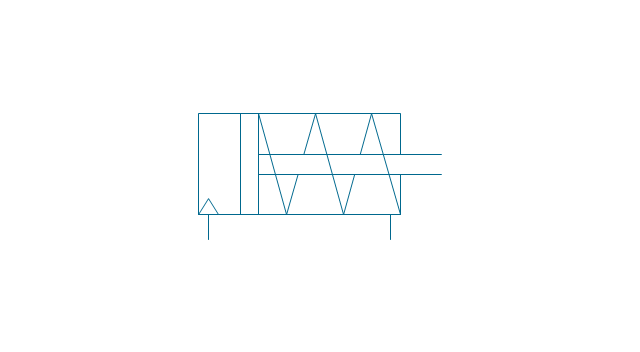
Sgl-act. cylinder, hydr., left spring
Sgl-act. cylinder, hydr., right spring
Sgl-act. cylinder, hydraulic
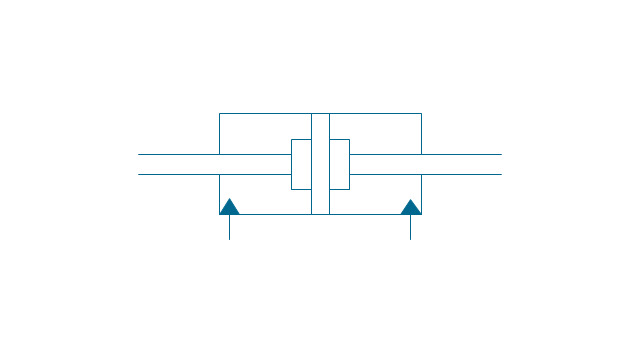
Dbl-act. cylinder, pneumatic
Dbl-act. cylinder, pneum., sgl cushion
Dbl-act. cylinder, pneum., dbl cushion
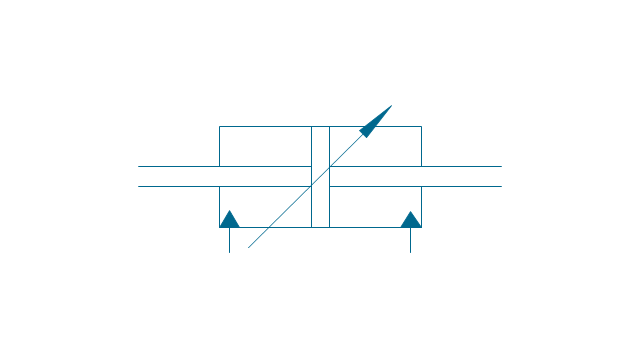
Dbl-act. cylinder, pneum., adjustable
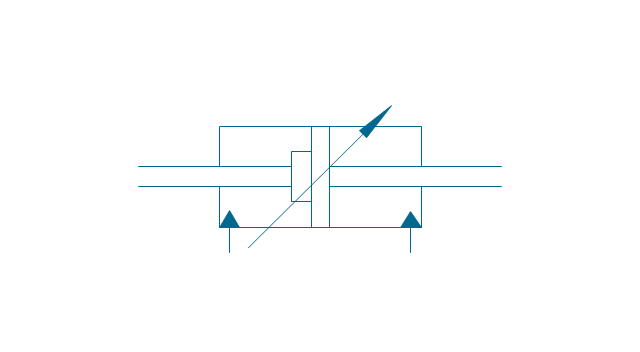
Dbl-act. cylinder, pneum., sgl cushion, adj.
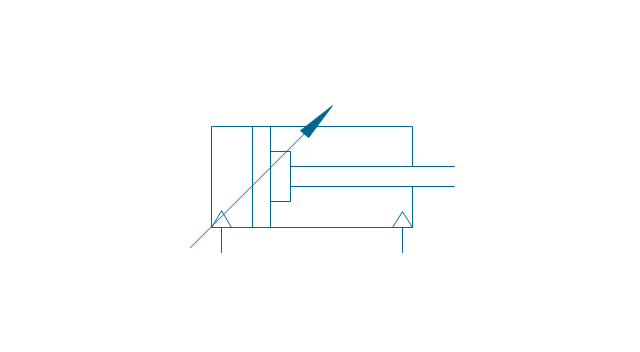
Dbl-act. cylinder, pneum., dbl cushion, adj.
Dbl-act. cylinder, hydraulic
Dbl-act. cylinder, hydr., sgl cushion
Dbl-act. cylinder, hydr., dbl cushion
Dbl-act. cylinder, hydr., adjustable
Dbl-act. cylinder, hydr., sgl cushion, adj.

Dbl-act. cylinder, hydr., dbl cushion, adj.
Dbl-act. cylinder, magnetic
Dbl-act. cylinder, magn., sgl cushion
Dbl-act. cylinder, magn., dbl cushion
Dbl-act. cylinder, magn., adjustable
Dbl-act. cylinder, magn., sgl cushion, adj.
Dbl-act. cylinder, magn., dbl cushion, adj.
Dbl-act. dbl-end. cylinder, pneumatic
Dbl-act. dbl-end. cylinder, pneum., sgl cushion
Dbl-act. dbl-end. cylinder, pneum., dbl cushion
Dbl-act. dbl-end. cylinder, pneum., adjustable
Dbl-act. dbl-end. cylinder, pneum., sgl cushion, adj.

Dbl-act. dbl-end. cylinder, pneum., dbl cushion, adj.
Dbl-act. dbl-end. cylinder, hydraulic
Dbl-act. dbl-end. cylinder, hydr., sgl cushion
Dbl-act. dbl-end. cylinder, hydr., dbl cushion
Dbl-act. dbl-end. cylinder, hydr., adjustable
Dbl-act. dbl-end. cylinder, hydr., sgl cushion, adj.
Dbl-act. dbl-end. cylinder, hydr., dbl cushion, adj.

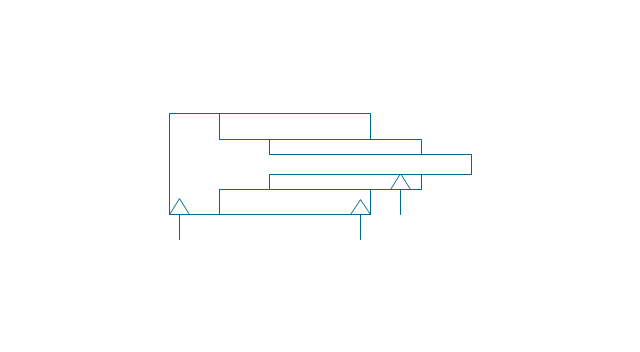
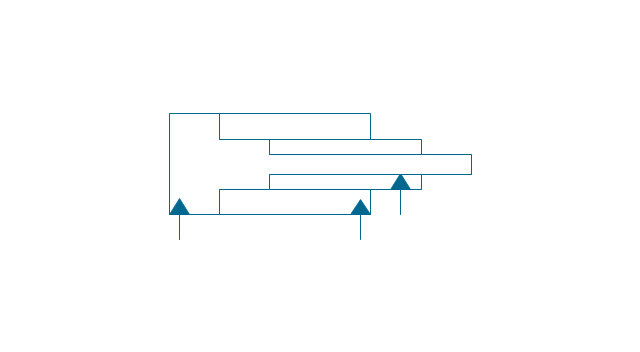
Telescopic cylinder, pneum., dbl-act.
Telescopic cylinder, hydr., dbl-act.
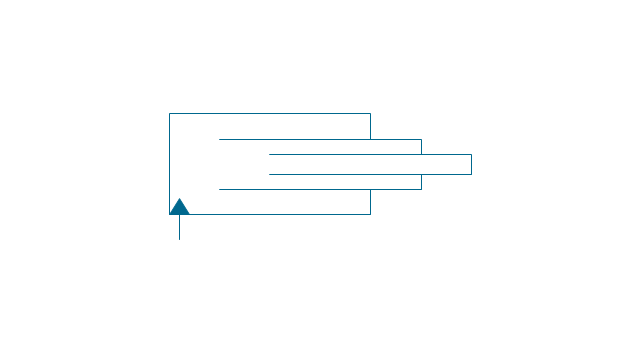
Telescopic cylinder, pneum., sgl-act.

Telescopic cylinder, hydr., sgl-act.
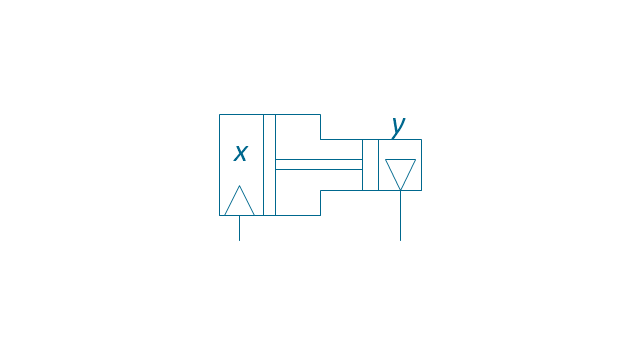
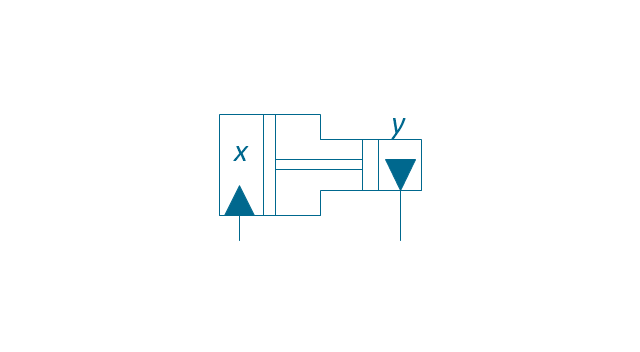
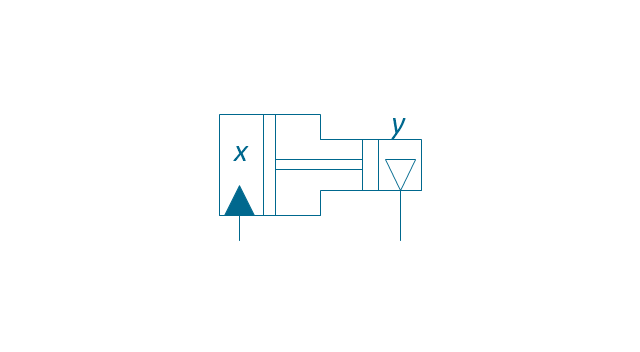
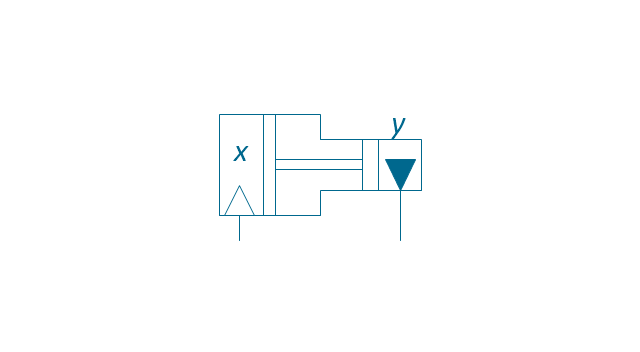
Actuator, hydraulic-pneumatic
Actuator, pneumatic-hydraulic
Intensifier, pneumatic
Intensifier, hydraulic
Intensifier, hydraulic-pneumatic
Intensifier, pneumatic-hydraulic
Intensifier, pneumatic-hydraulic
Intensifier, hydraulic-pneumatic

Actuator, pneumatic-hydraulic

Actuator, hydraulic-pneumatic
Accumulator

Accumulator, gas loaded
Accumulator, spring loaded
Accumulator, auxiliary gas bottle

Air receiver

Energy source, pneumatic

Energy source, hydraulic

Energy source, electric motor

Energy source, non-electric prime mover
Vented reservoir

Sealed reservoir
Filter
Filter, magnetic element
Filter, contamination indicator
Automatic drain filter separator
Manual drain filter separator
Separator, automatic drain

Separator, manual drain

Air dryer

Lubricator
Air service unit, filter, separator
Air service unit, separator
Air service unit, filter
Air service unit
Liquid cooler
Gas cooler
Cooler
Liquid heater
Gas heater
Heater
Liquid temperature controller
Gas temperature controller
Temperature controller
Liquid temperature controller 2
Gas temperature controller 2
Temperature controller 2

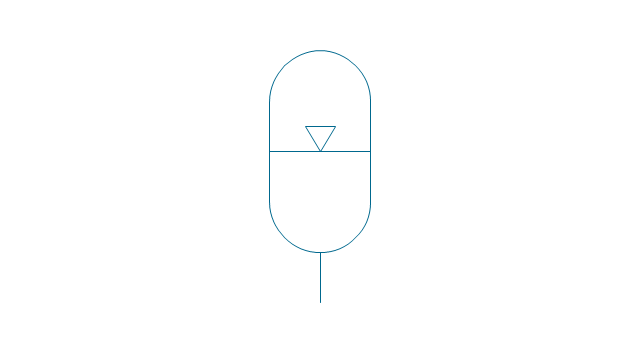
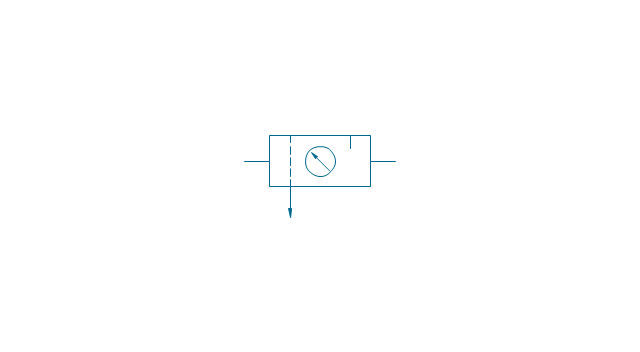
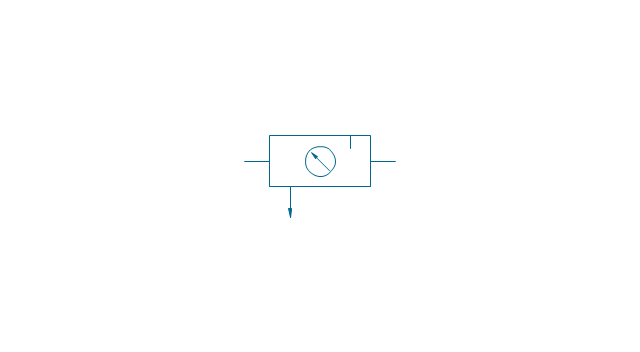
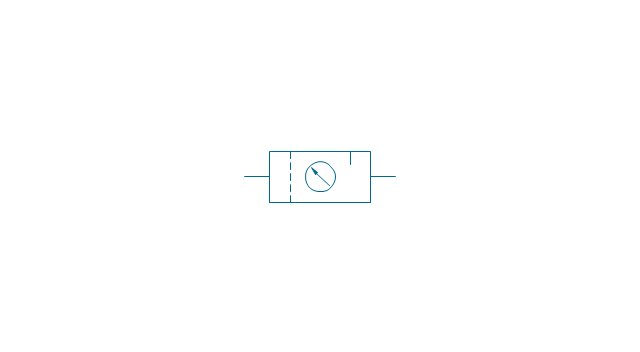
Pressure indicator
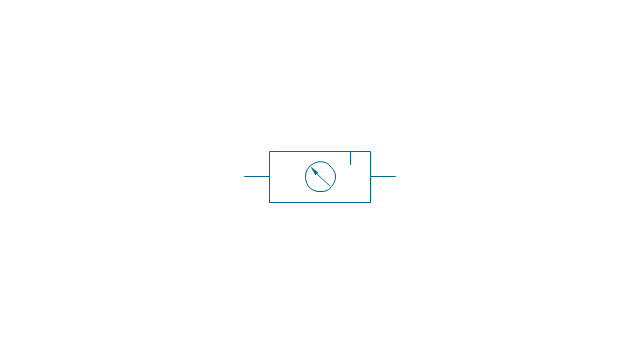
Pressure gauge

Differential pressure gauge

Thermometer

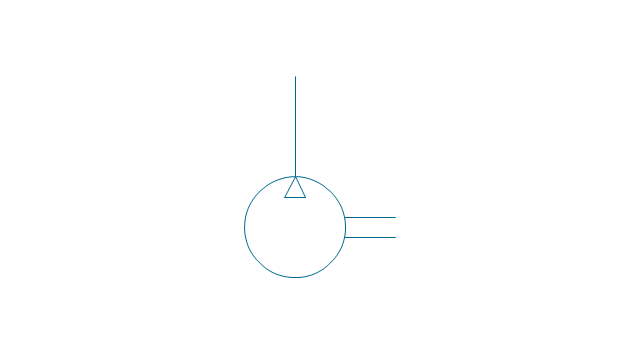
Liquid level measuring instrument
Flow indicator
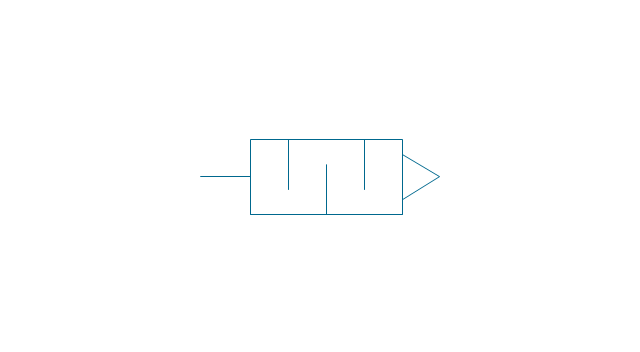
Flow meter
Integrating flow meter
Tachometer

Torque measurement equipment
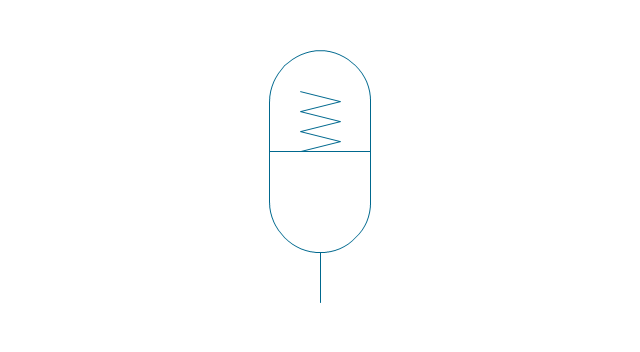
Pressure switch

Limit switch
Transducer

Pulse counter
Pulse counter 2
Silencer
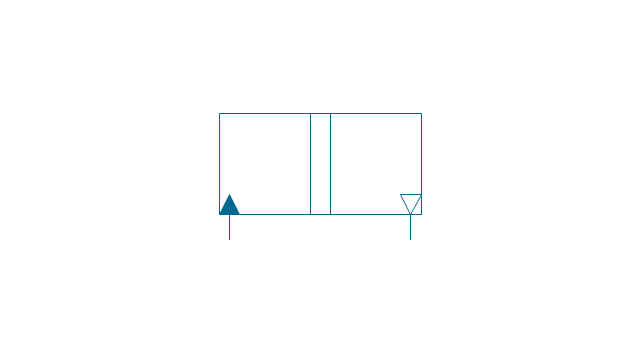
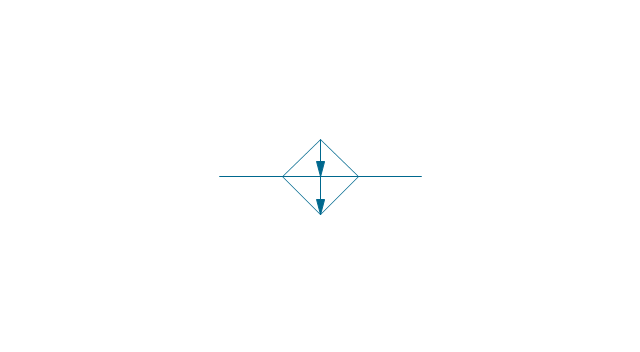
Drain (inlet below fluid, drain line)
-fluid-power-equipment---vector-stencils-library.png--diagram-flowchart-example.png)
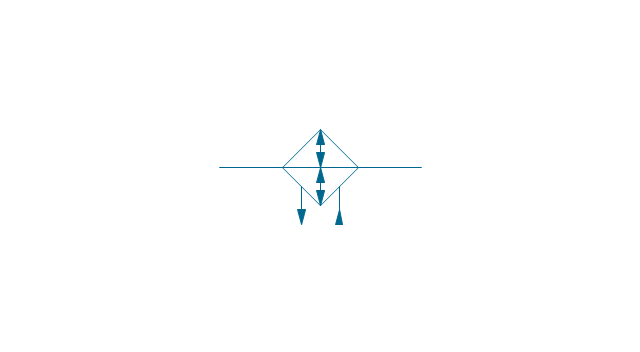
Drain (inlet below fluid, return line)
-fluid-power-equipment---vector-stencils-library.png--diagram-flowchart-example.png)
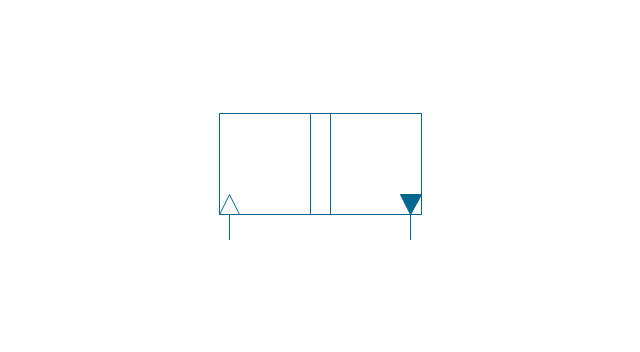
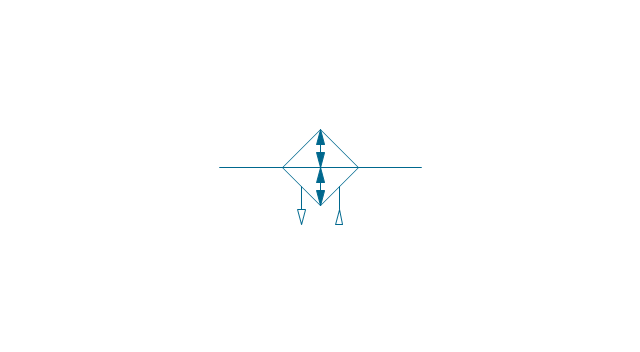
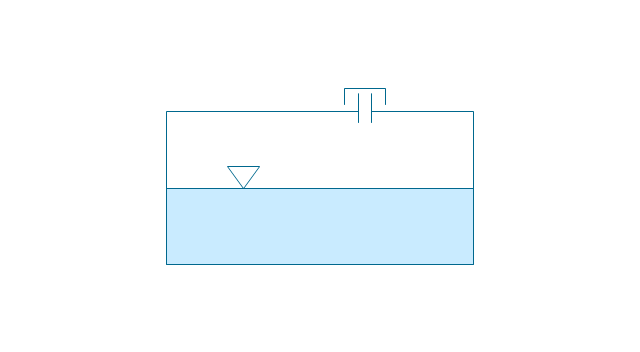
Drain (inlet above fluid, drain line)
-fluid-power-equipment---vector-stencils-library.png--diagram-flowchart-example.png)
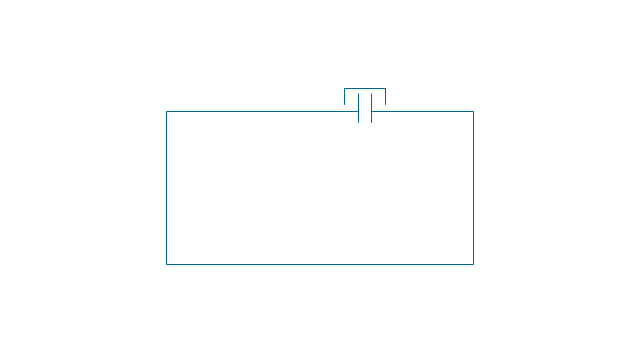
Drain (inlet above fluid, return line)
-fluid-power-equipment---vector-stencils-library.png--diagram-flowchart-example.png)
Oil tank
Oil tank, empty
Air compressor
The vector stencils library "Sales KPIs and Metrics" contains 15 chart templates and graphic indicators of sales key performance indicators (KPIs) and metrics.
Use it for drawing sales dashboards in the ConceptDraw PRO diagramming and vector drawing software extended with the Sales Dashboard solution from the Marketing area of ConceptDraw Solution Park.
Use it for drawing sales dashboards in the ConceptDraw PRO diagramming and vector drawing software extended with the Sales Dashboard solution from the Marketing area of ConceptDraw Solution Park.
Actual vs Plan

Average Purchase Value

Clicks from Sales Follow-Up Emails

Cost per customer

Cost per order

Lead Response Time

Opportunity-to-Win Ratio

Product mix

Product Performance

Rate of Contact

Rate of Follow Up Contact

Sales Growth

Sales Target

Social Media Usage

Usage Rate of Marketing Collateral

The vector stencils library "Meter indicators" contains 29 Live Objects: speedometer gauge, dial, bullet graph, slider and level meter visual indicators.
The Live Objects designed to display actual measures of performance metrics and KPIs from external data source files.
Some of them also display comparative measures, and colored zones of qualitative ranges with legend.
Use it to draw business performance dashboards using the ConceptDraw PRO diagramming and vector drawing software .
"Digital dashboards may be laid out to track the flows inherent in the business processes that they monitor. Graphically, users may see the high-level processes and then drill down into low level data. This level of detail is often buried deep within the corporate enterprise and otherwise unavailable to the senior executives. ...
Specialized dashboards may track all corporate functions. Examples include human resources, recruiting, sales, operations, security, information technology, project management, customer relationship management and many more departmental dashboards. ...
Like a car's dashboard (or control panel), a software dashboard provides decision makers with the input necessary to "drive" the business. Thus, a graphical user interface may be designed to display summaries, graphics (e.g., bar charts, pie charts, bullet graphs, "sparklines," etc.), and gauges (with colors similar to traffic lights) in a portal-like framework to highlight important information. ...
Digital dashboards allow managers to monitor the contribution of the various departments in their organization. To gauge exactly how well an organization is performing overall, digital dashboards allow you to capture and report specific data points from each department within the organization, thus providing a "snapshot" of performance." [Dashboard (management information systems). Wikipedia]
The example "Design elements - Meter indicators" is included in the Meter Dashboard solution from the area "What is a Dashboard" of ConceptDraw Solution Park.
Visual indicators

This vector stencils library contains 195 cloud computing icons.
Use it to design cloud computing infographic and diagrams with ConceptDraw PRO software.
"Cloud computing, also on-demand computing, is a kind of Internet-based computing that provides shared processing resources and data to computers and other devices on demand. It is a model for enabling ubiquitous, on-demand access to a shared pool of configurable computing resources (e.g., networks, servers, storage, applications and services), which can be rapidly provisioned and released with minimal management effort. Cloud computing and storage solutions provide users and enterprises with various capabilities to store and process their data in third-party data centers.
Cloud computing has become a highly demanded service or utility due to the advantages of high computing power, cheap cost of services, high performance, scalability, accessibility as well as availability." [Cloud computing. Wikipedia]
The vector stencils library "Cloud clipart" is included in the Cloud Computing Diagrams solution from the Computer and Networks area of ConceptDraw Solution Park.
Use it to design cloud computing infographic and diagrams with ConceptDraw PRO software.
"Cloud computing, also on-demand computing, is a kind of Internet-based computing that provides shared processing resources and data to computers and other devices on demand. It is a model for enabling ubiquitous, on-demand access to a shared pool of configurable computing resources (e.g., networks, servers, storage, applications and services), which can be rapidly provisioned and released with minimal management effort. Cloud computing and storage solutions provide users and enterprises with various capabilities to store and process their data in third-party data centers.
Cloud computing has become a highly demanded service or utility due to the advantages of high computing power, cheap cost of services, high performance, scalability, accessibility as well as availability." [Cloud computing. Wikipedia]
The vector stencils library "Cloud clipart" is included in the Cloud Computing Diagrams solution from the Computer and Networks area of ConceptDraw Solution Park.
Access point
Airport
Alert
Banknote
Banknote bundle
Banknote bundles
Backup
Bar chart
Big data
Book (closed)
Book (open)
Books
Box, close
Box, open
Braces
Brackets
Bug
Building
Bus
Cable connection
Calculator
Calendar
Car
CD/DVD
Check list
Check mark
Clock
Cloud
Cloud computing
Cloud database
Cloud hosting
Cloud storage
Code
Coffee cup
Coin
Coins stack
Coins stacks
Communication
Computer terminal
Console
CPU
Credit card
Cubes
Dashboard
Database
Databases
Datacenter
Dialog box
Dialog boxes
Document
Documents
Dollar sign
Download
Earth
Email
Equal sign
Ethernet jack
Ethernet plug
Euro sign
Exclamation mark
Eye
Feed symbol
Feedback
File
Files
Filter
Firewall
Flash drive
Folder
Folders
Gamepad
Gauge
Gear
Gears, 2
Gears, 3
Globe
Hacker
Hard drive
Heart
Heart rhythm
Home
Hosting
Hotel
House
Image
Info
IP phone
Jet
Key
Keyboard
Laptop
Lego
Letter
Light bulb
Lightning
Line chart
Linux penguin
List
Load balancer
Location mark
Lock, close
Lock, open
Lock and key
Log
Login
Logout
Magnifying glass
Mail
Map
Memory (RAM)
Microphone
Minus sign
Mobile phone
Monitor
Mouse
Movie
Music
Music player
Network
Network bus
Newspaper
NIC (Network interface controller)
Not found (Error 404)
Notebook
Office printer
Operator
Page
Pages
PC
Pencil
Photo
Photo camera
Pie chart
Platform
Plus sign
Pound sign
Printer
Puzzle
Puzzles, 2x2
Puzzles, 3x3
Question sign
Rackmount server
Router
Safe
Satellite
Satellite antenna
Schedule
Sensor
Server
Server rack
Shield
Ship
Shopping bag
Shopping basket
Shopping cart
Sign up
Smartphone
Social network
Software box
Sound
Spider
Spreadsheet
SSD
Star
Stars, 5
Stethoscope
Stickman
Stickmen
Suitcase
Support
Switch
Syringe
Tablet computer
Tools
Train
Truck
Truck 2
TV
Umbrella
Upload
User man
User woman
User profile
Video
Video camera
Video mail
Virtual disk
Virus
Wallet
Web camera
Wifi antenna
Wireless
Wrench
X cross symbol
Yen sign
- Meter indicators 2 - Vector stencils library | Education indicators ...
- Strain Gauge Symbol
- Mechanical Drawing Symbols | Instruments - Vector stencils library ...
- Sales dashboard - Vector stencils library | Design elements - Sales ...
- Dashboard Gauges
- Management indicators - Vector stencils library | Education ...
- Instruments - Vector stencils library | Symbol Of Thermocouple Strain ...
- Instruments - Vector stencils library | Strain Gauge Symble
- Sales dashboard - Vector stencils library | Design elements - Meter ...
- Design elements - Meter indicators | Meter indicators 2 - Vector ...
- Sales dashboard - Vector stencils library | Sales dashboard - Vector ...
- Management indicators - Vector stencils library | Sales dashboard ...
- Instruments - Vector stencils library | Meter Dashboard | Meter ...
- Meter Dashboard | Cloud clipart - Vector stencils library | Sales ...
- Education indicators - Vector stencils library
- Management indicators - Vector stencils library | Education ...
- Sales dashboard - Vector stencils library
- Sales KPIs and Metrics - Vector stencils library | Design elements ...
- Meter indicators 2 - Vector stencils library
- Instruments - Vector stencils library | Mechanical Drawing Symbols ...