 Venn Diagrams
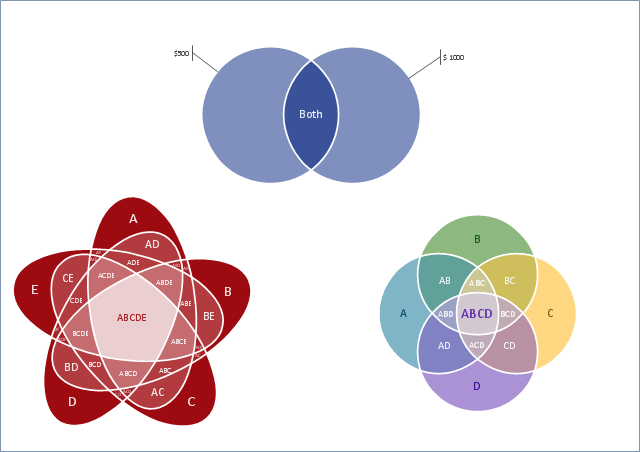
Venn Diagrams are actively used to illustrate simple set relationships in set theory and probability theory, logic and statistics, mathematics and computer science, linguistics, sociology, and marketing. Venn Diagrams are also often used to visually summarize the status and future viability of a project.
Multi Layer Venn Diagram. Venn Diagram Example

HelpDesk
How to Create a Venn Diagram

Venn Diagram Examples for Problem Solving. Computer Science. Chomsky Hierarchy

Venn Diagram Examples for Problem Solving. Venn Diagram as a Truth Table

3 Circle Venn Diagram. Venn Diagram Example

Circles Venn Diagram

Venn Diagram Template for Word

Venn Diagram Examples for Problem Solving. Environmental Social Science. Human Sustainability Confluence

2 Circle Venn Diagram. Venn Diagram Example

Chart Maker for Presentations

Venn Diagram Examples for Problem Solving

Cylinder Venn Diagram

Use this triangular Venn diagram template to create your own marketing pyramid diagrams using the ConceptDraw PRO diagramming and vector drawing software.
The triangular Venn diagram template is included in the Pyramid Diagrams solution from the Marketing area of ConceptDraw Solution Park.
www.conceptdraw.com/ solution-park/ marketing-pyramid-diagrams
The triangular Venn diagram template is included in the Pyramid Diagrams solution from the Marketing area of ConceptDraw Solution Park.
www.conceptdraw.com/ solution-park/ marketing-pyramid-diagrams
Triangular Venn diagram

 ConceptDraw Solution Park
ConceptDraw Solution Park collects graphic extensions, examples and learning materials
 Basic Diagramming
This solution extends ConceptDraw DIAGRAM software with the specific tools you need to easily draw flowcharts, block diagrams, histograms, pie charts, divided bar diagrams, line graphs, circular arrows diagrams, Venn diagrams, bubble diagrams and concept maps
Business diagrams & Org Charts with ConceptDraw DIAGRAM


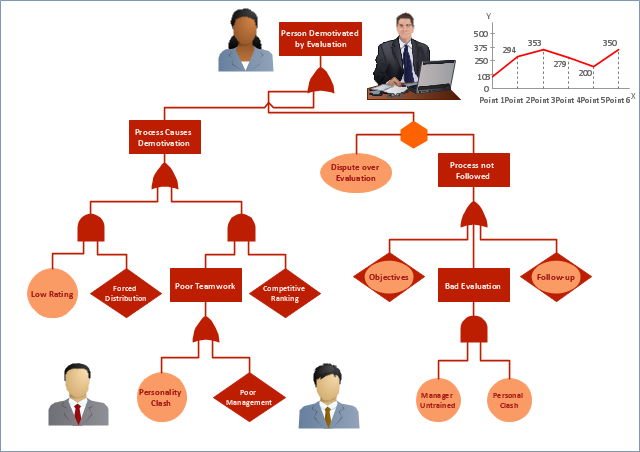
Fault tree analysis diagrams solution extends ConceptDraw PRO software with templates, samples and library of vector stencils for drawing the FTA diagrams.
Fault Tree
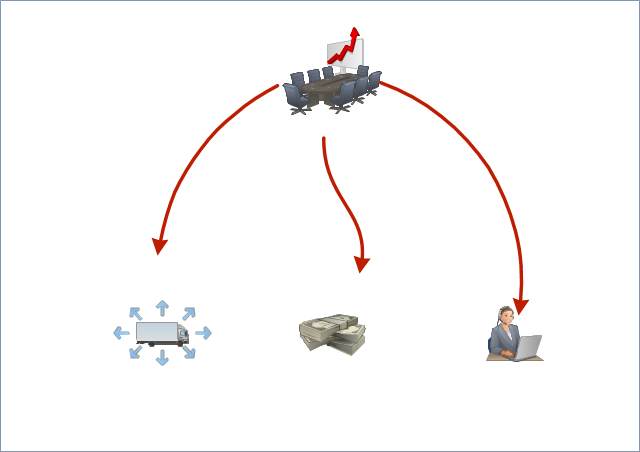
Workflow
Cash Venn
Used Solutions
Simple Drawing Applications for Mac

- Design elements - Venn diagrams | Circles Venn Diagram | Multi ...
- Circles Venn Diagram
- Venn diagram - Relationship marketing | Venn Diagrams | Ladder of ...
- Venn Diagram Examples for Problem Solving. Venn Diagram as a ...
- Venn Diagram Examples for Problem Solving. Computer Science ...
- Venn Diagram Examples for Problem Solving . Quantum Information ...
- Best Diagramming Software for Mac | ConceptDraw PRO ...
- 3 Circle Venn Diagram . Venn Diagram Example
- Venn Diagram Examples for Problem Solving. Environmental Social ...
- Venn diagram - Relationship marketing | Block diagram - Six ...
- Venn Diagrams | Visual Presentations Made Easy with ...
- Basic Circles Venn Diagram . Venn Diagram Example | Multi Layer ...
- 5-Set Venn diagram - Template | Venn Diagram | Multi Layer Venn ...
- Account Flowchart. Flowchart Examples | Venn Diagram Examples ...
- Venn diagram - Internet marketing professions | Satellite telecom ...
- Venn diagrams with ConceptDraw PRO | Use Case Diagrams ...
- Venn diagrams with ConceptDraw PRO | Venn Diagrams | Fault ...
- Marketing | Pyramid Diagrams | Venn Diagrams | Diagram Of ...
- Circle-Spoke Diagrams | Best Diagramming | Venn diagrams with ...
- Venn diagrams with ConceptDraw PRO | Best Diagramming ...