HelpDesk
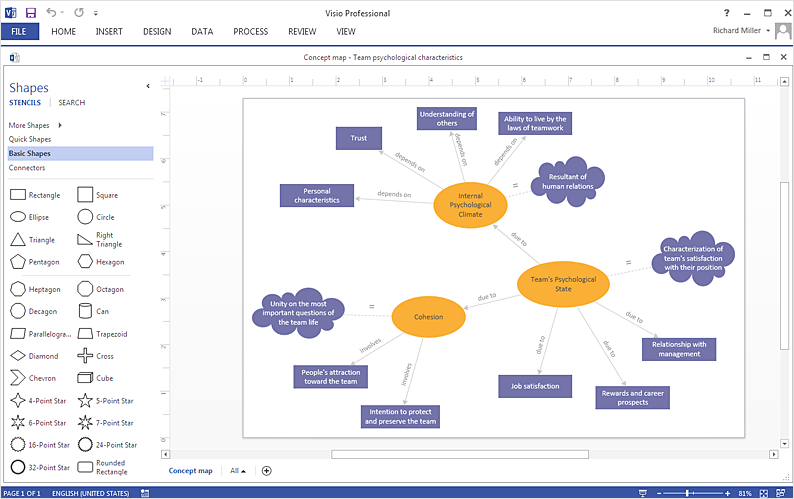
How To Create a Concept Map in Visio
ConceptDraw DIAGRAM allows you to easily create concept maps and then make an MS Visio file from your diagrams in a few simple steps.HelpDesk
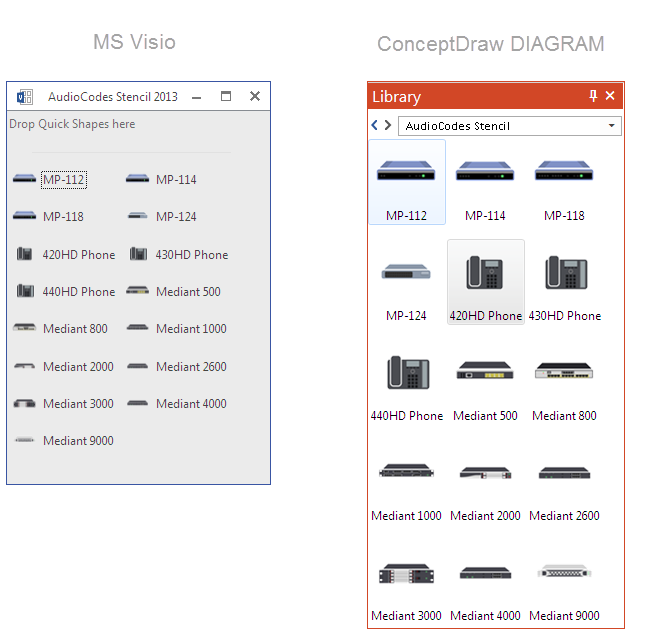
How to Convert Visio Stencils for Use in ConceptDraw DIAGRAM
MS Visio provides users with a number of predefined stencils. Standard Visio stencils contain shapes that are basically used to create diagrams. The shapes can range from simple flow chart boxes or lines to more complicated shapes like servers, racks or anything else that needs to be represented in a graphical form. ConceptDraw DIAGRAM supports the possibility to open Visio stencils. With the introduction of Visio 2013, Microsoft has changed the native file format used in earlier versions of Microsoft Visio. Thus, when you are looking for a professional tool to open and save in the newer Visio 2013 file format on Mac, ConceptDraw DIAGRAM is the solution for you. ConceptDraw DIAGRAM file import and export work round-trip with the new Visio VSDX file format and at the same time supports the improved import of VDX file format. To use Visio stencils created with MS Visio 2010 in your diagrams, created with ConceptDraw DIAGRAM, follow the steps described in the following article.Visio Files and ConceptDraw
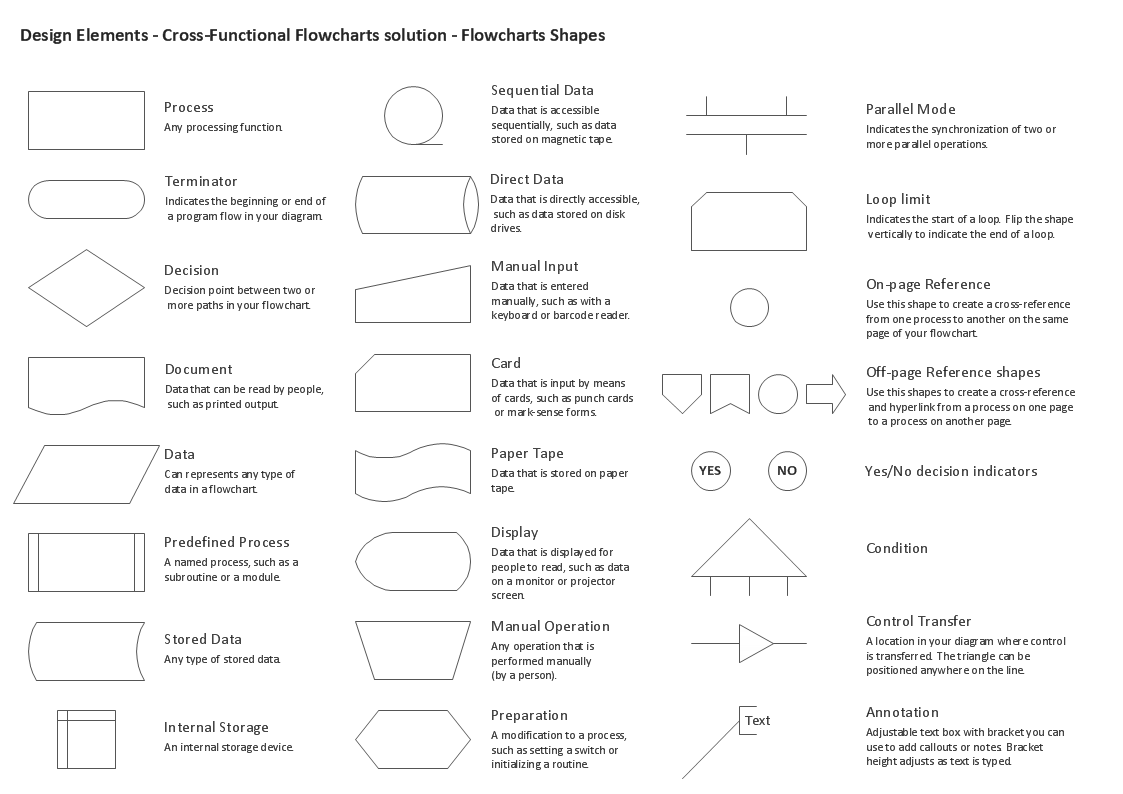
Visio Files and ConceptDraw. ConceptDraw DIAGRAM is compatible with MS Visio.VDX formatted files.VDX is Visio’s open XML file format, and it can be easily imported and exported by ConceptDraw DIAGRAM.Cross Functional Flowchart Shapes Stencil
ConceptDraw DIAGRAM diagramming software provides vector shapes and connector tools for quick and easy drawing diagrams for business, technology, science and education. ConceptDraw Solution Park include professional set of libraries for Cross Functional Flowchart Shapes StencilHelpDesk
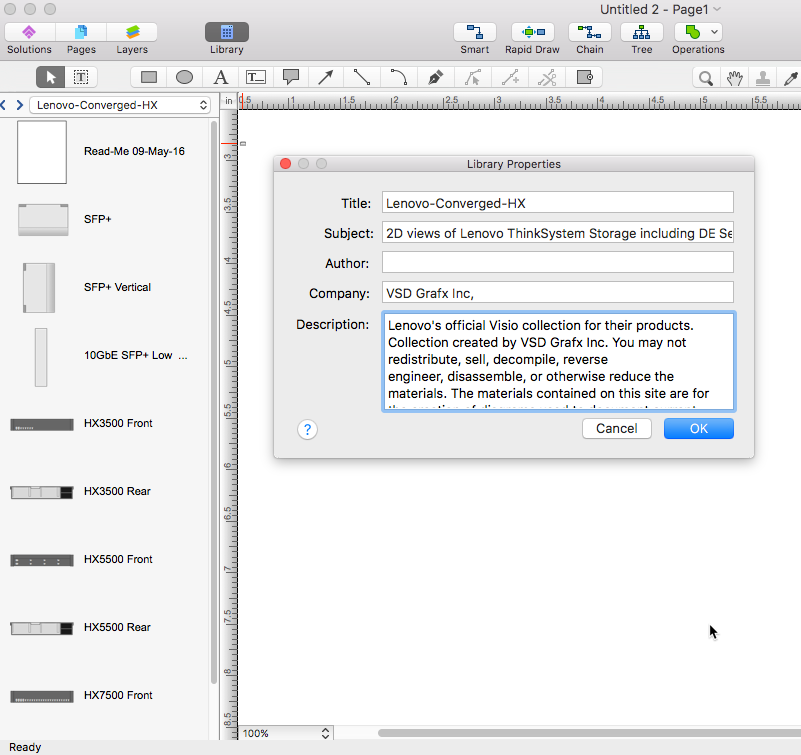
How to Convert MS Visio Custom Stencil to ConceptDraw DIAGRAM
Microsoft Visio allows users to create a new custom stencil to store objects that one want to reuse later or share it with other people. ConceptDraw DIAGRAM supports the possibility to open Visio custom stencils and shapes. With the introduction of Visio 2013 Microsoft has changed the native file format used in earlier versions of Microsoft Visio. Thus, when you are looking for professional tool to open and save in the newer Visio 2013 file format on Mac. ConceptDraw DIAGRAM is exactly solution for you.HelpDesk
How To Create Cause and Effect (Fishbone) Diagram in MS Visio
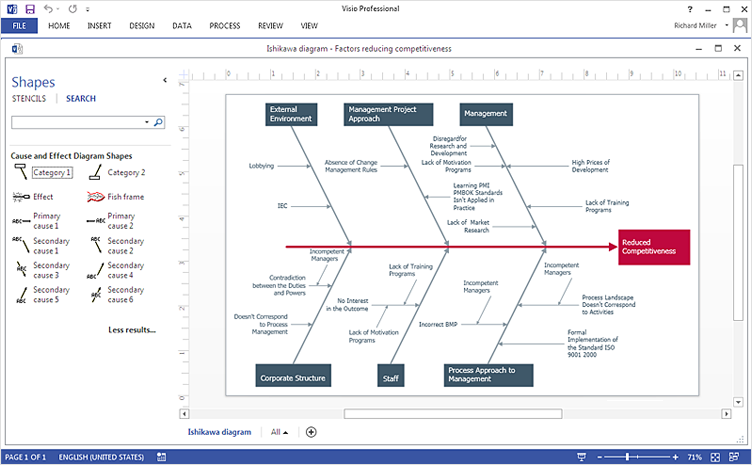
Cause-and-Effect Ishikawa Diagram is a graphical method of analysis and cause-effect relationships, a tool in the form of fish bone. It is used to systematically determine the cause of the problem and represent it graphically. The technique is primarily used in the framework of quality management for the analysis of quality problems and their causes. Nowadays, it has found worldwide distribution and is used in multiple problem areas. It is one of the tools of lean manufacturing, which is used in group work to find the problems and their causes. ConceptDraw DIAGRAM allows you to easily create Fishbone (Ishikawa) diagram and then make a MS Visio VSDX, or VSD files from your diagrams in a couple clicks, using the export capabilities of ConcewptDraw DIAGRAM.Cisco Telepresence. Cisco icons, shapes, stencils and symbols
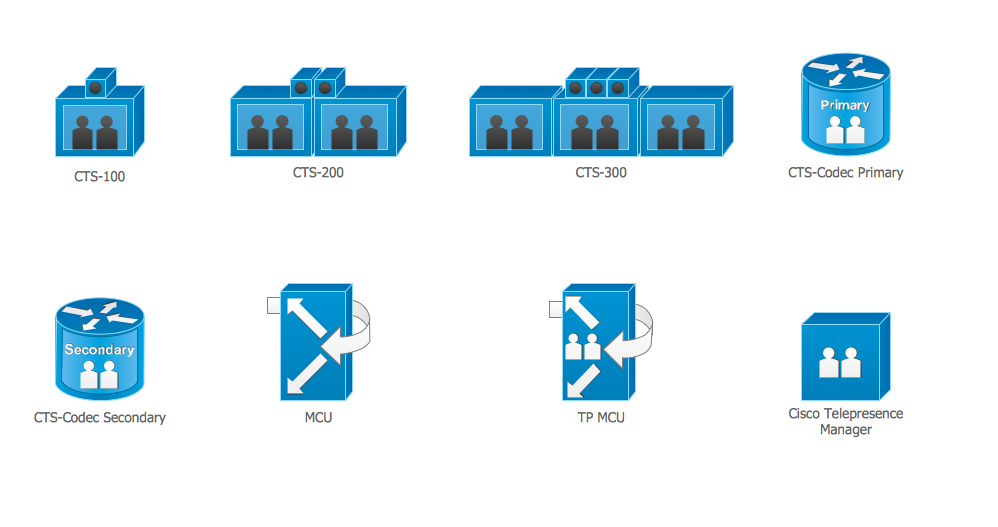
The ConceptDraw vector stencils library Cisco Telepresence contains videoconference equipment symbols for drawing the computer network diagrams.Cisco Buildings. Cisco icons, shapes, stencils and symbols
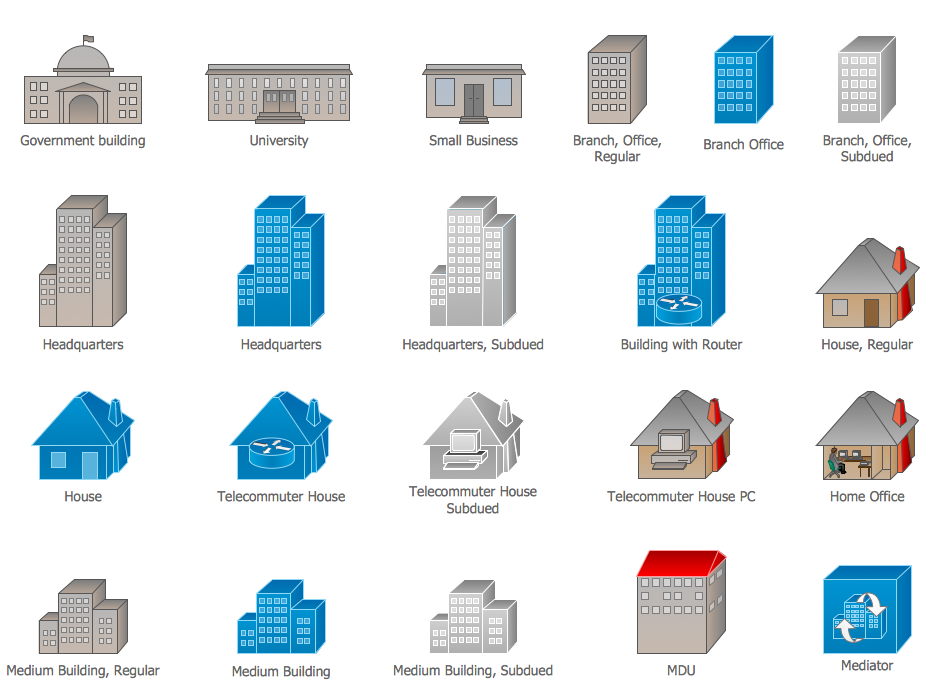
Cisco icons are globally recognized and generally accepted as standard for network icon topologies. The ConceptDraw vector stencils library "Cisco buildings" contains 21 symbols for drawing the computer network diagrams using the ConceptDraw DIAGRAM diagramming and vector drawing software.How to Make SWOT Analysis in a Word Document
A SWOT Analysis is a popular tool of the strategic planning which is used to evaluate the Strengths, Weaknesses, Opportunities, and Threats that are involved in any businesses. Use of mind maps allows you to collect a lot of information used for SWOT Analysis, visually structure it and also identify the relationships between different parts of this information. SWOT and TOWS Matrix Diagrams solution for ConceptDraw Solution Park combines professional visual advantages of ConceptDraw MINDMAP software and presentation capabilities of ConceptDraw DIAGRAM , which together provide a complete work solution. The SWOT and TOWS diagrams, matrices or mind maps produced in ConceptDraw DIAGRAM using the predesigned vector objects or filling the ready templates, can be then easily exported to Microsoft Word, Microsoft Visio, Microsoft PowerPoint, Adobe PDF, and many other electronic file formats. The possibility of export makes easy the use of SWOT diagrams designed in ConceptDraw DIAGRAM and lets you efficiently collaborate even with people who maybe don't have this software.ConceptDraw DIAGRAM Compatibility with MS Visio
The powerful diagramming and business graphics tools are now not exception, but the norm for today’s business, which develop in incredibly quick temp. But with the abundance of powerful business diagramming applications it is important to provide their compatibility for effective exchange the information between the colleagues and other people who maybe use different software in their work. During many years Microsoft Visio™ was standard file format for the business and now many people need the visual communication software tools that can read the Visio format files and also export to Visio format. The powerful diagramming and vector drawing software ConceptDraw DIAGRAM is ideal from the point of view of compatibility with MS Visio. Any ConceptDraw DIAGRAM user who have the colleagues that use MS Visio or any who migrates from Visio to ConceptDraw DIAGRAM , will not have any problems. The VSDX (Visio′s open XML file format) and VDX formatted files can be easily imported and exported by ConceptDraw DIAGRAM , you can see video about this possibility.MS Visio Look a Like Diagrams
No need for any special drawing skills to create professional looking diagrams outside of your knowledge base. ConceptDraw DIAGRAM takes care of the technical details, allowing you to focus on your job, not the drawing. ConceptDraw DIAGRAM delivers full-functioned alternative to MS Visio. ConceptDraw DIAGRAM supports import of Visio files. ConceptDraw DIAGRAM supports flowcharting, swimlane, orgchart, project chart, mind map, decision tree, cause and effect, charts and graphs, and many other diagram types.Map of USA
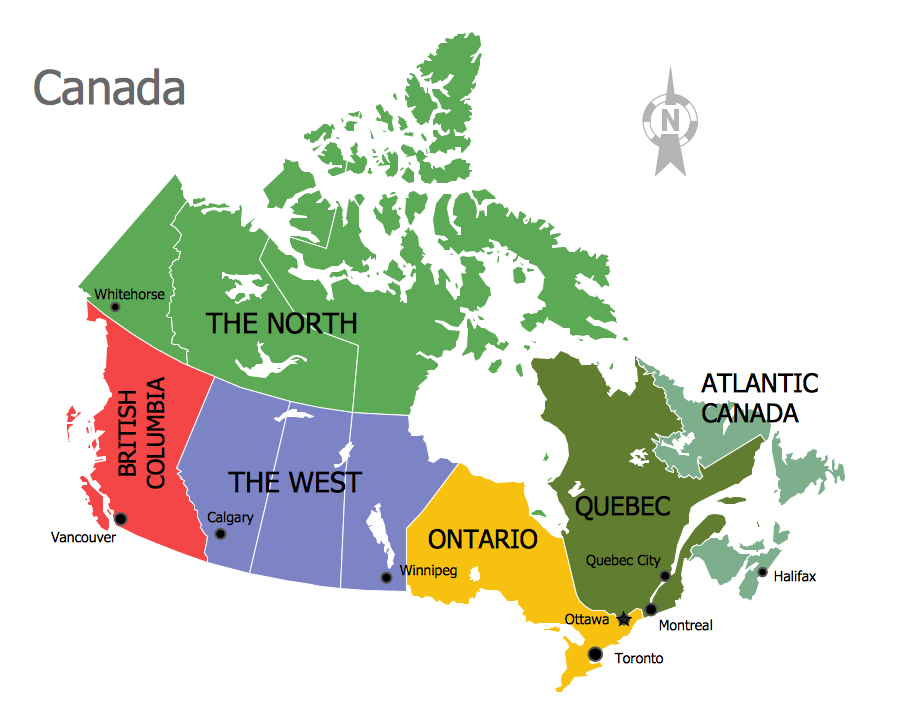
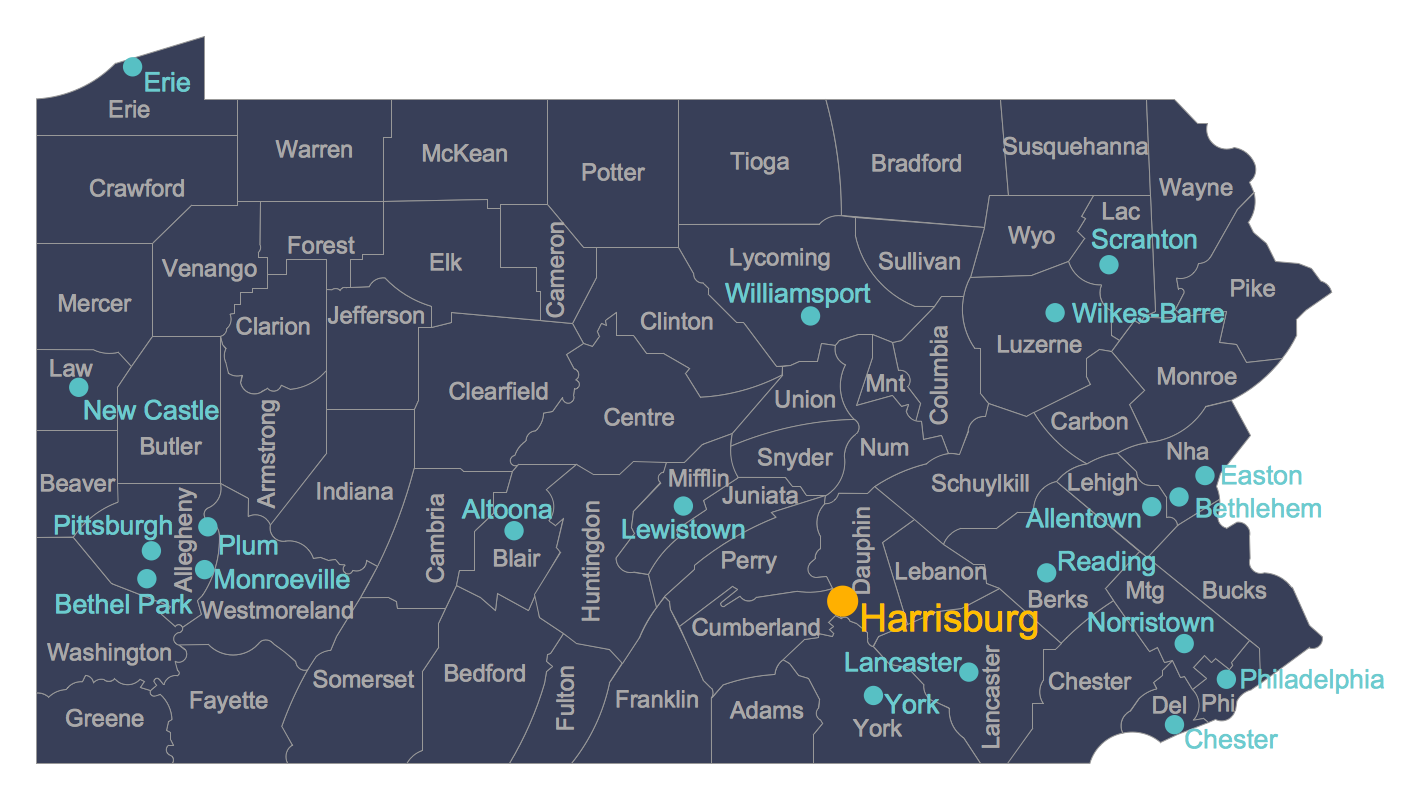
It is impossible to imagine modern life and science without maps, they surround us anywhere, they are used in geography, history, politics, economics, and many other fields of science. ConceptDraw DIAGRAM diagramming and vector drawing software offers the USA Maps Solution from the Maps Area of ConceptDraw Solution Park with its collection of samples and libraries for easy drawing the Map of USA.Value Stream Mapping Tool
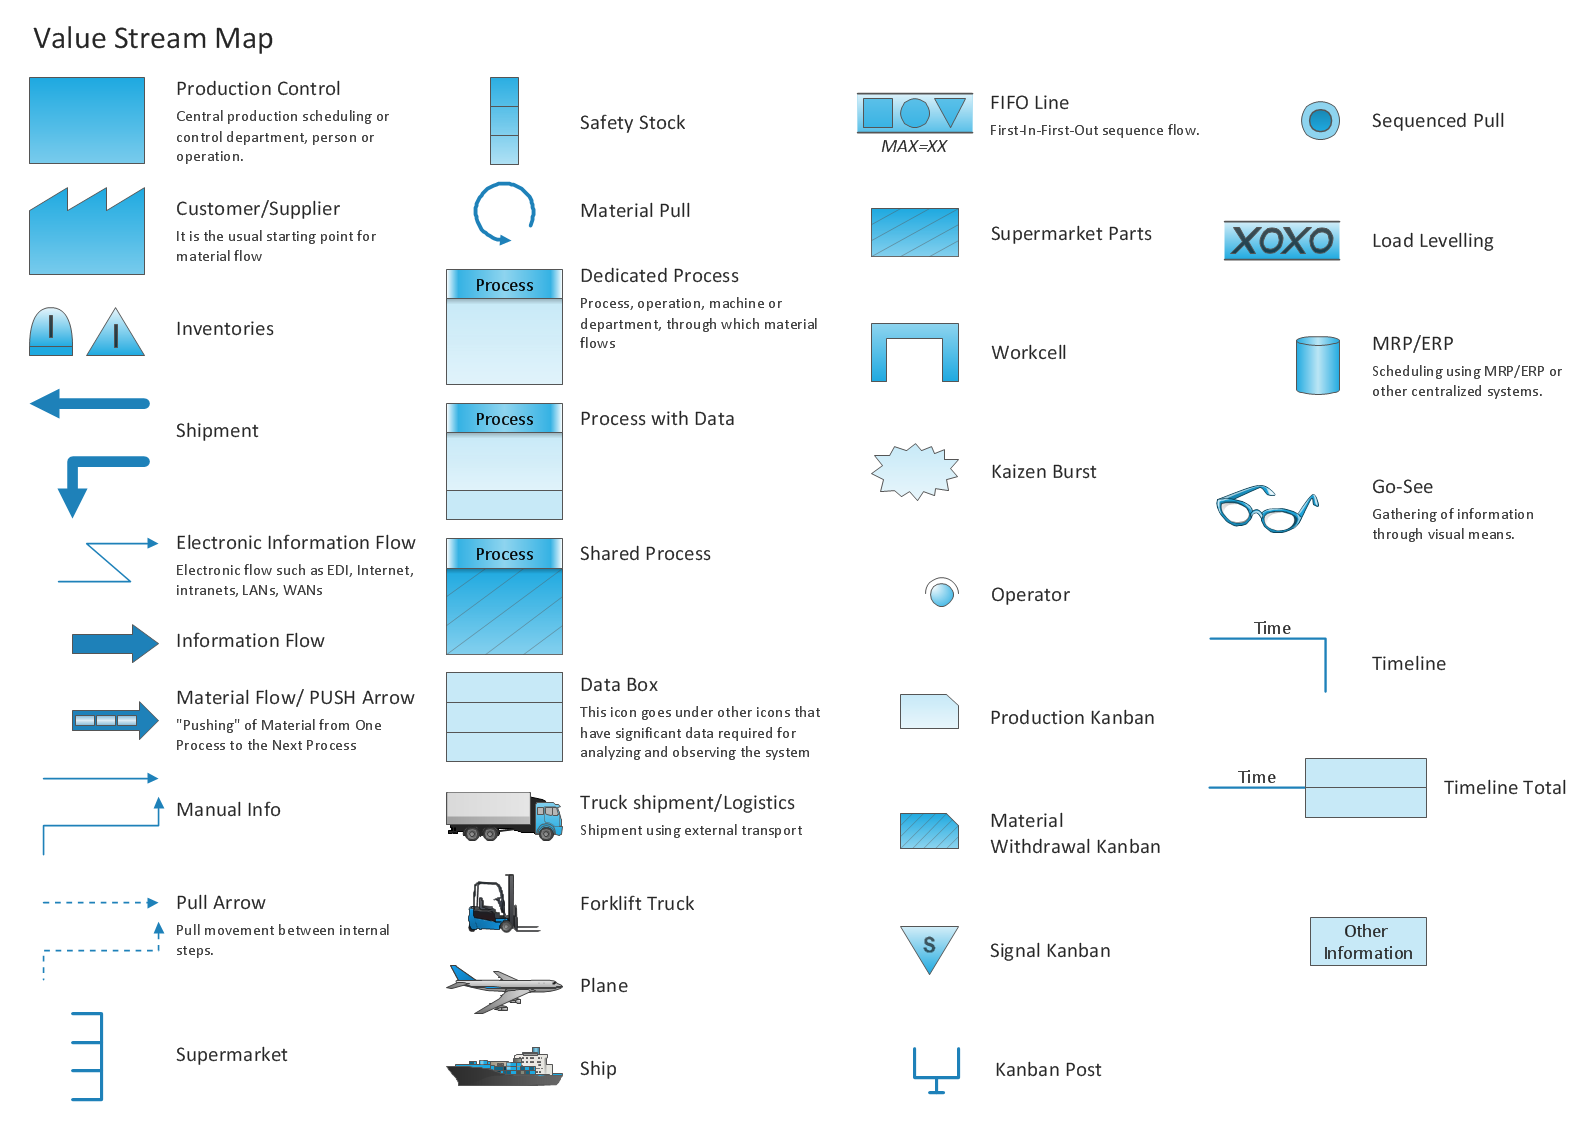
Value Stream Mapping solution extends ConceptDraw DIAGRAM software with tools for drawing Value Stream Maps (VSM): templates, samples and library of vector stencils.Decision Making Software For Small Business
A software tool that saves your time on making decisions now has the ability to make decisions with remote team via Skype.
Cisco Network Objects in ConceptDraw DIAGRAM
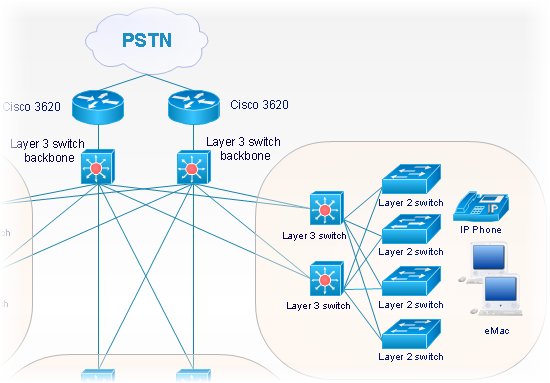
ConceptDraw DIAGRAM is the only application on the Macintosh platform, supplied with a comprehensive Cisco icon set. For graphic solutions that support Windows, only Microsoft Visio has a library of Cisco shapes. ConceptDraw DIAGRAM is a valuable option to many network professionals that use Macintosh computers or work in a combined Mac and PC environment.IDEF0 Visio
ConceptDraw DIAGRAM extended with IDEF0 Diagrams solution from the Software Development area of ConceptDraw Solution Park is a powerful diagramming and vector drawing IDEF0 software. All IDEF0 diagrams created in ConceptDraw DIAGRAM are vector graphic documents and can be reviewed, modified and converted to MS Visio XML format. To obtain the IDEF0 Visio documents from ConceptDraw DIAGRAM documents use the wide export possibilities of ConceptDraw DIAGRAM.Network Diagramming Software for Design Basic Network Diagrams
ConceptDraw DIAGRAM is perfect for software designers and software developers who need to draw Basic Network Diagrams.
Flowchart Software
Flowchart is a simple diagram, map or graphical schematic representation the sequence of actions within a process. It is ideal for displaying how a process currently flows or can function ideally. The Flowcharts let define the steps and boundaries of a process, uncover problems or miscommunications. The Flowcharts are widely used in education, software development, business, economics, thanks to their visuality they are ideal for presentations, reports, for using on conferences to help the audience comprehend the content better, or easy find flaws in a process flow diagrams. ConceptDraw DIAGRAM is professional flowcharts software and feature-rich flowchart maker, which supports Mac OS X and Windows. It contains at ConceptDraw Solution Park a rich set of stencils and professional flowchart symbols for design. It lets create simply professional-looking Flowcharts based on thousand free flowchart templates, colored symbols and examples. ConceptDraw DIAGRAM is a 3 times cheaper alternative to MS Visio available for both Mac and PC. It’s is another full featured business and technical diagramming application that can easily take care of Visio files within OS X. Another bonus with ConceptDraw DIAGRAM – it's cross-platform. You can work on a document in both OS X and Windows, skipping Visio entirely.
Continents Map
Designing of Continents Map is a quite complex and labour-intensive process. But now we have a way to make it easier - ConceptDraw DIAGRAM diagramming and vector drawing software extended with useful drawing tools of Continent Maps Solution from the Maps Area.Stakeholder Onion Diagram Template
For depicting the onion model are actively used Stakeholder Onion Diagrams. The ConceptDraw DIAGRAM diagramming and vector drawing software extended with Stakeholder Onion Diagrams Solution from the Management Area of ConceptDraw Solution Park offers the number of useful tools and Stakeholder Onion Diagram template for their easy design.- Visio Template Mindmap
- How To Create a Concept Map in Visio | How To Create an MS Visio ...
- Map Directions | How to Create a Directional Map Using ...
- Basic Flowchart Symbols and Meaning | Marketing - Vector stencils ...
- How To Create a MS Visio Business Process Diagram | Visio Files ...
- Visio Dashboard Stencil
- Cross-Functional Process Map Template | Value Stream Mapping ...
- Hardware - Vector stencils library | MS Visio Look a Like Diagrams ...
- Gatekeeper Stencil Visio
- Porter's Value Chain | Process Flowchart | Logistics Flow Charts ...
- UML Diagram Visio | UML Deployment Diagram . Diagramming ...
- MS Visio Look a Like Diagrams | Cisco Network Templates | Cisco ...
- How to Convert MS Visio Custom Stencil to ConceptDraw DIAGRAM ...
- Visio Office Furniture Stencils
- How To Create a Concept Map in Visio Using ConceptDraw PRO ...
- Cisco Telepresence. Cisco icons, shapes, stencils and symbols ...
- How to Convert MS Visio Custom Stencil to ConceptDraw DIAGRAM ...
- Fault Tree Diagram | MS Visio Look a Like Diagrams | Is ...
- Visio Diagram 3d Exchange 2016





_Win_Mac.png)

