Visual Presentations Made Easy with Diagramming Software
Automatically create a presentation-quality diagram in one click with ConceptDraw PRO.
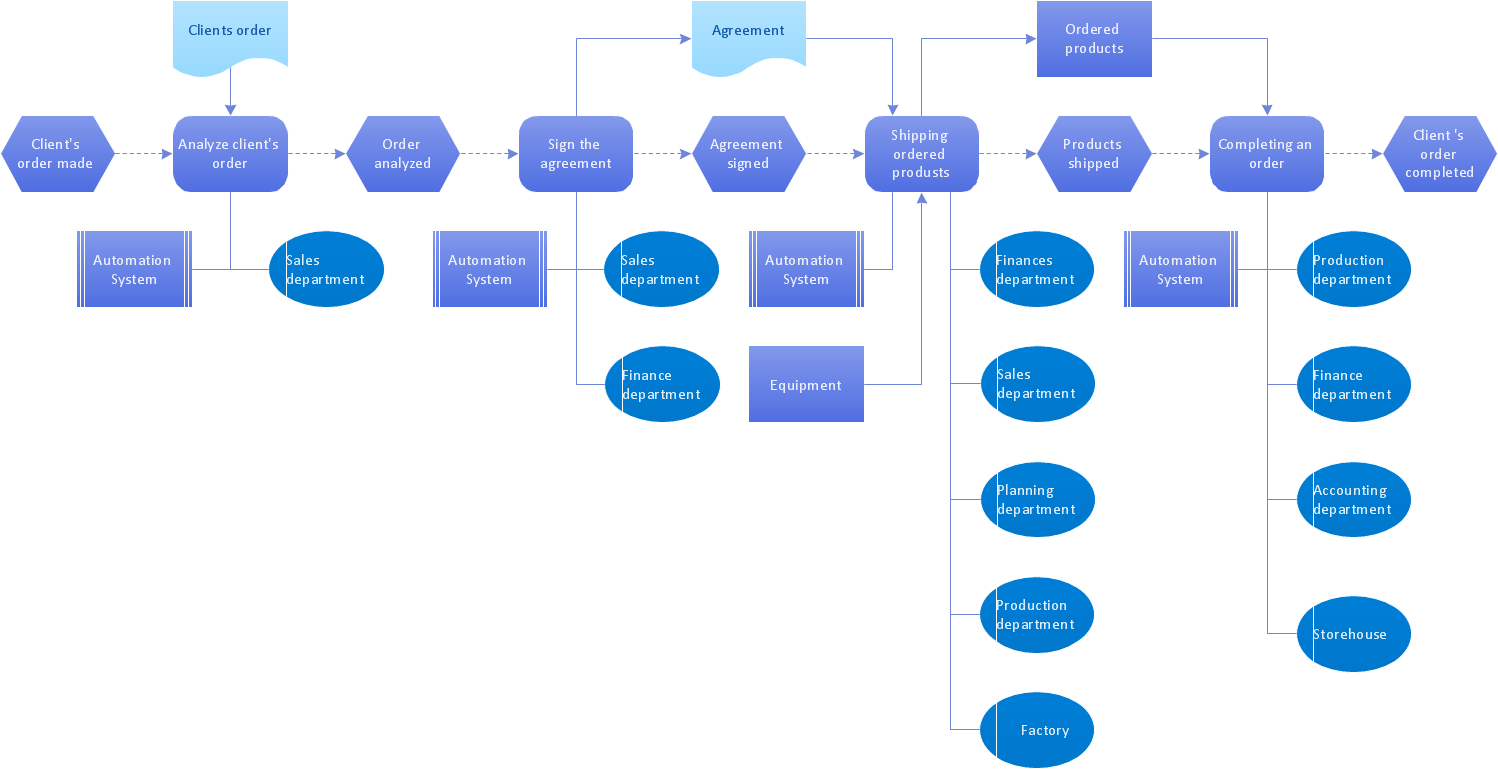
Software for Drawing EPC Diagrams
Event-Driven Process chain Diagrams for improvement throughout an organisation.ConceptDraw PRO - software that reduces the time needed to create a business process model.
How to Draw EPC Diagram Quickly
ConceptDraw PRO is a software for making EPC diagrams that allows managers visually present business process models for making decisions for business.The Best Tool for Business Process Modeling
Event-Driven Process chain Diagrams for improvement throughout an organisation.ConceptDraw PRO - software that reduces the time needed to create a business process model.
PROBLEM ANALYSIS Root Cause Analysis Tree Diagram
Root Cause Analysis Tree Diagram. Use the Root Cause Diagram to perform visual root cause analysis.
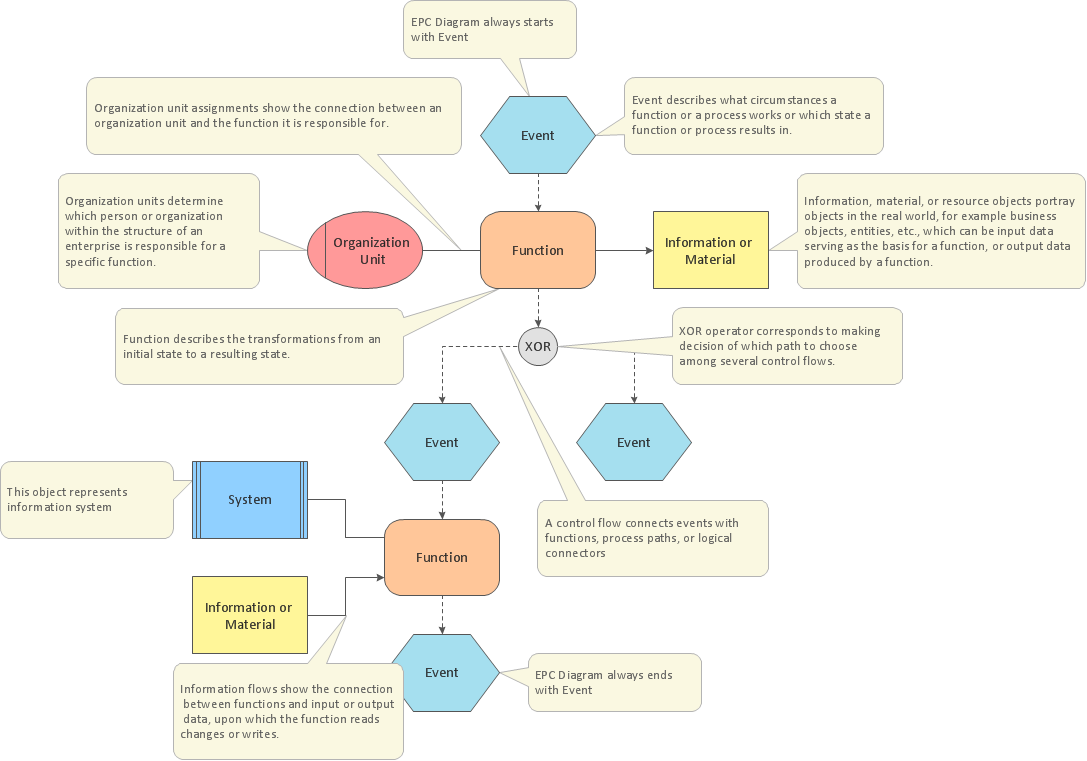
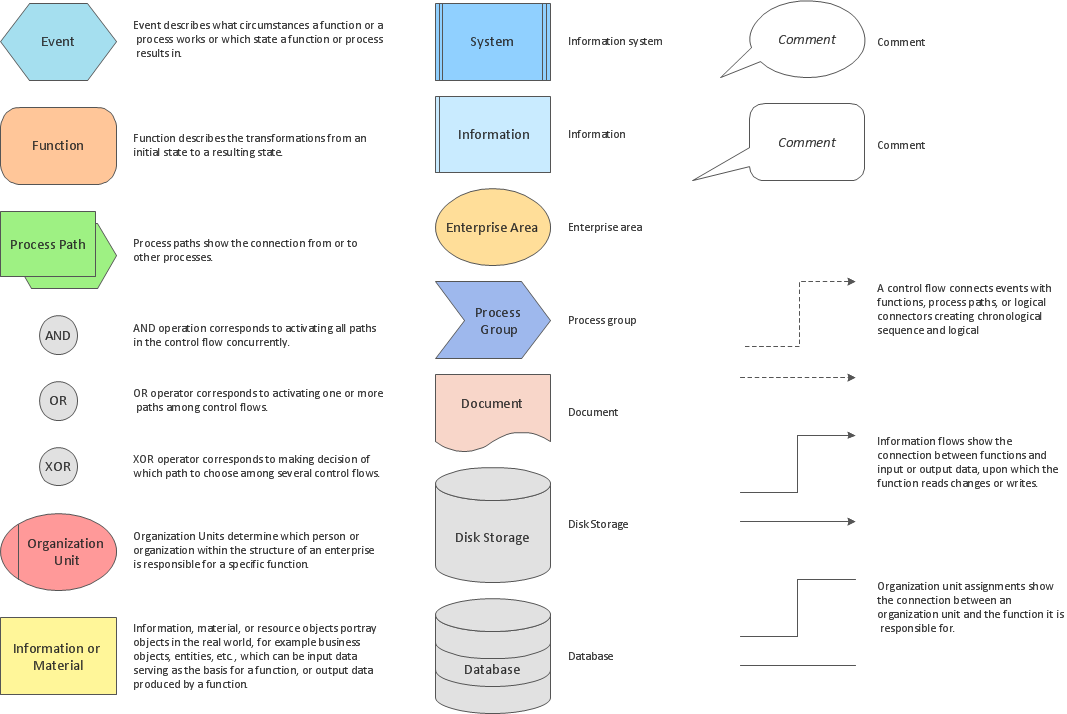
The Building Blocks Used in EPC Diagrams
Event-Driven Process Chain Diagrams is using for improvement throughout an organisation.ConceptDraw PRO - software that reduces the time needed to create a EPC diagrams.
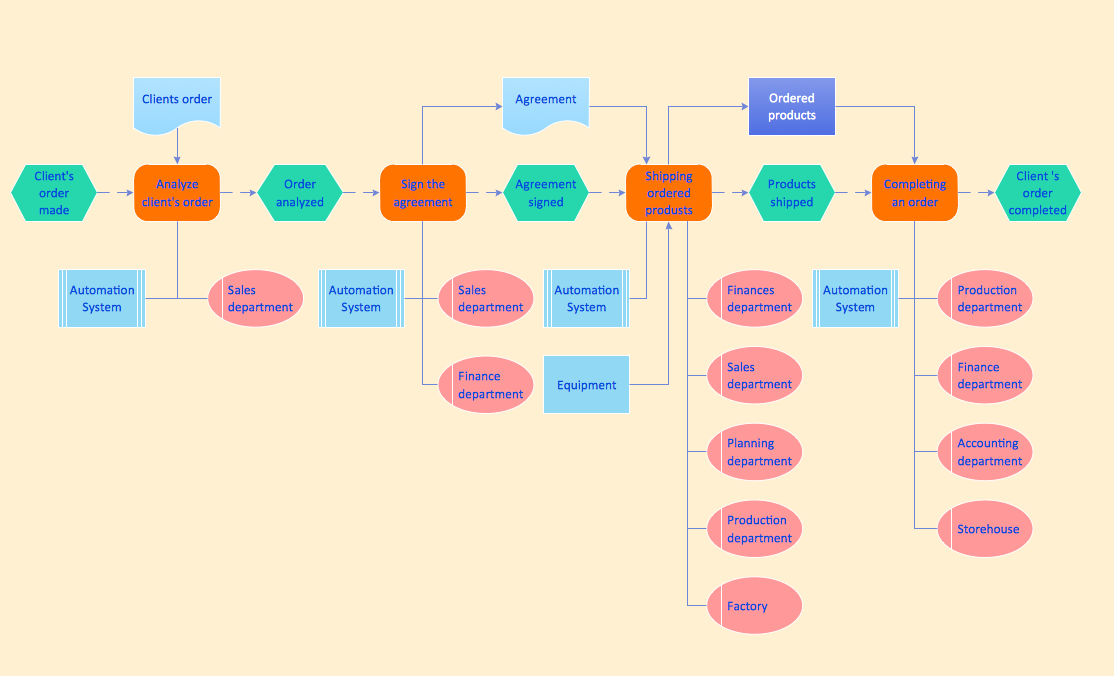
Business Process Modeling with EPC
Event-Driven Process Chain Diagrams for improvement throughout an organisation.ConceptDraw PRO - software that reduces the time needed to create a business process model.
EPC (Event-driven Process Chain) Flowcharts
The Event - driven Process Chain ( EPC ) allows managers visually present business process models for making decisions for business processes improvement.Event-Driven Process Сhain Diagrams for improvement throughout an organisation.
EPC for Business Process Improvement
ConceptDraw PRO - software that reduces the time needed to create a business process model.ConceptDraw PRO for making EPC diagrams provides business improvement . The Event-driven Process Chain ( EPC ) Diagrams allows reach improvement throughout an organisation.
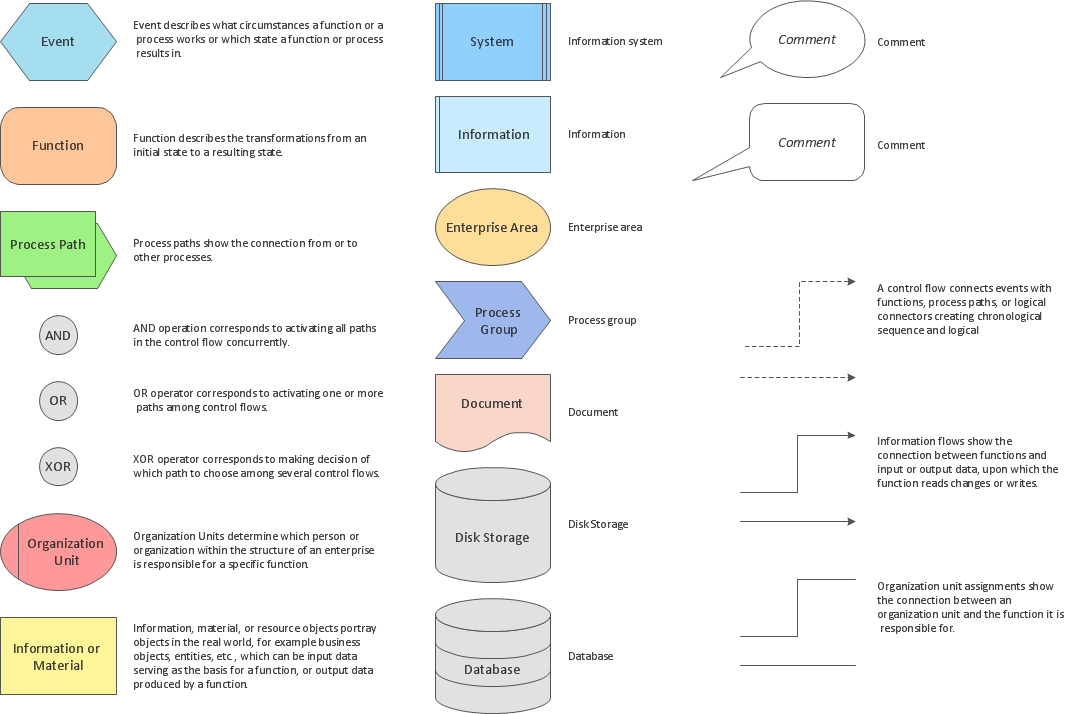
Graphical Symbols to use in EPC diagrams
Event-Driven Process Chain Diagrams for improvement throughout an organisation.ConceptDraw PRO - software that reduces the time needed to create a business process model.
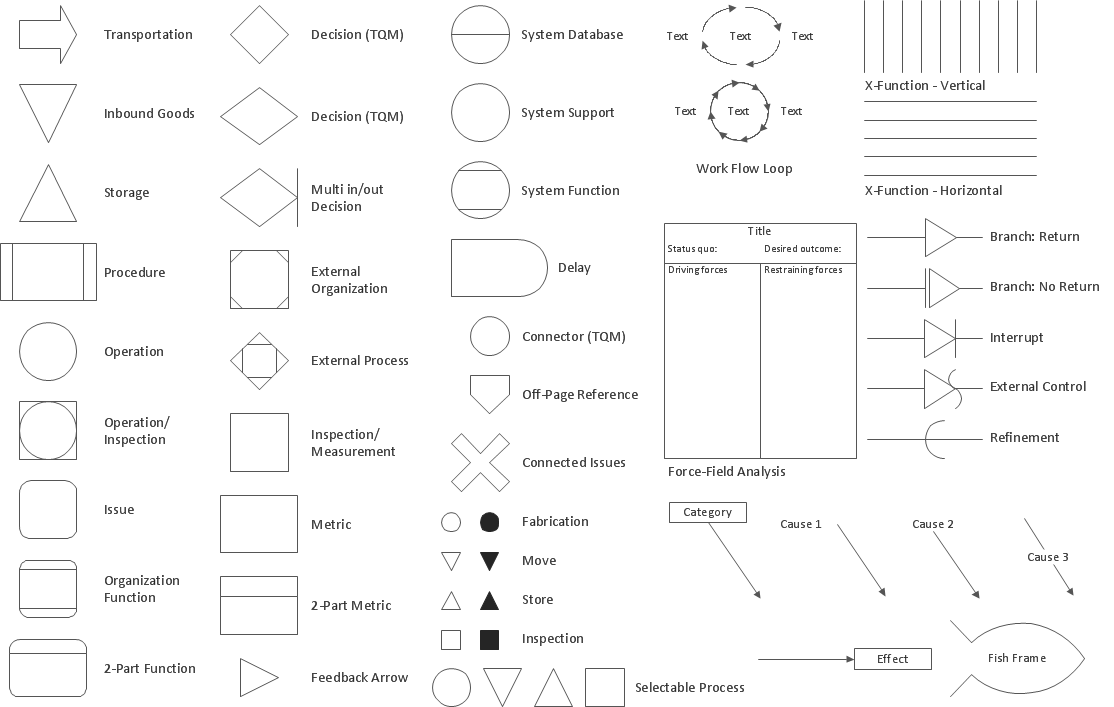
TQM Diagram Example
The Total Quality Management Diagram solution helps you and your organization visualize business and industrial processes. Create Total Quality Management diagrams for business process with ConceptDraw software.Event Driven Process chain (EPC) Diagrams
Event-Driven Process Chain Diagrams for improvement throughout an organisation.ConceptDraw PRO - software that reduces the time needed to create a business process model.
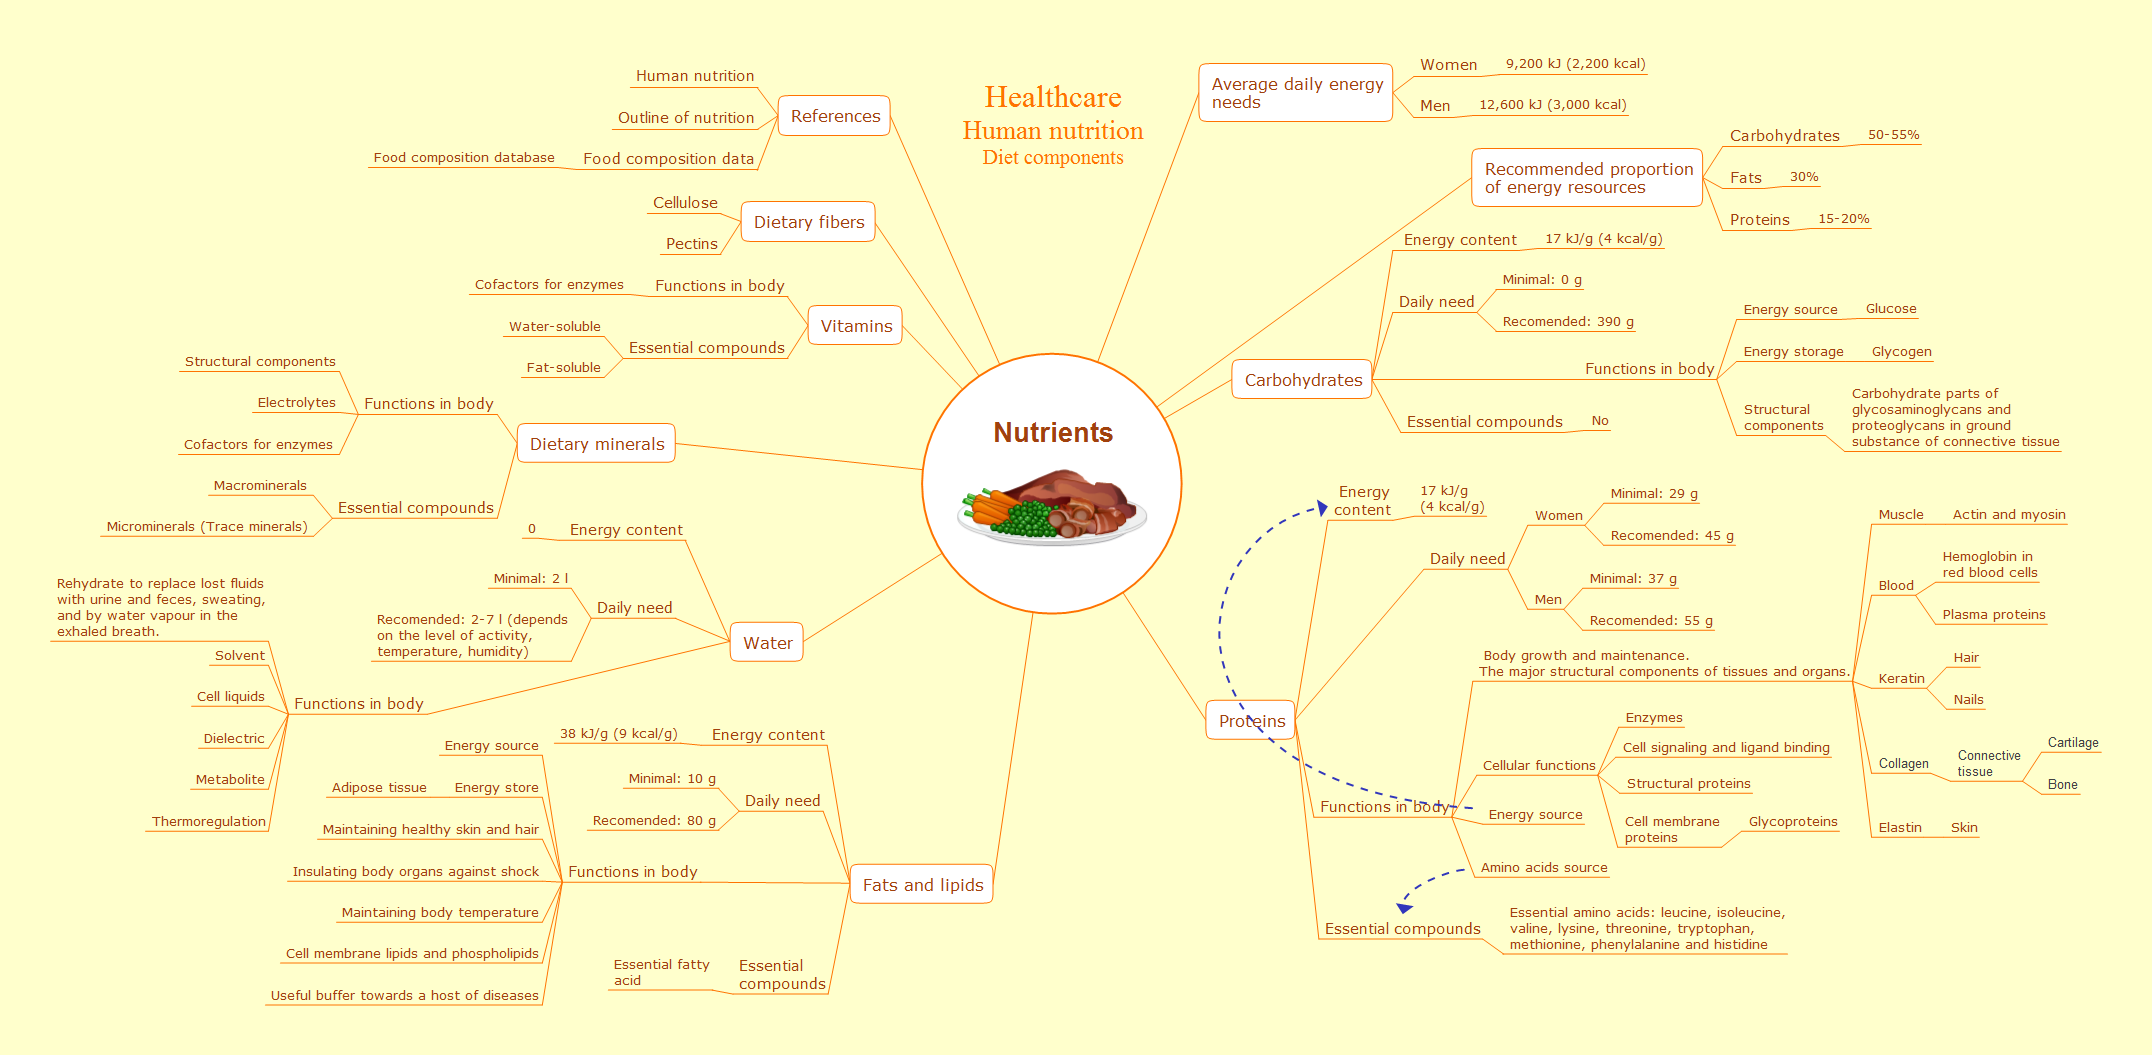
Quality Project Management with Mind Maps
The visual form of mind maps is helpful in all stages of quality management, from describing problem to describing and documenting a decision.TQM Software — Build Professional TQM Diagrams
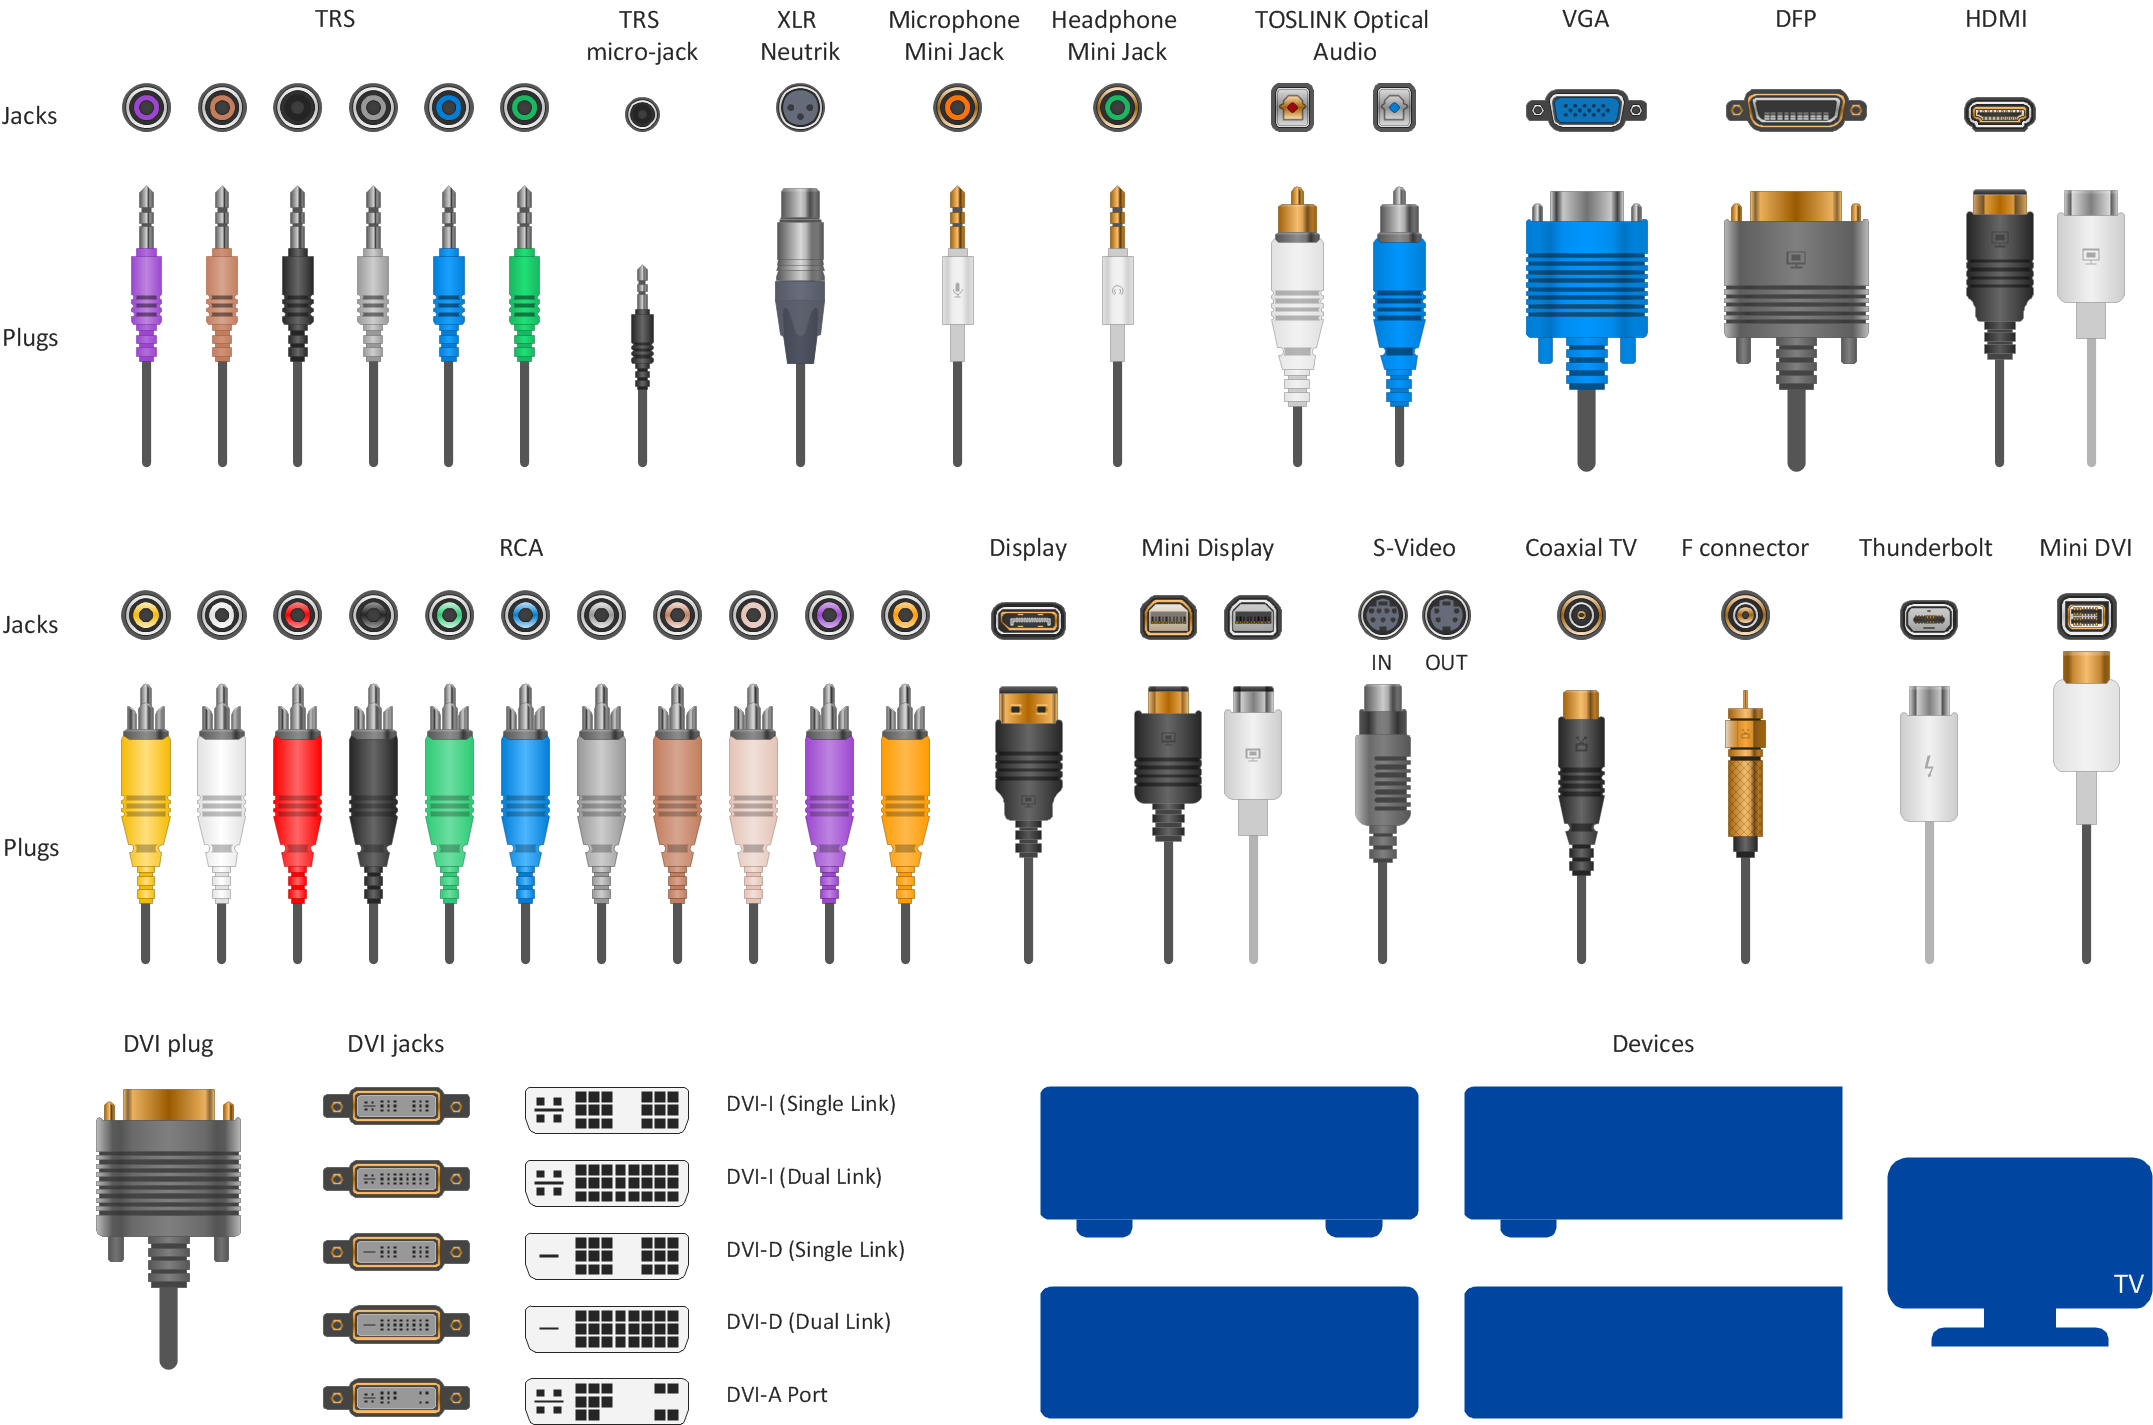
The Total Quality Management Diagram solution helps you and your organization visualize business and industrial processes. Create Total Quality Management diagrams for business process with ConceptDraw software.Audio Visual Connectors Types
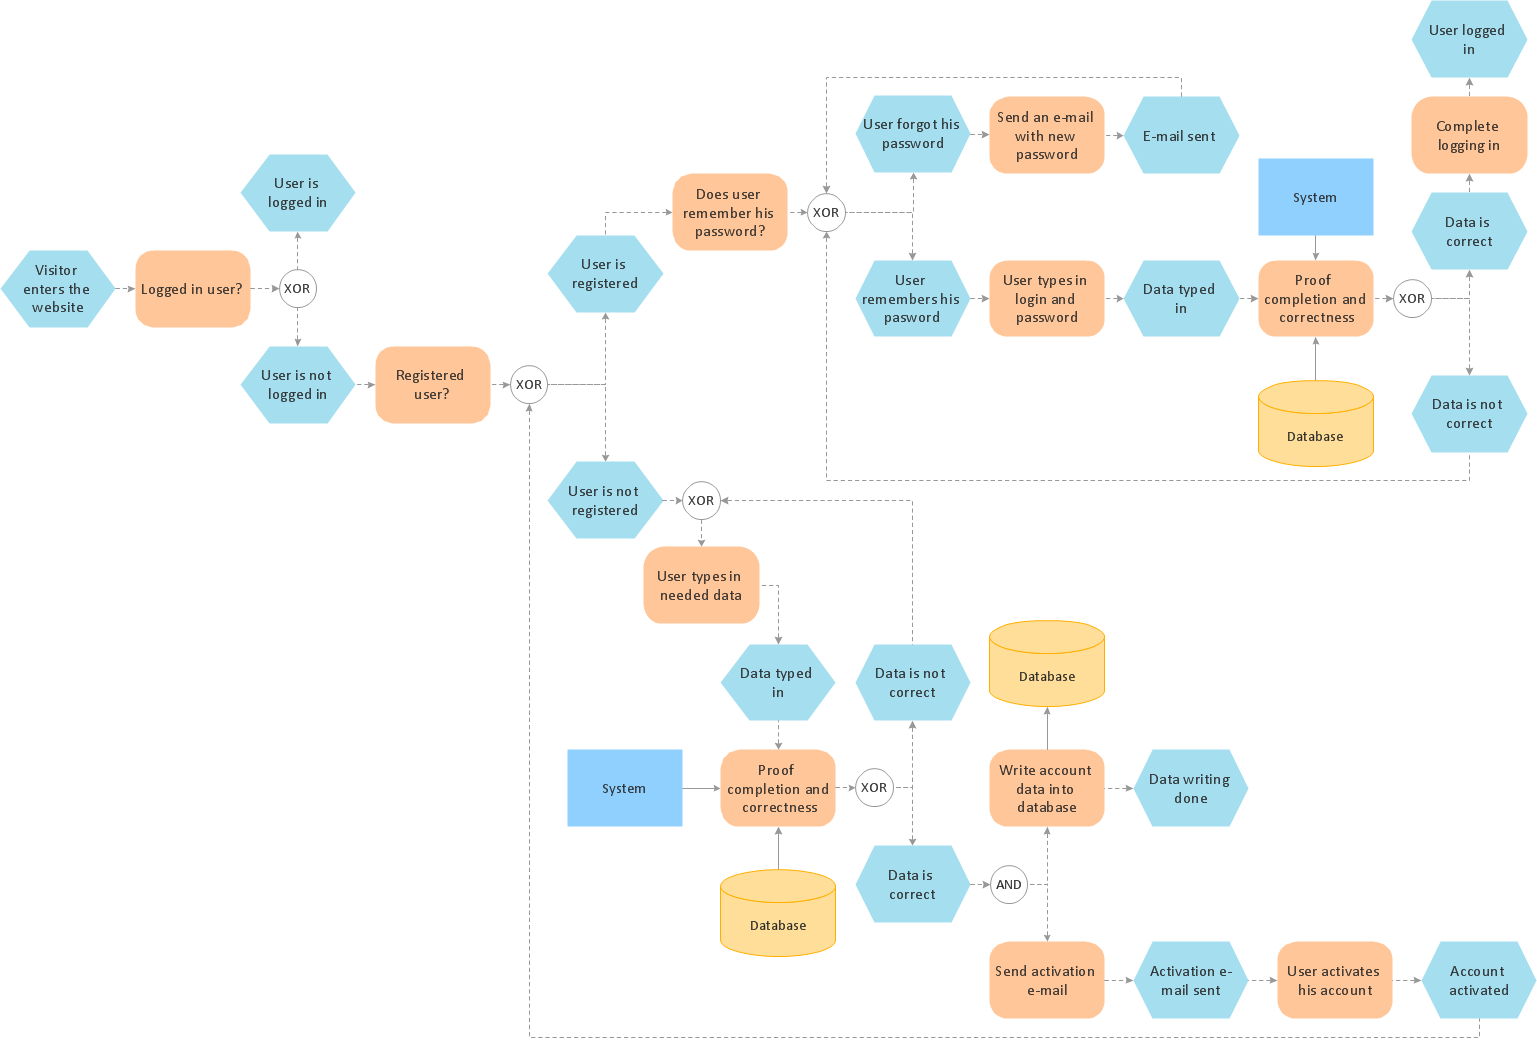
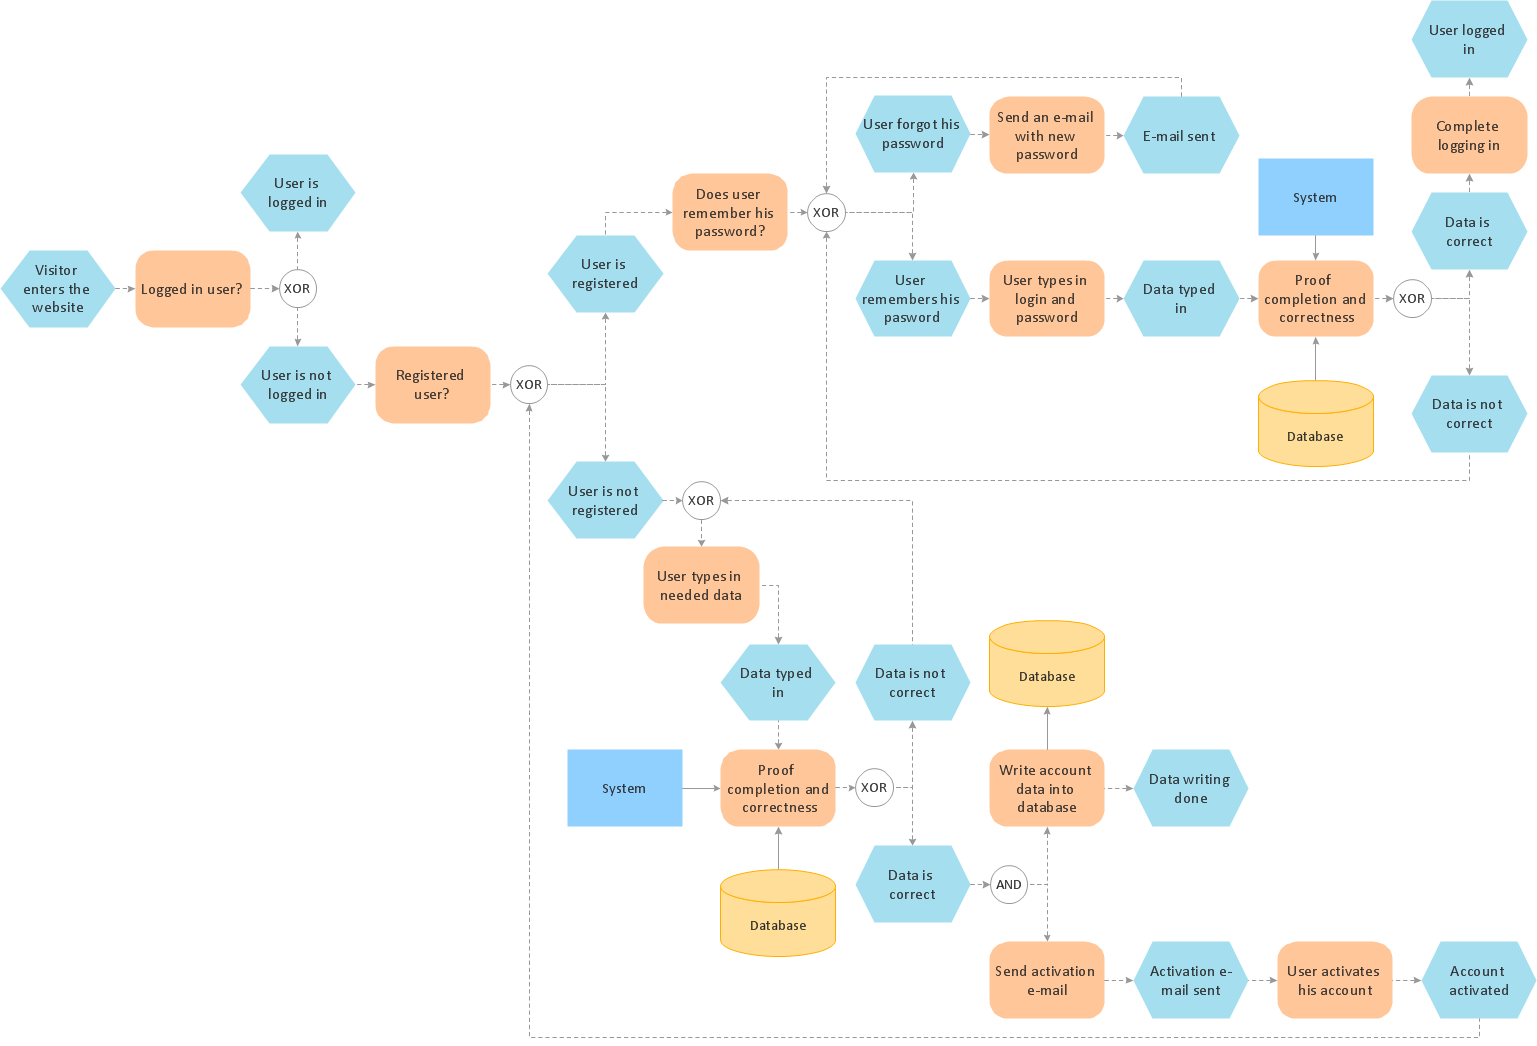
The Audio & Video Connectors solution contains a set of pre-designed objects, libraries, templates, and samples; allowing quick and easy diagramming of various configurations of audio and video devices.Process Modelling using Event-driven Process chain
Event-Driven Process Chain Diagrams for improvement throughout an organisation.ConceptDraw PRO - software that reduces the time needed to create a business process model.
The Fifty Two Elements of TQM
The Total Quality Management Diagram solution helps your organization visualize business and industrial processes. Create Total Quality Management diagrams for business process with ConceptDraw software.TQM Diagram Tool
The Total Quality Management Diagram solution helps you and your organization visualize business and industrial processes. Create Total Quality Management diagrams for business process with ConceptDraw software.Software Work Flow Process in Project Management with Diagram
This sample was created in ConceptDraw PRO diagramming and vector drawing software using the Workflow Diagrams Solution from the Software Development area of ConceptDraw Solution Park.This sample shows the Workflow Diagram that clearly illustrates stages a BPM consists of and relations between all parts of business. The Workflow Diagrams are used to represent the transferring of data during the work process, to study and analysis the working processes, and to optimize a workflow.
- Visual Presentations Made Easy with Diagramming Software ...
- Selecting & Creating Flowcharts | Visual Presentations Made Easy ...
- TQM Software Build Professional TQM Diagrams
- Visual Presentations Made Easy with Diagramming Software | The ...
- Visual Presentations Made Easy with Diagramming Software | Basic ...
- Best Software to Draw Diagrams | Best Diagramming Software for ...
- PROBLEM ANALYSIS Root Cause Analysis Tree Diagram | Total ...
- The Best Flowchart Software Available | Visual Presentations Made ...
- Business Process Modeling Software for Mac | Simple & Fast ...
- Business Process Modeling Software for Mac | Business Process ...
- Histograms | Chart Examples | Visual Presentations Made Easy with ...
- Project Task Trees and Dependencies | Decision Making ...
- Quality Mind Map | SWOT analysis Software & Template for ...
- Business Diagram Software | Best Vector Drawing Application for ...
- Fishbone Diagram | Visual Presentations Made Easy with ...
- Software Work Flow Process in Project Management with Diagram ...
- Basic Diagramming | Best Software to Draw Diagrams | Visual ...
- Quality Project Management with Mind Maps | How To Implement ...
- Flowchart - HR management process | How To Create a Flow Chart ...
- PM Dashboards | Status Dashboard | How To Create Project Report |

