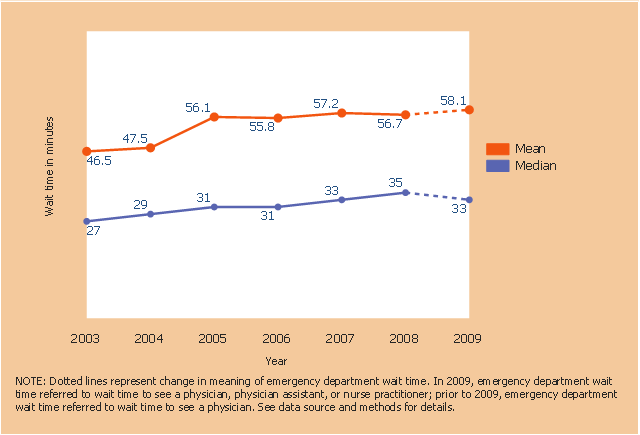
This line graph sample shows the mean and median wait time for treatment in hospital emergency department: United States, 2003–2009. Dotted lines represent change in meaning of emergency department wait time. In 2009, emergency department wait time referred to wait time to see a physician, physician assistant, or nurse practitioner; prior to 2009, emergency department wait time referred to wait time to see a physician.
This line graph was designed on the base of line graph from the website of National Center for Health Statistics, Centers for Disease Control and Prevention (CDC), U.S. Department of Health & Human Services.
[cdc.gov/ nchs/ products/ databriefs/ db102.htm]
The line chart example "Wait time for treatment in hospital emergency departments" was created using the ConceptDraw PRO diagramming and vector drawing software extended with the Line Graphs solution from the Graphs and Charts area of ConceptDraw Solution Park.
Line chart
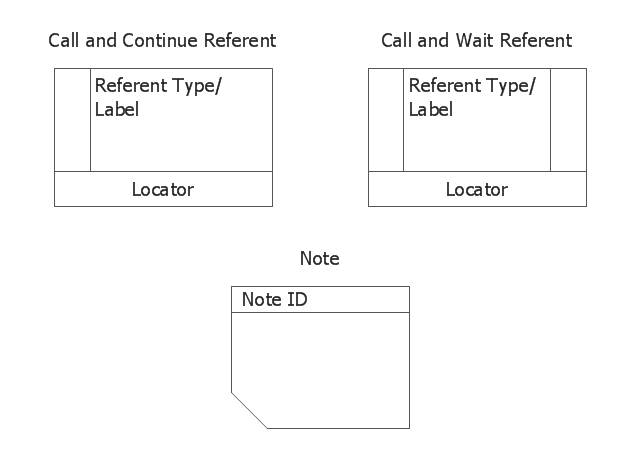
This vector stencils library contains 3 referents and notes shapes.
Use it to design your IDEF3 diagrams with ConceptDraw PRO diagramming and vector drawing tools.
The vector stencils library "IDEF3 referents and notes" is included in the IDEF Business Process Diagrams solution from the Business Processes area of ConceptDraw Solution Park.
Use it to design your IDEF3 diagrams with ConceptDraw PRO diagramming and vector drawing tools.
The vector stencils library "IDEF3 referents and notes" is included in the IDEF Business Process Diagrams solution from the Business Processes area of ConceptDraw Solution Park.
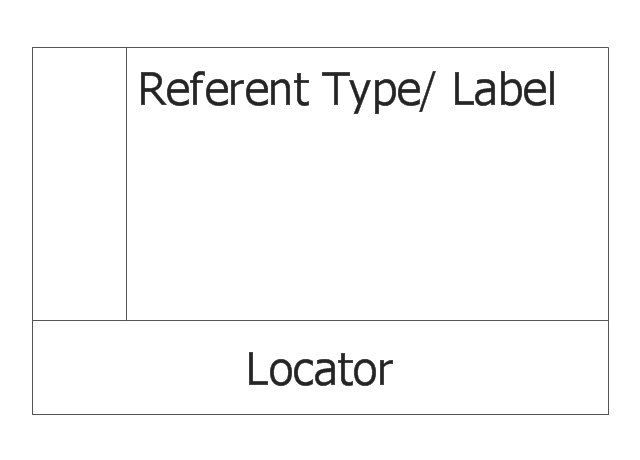
Call and Continue Referent
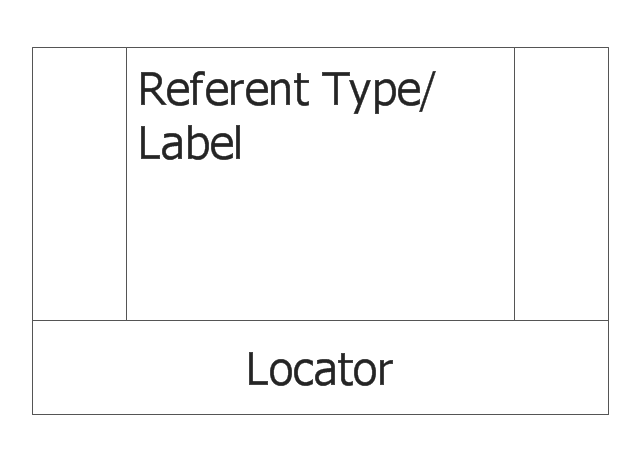
Call and Wait Referent
Note
The vector stencils library "IDEF3 referents and notes" contains 3 shapes: call and continue referent, call and wait referent, note.
"Referents: Referents enhance understanding, provide additional meaning, and simplify the construction (i.e., minimize clutter) of both process schematics and object schematics." [IDEF3. Wikipedia]
Use it to design your IDEF3 diagrams.
The shapes example "Design elements - IDEF3 referents and notes" was created using the ConceptDraw PRO diagramming and vector drawing software extended with the solution "IDEF Business Process Diagrams" from the area "Business Processes" of ConceptDraw Solution Park.
IDEF3 symbols - referents and notes
The vector stencils library "Software" contains 36 computer software icons.
Use it to design your IT and telecom illustrations and infographics with ConceptDraw PRO diagramming and vector drawing software.
The vector stencils library "Software" is included in the Computers and Communications solution from the Illustration area of ConceptDraw Solution Park.
Use it to design your IT and telecom illustrations and infographics with ConceptDraw PRO diagramming and vector drawing software.
The vector stencils library "Software" is included in the Computers and Communications solution from the Illustration area of ConceptDraw Solution Park.
C drive

Programming

Binary code

Expand

Collapse

Refresh screen

Template

Drafting

Report file

File optimized

Options

Manipulate

Scanning file

Onlooker

Saved searches

Find

Search document

List

Approved

Bug

Bug file

Bug searching

Alert

Filtering

Trash can

Scissors

Magic hat and wand

Toggle buttons

File editing

Waiting

Clock

Timer

Favorite folder

Alphabet folder

Import

Export

Basic Flowchart Symbols and Meaning


The vector stencils library "Time" contains 20 time and clock icons.
Use it to design your business and finance illustrations and infographics with ConceptDraw PRO diagramming and vector drawing software.
The vector stencils library "Time" is included in the Business and Finance solution from the Illustration area of ConceptDraw Solution Park.
Use it to design your business and finance illustrations and infographics with ConceptDraw PRO diagramming and vector drawing software.
The vector stencils library "Time" is included in the Business and Finance solution from the Illustration area of ConceptDraw Solution Park.
Wall clock

Alarm clock

Electronic clock

Dual watch

Sand glass

Tower clock

Stopwatch

Metronome

Working time

Rest time

Waiting time

Dinner time

Coming late

Coming in time

Time management

Morning

Afternoon

Evening

Night

Around the clock

The vector stencils library "People" contains 49 people clipart images and figures you can use in your presentations, illustrations and infographics.
"Clip art, in the graphic arts, refers to pre-made images used to illustrate any medium. Today, clip art is used extensively in both personal and commercial projects, ranging from home-printed greeting cards to commercial candles. Clip art comes in many forms, both electronic and printed. However, most clip art today is created, distributed, and used in an electronic form. Since its inception, clip art has evolved to include a wide variety of content, file formats, illustration styles, and licensing restrictions. Clip art is generally composed exclusively of illustrations (created by hand or by computer software), and does not include stock photography." [Clip art. Wikipedia]
The clip art example "People - Vector stencils library" was created using the ConceptDraw PRO diagramming and vector drawing software extended with the People solution from the Illustration area of ConceptDraw Solution Park.
www.conceptdraw.com/ solution-park/ illustrations-people
Athletic guy

Businessman

Manager

Sportsman

Short haired girl

Dark haired girl

Blonde haired girl

Brown haired girl

Curly haired girl

Working

Rest

Waiting

Community

Red figure

Blue figure

Red dolly

People

Orange dolly

Yellow dolly

Light-green dolly

Green dolly

Violet dolly

Turned yellow figure

Turned red figure

Blue dolly

Negotiations

Typing

Presentation

Running

Lilac dolly

User

Man 1

Man 2

Man 3

Man 4

Man 5

Man 6

Woman 1

Woman 2

Woman 3

Woman 4

Woman 5

Woman 6

Business man 1

Business man 2

Business man 3

Business woman 1

Business woman 2

Business woman 3

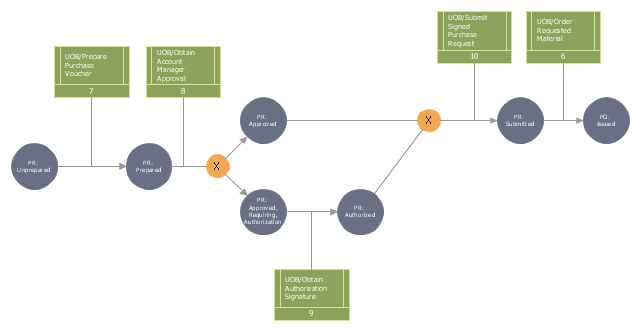
This IDEF3 diagram example was redesigned from the Wikimedia Commons file: 2-02 Example of a Transition Schematic.jpg.
[commons.wikimedia.org/ wiki/ File:2-02_ Example_ of_ a_ Transition_ Schematic.jpg]
"The schematic in Figure 2-2 represents an Object Schematic for the Order Material scenario derived from the business owner’s description. This example happens to illustrate a Transition Schematic since it characterizes the nature and structure of object state transitions for occurrences of the Order Material scenario. A key document in this process is the Purchase Request form. This form is eventually transformed into a Purchase Order (PO) via the Order Material process. A circle containing the name of an object represents an object of a certain kind (e.g., Purchase Request, Account Manager, Project). These labeled circles are known as kind symbols. A certain kind of object being in a certain state is represented by a circle with a label that captures both the kind itself and a corresponding state, thereby representing the type (or class) of objects that are in that state (within a given process). ... One of the first steps to develop an Object Schematic is to identify the possible states in which the object can exist. Though a real-world object often evolves through a continuum of states, an Object Schematic focuses on those distinguished states of particular interest to the domain expert. The transition arcs (arrows with triangular, filled-in heads) connecting the circles symbolize a state transition, the activity of changing from one state to another. The conditions that establish when an object is in a given state, how it exists a state, how it can transition between states, and how it can enter a new state are recorded on a special form. The banded boxes linked to the arrows (called referents) are aids to describe the relationships between objects states and UOBs, scenarios, or other Transition Schematics that participate in a scenario occurrence. ... The transition junctions containing an “X” (for exclusive or) indicate the choice of exactly one path among several possible paths in an occurrence." [IDEF3 Process Description Capture Method Report AL-TR-1995-XXXX. idef.com/ pdf/ Idef3_ fn.pdf]
The diagram "Transition schematic - IDEF3 diagram example" was created using the ConceptDraw PRO diagramming and vector drawing software extended with the solution "IDEF Business Process Diagrams" from the area "Business Processes" of ConceptDraw Solution Park.
IDEF3 business process diagram
The vector stencils library "Business people pictograms" contains 14 icons of business people.
Use it to draw your pictorial infographics.
The example "Business people pictograms - Vector stencils library" was created using the ConceptDraw PRO diagramming and vector drawing software extended with the Pictorial infographics solution from the area "What is infographics" in ConceptDraw Solution Park.
Businessman

Businesswoman

Businessman, full grown

Businesswoman, full grown

Business group

Work team

Presentation

Waiting

Working time

Discussion

Business idea

Agreement

Career

Business growth

The vector stencils library "Professions" contains 58 people clipart images of different professions you can use in your presentations, illustrations and infographics.
"Electronic clip art is available in several different file formats. It is important for clip art users to understand the differences between file formats so that they can use an appropriate image file and get the resolution and detail results they need.
Clip art file formats are divided into 2 different types: bitmap or vector graphics. ...
In contrast to the grid format of bitmap images, Vector graphics file formats use geometric modeling to describe an image as a series of points, lines, curves, and polygons. Because the image is described using geometric data instead of fixed pixels, the image can be scaled to any size while retaining "resolution independence", meaning that the image can be printed at the highest resolution a printer supports, resulting in a clear, crisp image. Vector file formats are usually superior in resolution and ease of editing as compared to bitmap file formats, but are not as widely supported by software and are not well-suited for storing pixel-specific data such as scanned photographs. In the early years of electronic clip art, vector illustrations were limited to simple line art representations." [Clip art. Wikipedia]
The clip art example "Professions - Vector stencils library" was created using the ConceptDraw PRO diagramming and vector drawing software extended with the People solution from the Illustration area of ConceptDraw Solution Park.
www.conceptdraw.com/ solution-park/ illustrations-people
Builder 1

System administrator

Worker of conveyor

Clerk 1

Clerk 2

Student 2

Student 3

Student 1

Dispatcher 1

Accountant

Gardener

Lawyer

Jurist

Judge

Consultant

Manager

Director

Programmer

Architect

Pilot

Policeman

Secretary

Security officer

Clerk 3

Musician

Presenter

Athlete

Artist
Announcer

Photographer

Hairdresser

Florist

Spaceman
Engineer

Reporter

Tailor
Dispatcher 2

Biologist

Chemist

Dentist

Priest

Soldier

Doctor

Driver

Carpenter

Fireman

Seaman

Builder 2

Postman

Miner

Waiter

Cleaner

Cashier

Shop assistant

Cook

Flight attendant

Teacher

Hall porter

- Line Graphs | Wait time for treatment in hospital emergency ...
- SDL digram - State Machine | Digram Of Stop And Wait
- Vector stencils library - IDEF3 referents and notes
- Social Media Response | Flowchart Wait For Event
- Wait time for treatment in hospital emergency departments
- Flowchart Wait
- Basic Flowchart Symbols and Meaning | Create Process Fork Wait ...
- Process Diagram Wait Time
- Software - Vector stencils library