This work flow chart sample was redesigned from the picture "Weather Forecast" from the article "Simulation Workflows".
[iaas.uni-stuttgart.de/ forschung/ projects/ simtech/ sim-workflows.php]
"(1) The weather is predicted for a particular geological area. Hence, the workflow is fed with a model of the geophysical environment of ground, air and water for a requested area.
(2) Over a specified period of time (e.g. 6 hours) several different variables are measured and observed. Ground stations, ships, airplanes, weather balloons, satellites and buoys measure the air pressure, air/ water temperature, wind velocity, air humidity, vertical temperature profiles, cloud velocity, rain fall, and more.
(3) This data needs to be collected from the different sources and stored for later access.
(4) The collected data is analyzed and transformed into a common format (e.g. Fahrenheit to Celsius scale). The normalized values are used to create the current state of the atmosphere.
(5) Then, a numerical weather forecast is made based on mathematical-physical models (e.g. GFS - Global Forecast System, UKMO - United Kingdom MOdel, GME - global model of Deutscher Wetterdienst). The environmental area needs to be discretized beforehand using grid cells. The physical parameters measured in Step 2 are exposed in 3D space as timely function. This leads to a system of partial differential equations reflecting the physical relations that is solved numerically.
(6) The results of the numerical models are complemented with a statistical interpretation (e.g. with MOS - Model-Output-Statistics). That means the forecast result of the numerical models is compared to statistical weather data. Known forecast failures are corrected.
(7) The numerical post-processing is done with DMO (Direct Model Output): the numerical results are interpolated for specific geological locations.
(8) Additionally, a statistical post-processing step removes failures of measuring devices (e.g. using KALMAN filters).
(9) The statistical interpretation and the numerical results are then observed and interpreted by meteorologists based on their subjective experiences.
(10) Finally, the weather forecast is visualized and presented to interested people." [iaas.uni-stuttgart.de/ forschung/ projects/ simtech/ sim-workflows.php]
The example "Workflow diagram - Weather forecast" was drawn using the ConceptDraw PRO diagramming and vector drawing software extended with the Workflow Diagrams solution from the Business Processes area of ConceptDraw Solution Park.
Work Flow Chart
What is a Work Flow Chart? It is a chart which visually displays the step-by-step transferring of data, documents and tasks during the work. ConceptDraw PRO extended with Workflow Diagrams solution from the Business Processes area of ConceptDraw Solution Park is the best software for drawing the Work Flow Chart of any complexity.
 Workflow Diagrams
Workflow Diagrams solution extends ConceptDraw PRO software with samples, templates and vector stencils library for drawing the work process flowcharts.
Types of Flowcharts
A Flowchart is a graphical representation of process, algorithm, workflow or step-by-step solution of the problem. It shows the steps as boxes of various kinds and connects them by arrows in a defined order depicting a flow. There are twelve main Flowchart types: Basic Flowchart, Business Process Modeling Diagram (BPMN), Cross Functional Flowchart, Data Flow Diagram (DFD), IDEF (Integrated DEFinition) Flowchart, Event-driven Process Chain (EPC) Diagram, Influence Diagram (ID), Swimlane Flowchart, Process Flow Diagram (PFD), Specification and Description Language (SDL) Diagram, Value Stream Mapping, Workflow Diagram. Using the Flowcharts solution from the Diagrams area of ConceptDraw Solution Park you can easy and quickly design a Flowchart of any of these types. This solution offers a lot of special predesigned vector symbols for each of these widely used notations. They will make the drawing process of Flowcharts much easier than ever. Pay also attention for the included collection of ready Flowchart examples, samples and quick-start templates. This is business process improvement tools. If you are looking for MS Visio for your Mac, then you are out of luck, because it hasn't been released yet. However, you can use Visio alternatives that can successfully replace its functions. ConceptDraw PRO is an alternative to MS Visio for Mac that provides powerful features and intuitive user interface for the same.
Business People Figures
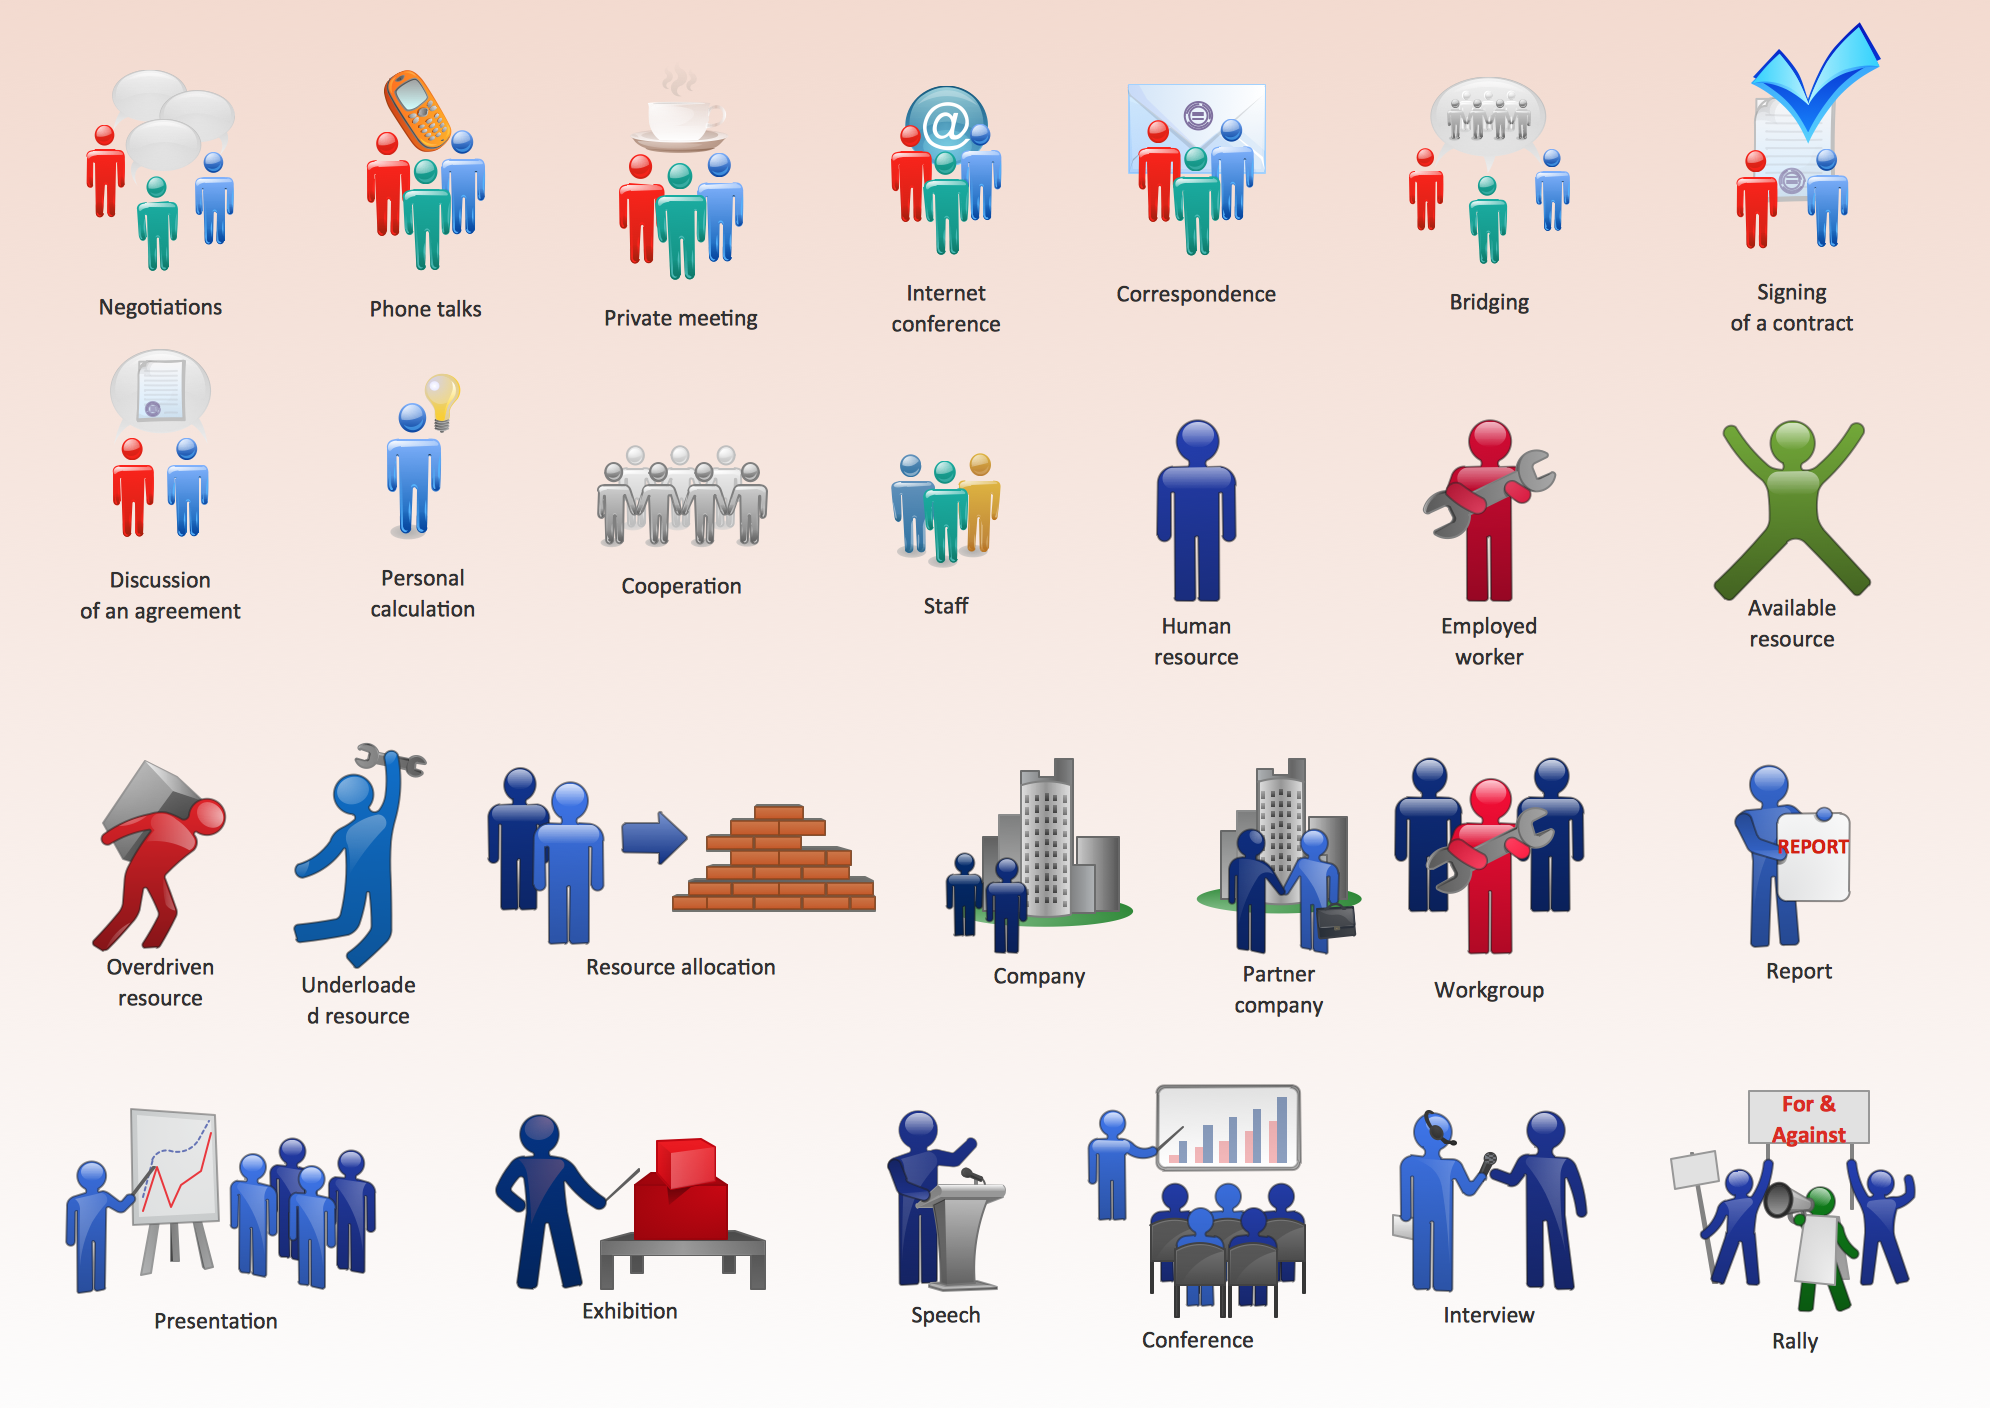
Nowdays business people’s figures are most favourite vector illustrations among presenters and designers. It is easy to make them and use, but they can make your graphics look really good looking & eye catching. Just check ConceptDraw business perople figusers pictures, you will see all kinds of silhouetes: Staff, Employed workers, Persons and Groups symbols. Best popular vector pictures are: men, dancing people, business man. Use human contours wise and it will help you to tell main idea of your design message.Process Flow Chart Symbols
Process Flow Chart is a visual diagram which shows the processes and relationships between the major components in a system, and uses for this the special process flow chart symbols: special shapes to represent different types of actions and process steps, lines and arrows to represent relationships and sequence of steps. It often named process flow diagram, it use colored flowchart symbols. It is incredibly convenient to use the ConceptDraw PRO software extended with Flowcharts Solution from the "Diagrams" Area of ConceptDraw Solution Park for designing professional looking Process Flow Charts.Drawing a Nature Scene
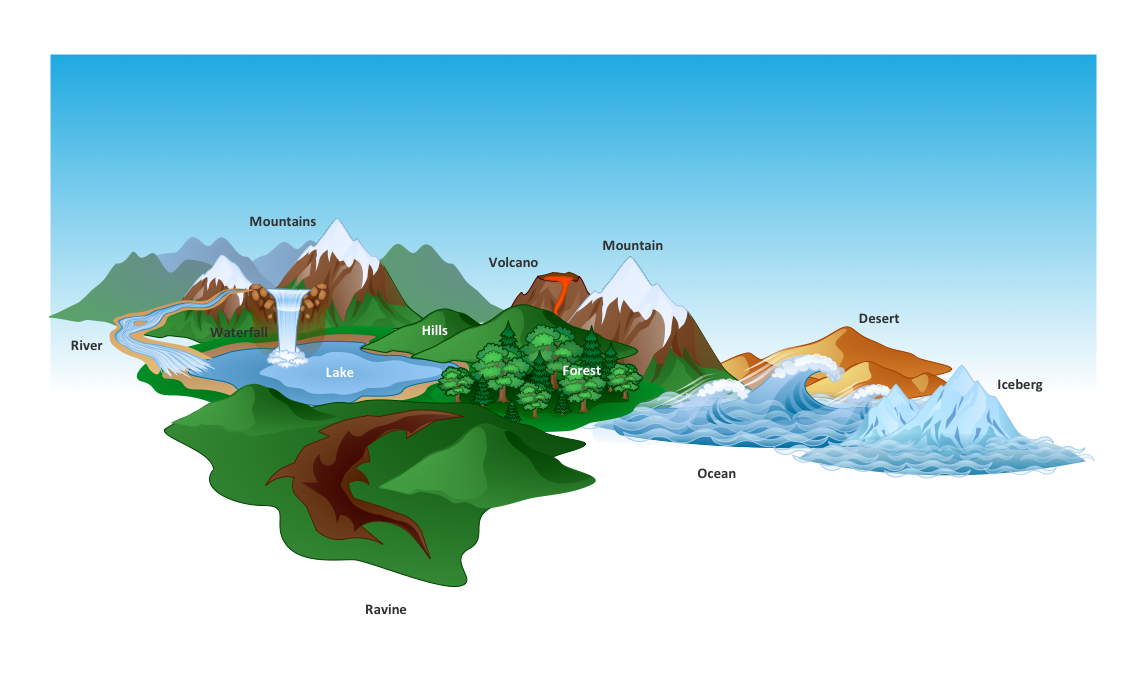
ConceptDraw PRO is a drawings software for creating Nature scenes. Nature solution from ConceptDraw Solution Park expands this software with a new library that contains 17 vector objects and samples illustration files.Beautiful Nature Scene: Drawing
The Nature Solution addition to ConceptDraw Solution Park for ConceptDraw PRO includes new libraries that provide a wide range nature objects and it can be used to augment documentation and graphics. Draw beautiful nature scenes using ConceptDraw PRO software with Nature solution.Business People Clipart
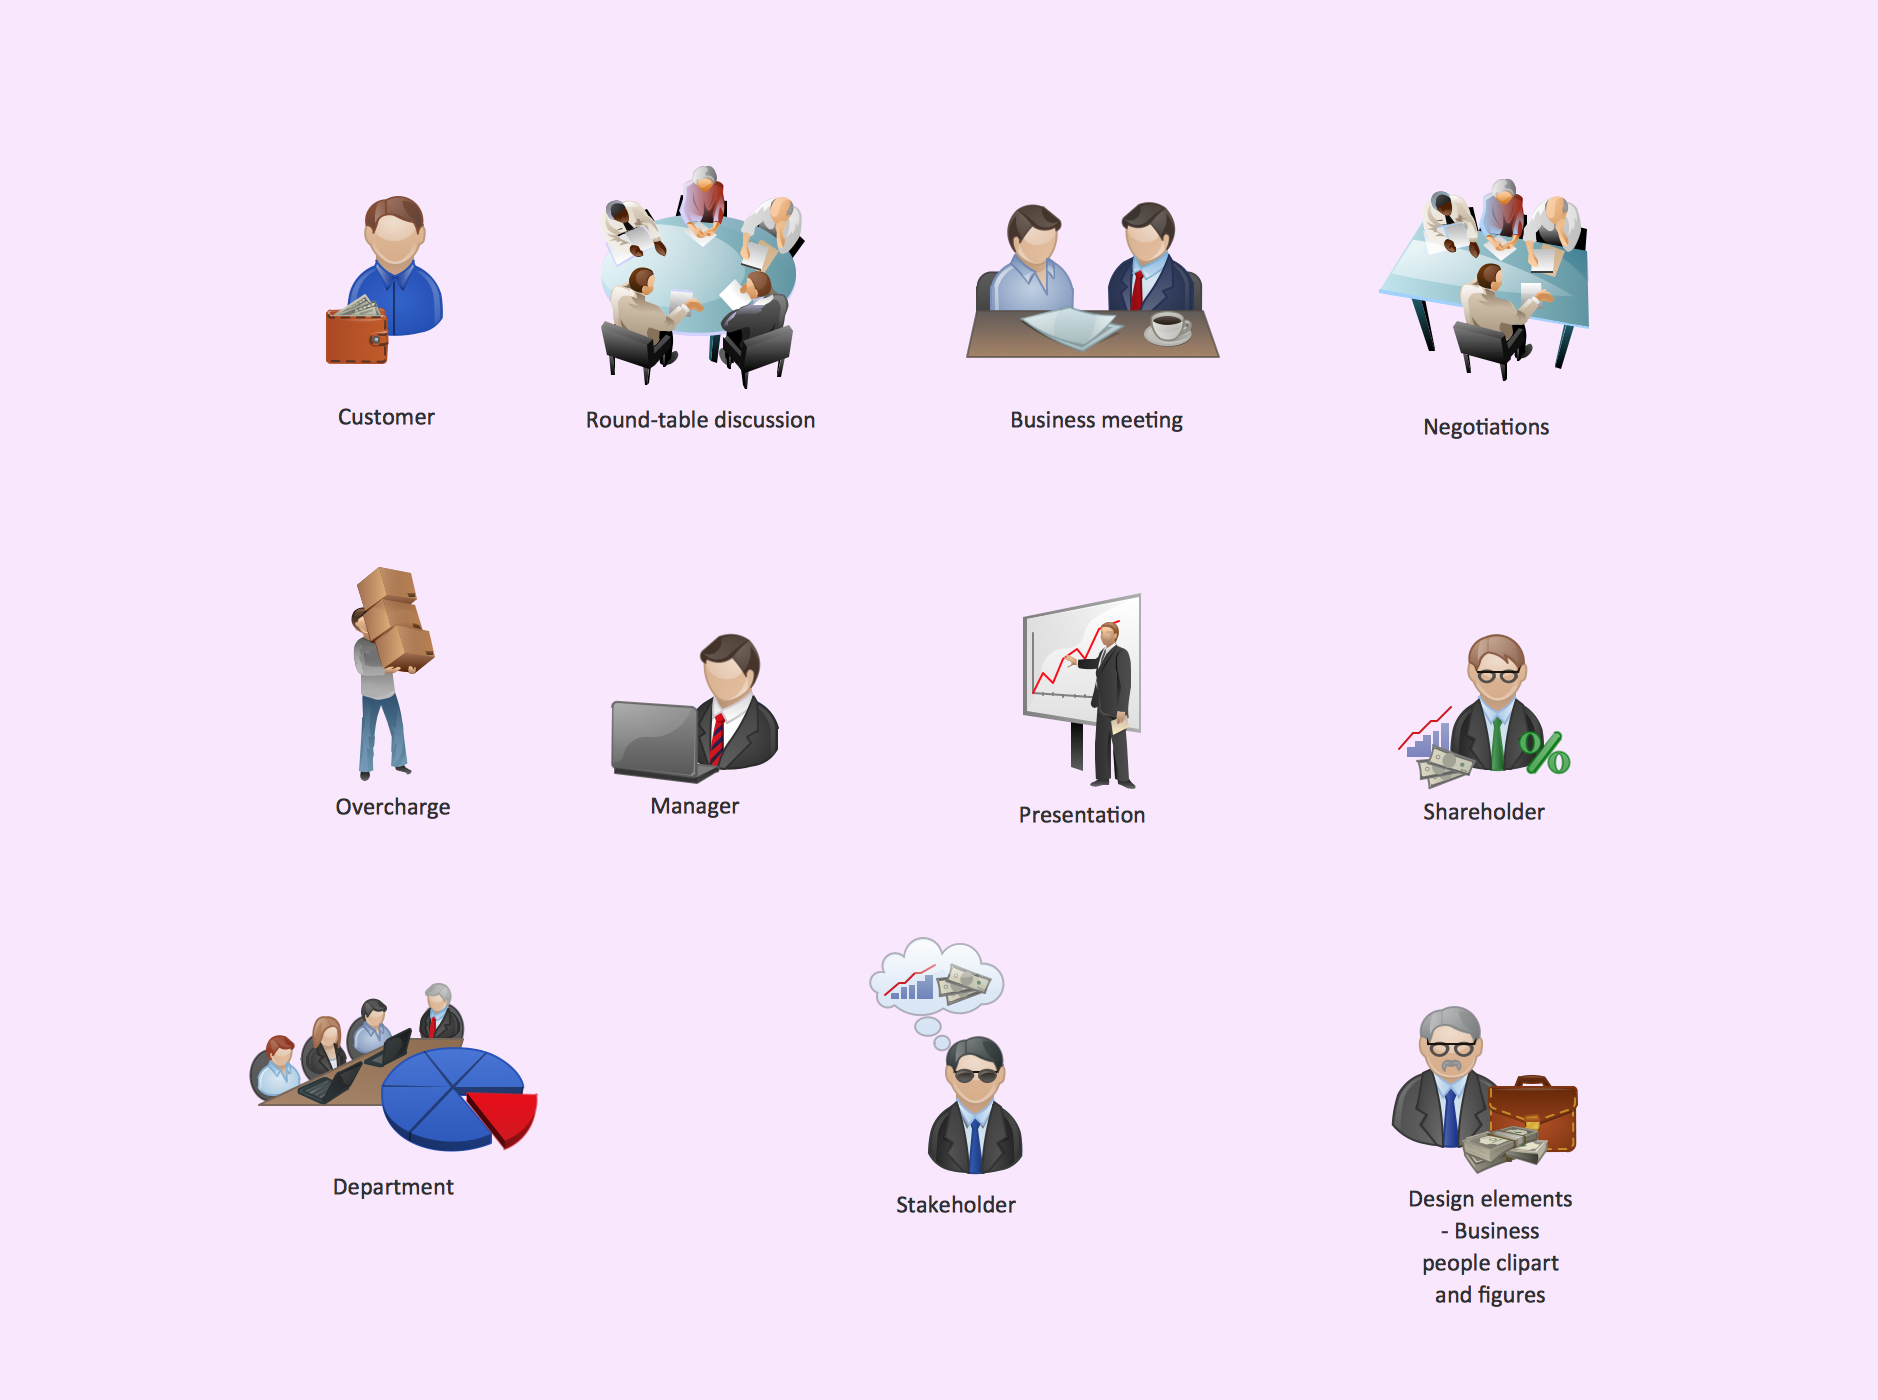
Business People Clipart - Business and Finance solution from Illustration area of ConceptDraw Solution Park. Use it to quick draw illustrations, diagrams and infographics for your business documents, presentations and websites. The vector stencils library Business People Clipart includes 12 images.Drawing Illustration
The Nature Solution addition to ConceptDraw Solution Park for ConceptDraw PRO includes new libraries that provide a wide range nature objects and it can be used in many areas.
 Education Mind Maps
This solution extends ConceptDraw MINDMAP software with scientific and educational mind maps for educational documents, presentations, and websites.
Beauty in nature Illustrations and Clipart
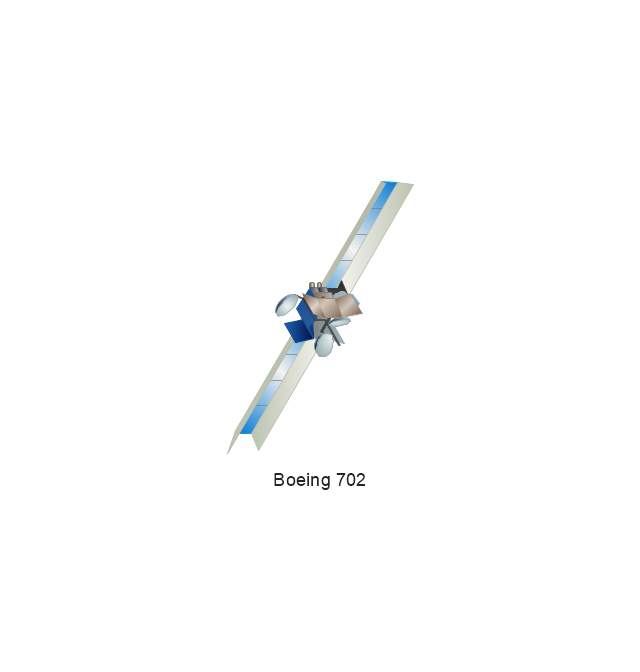
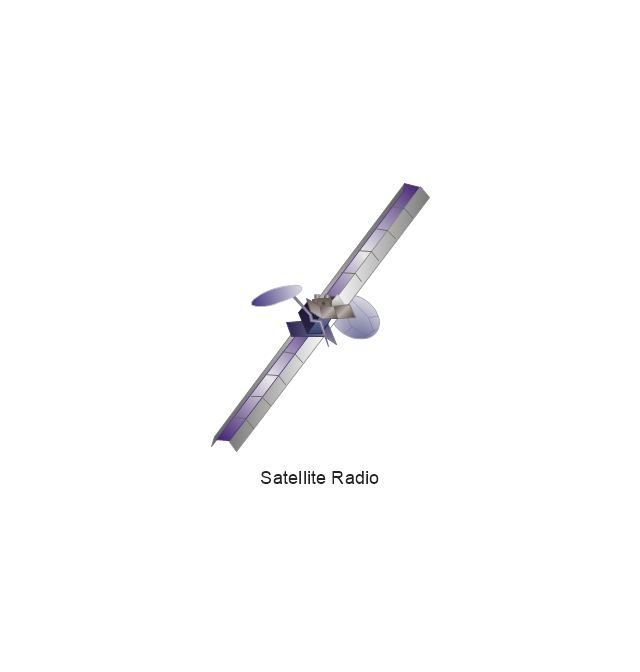
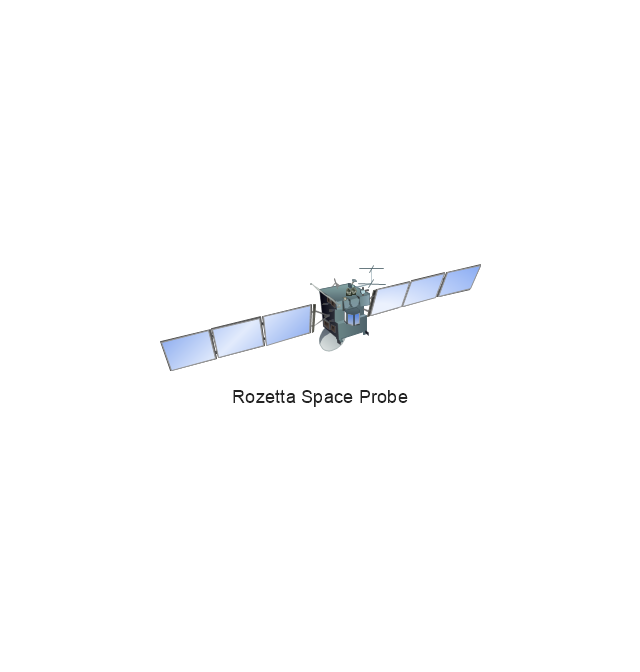
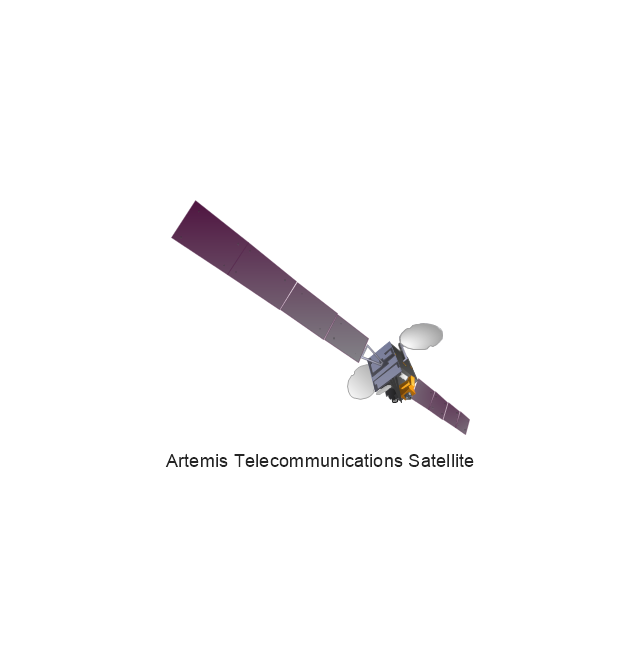
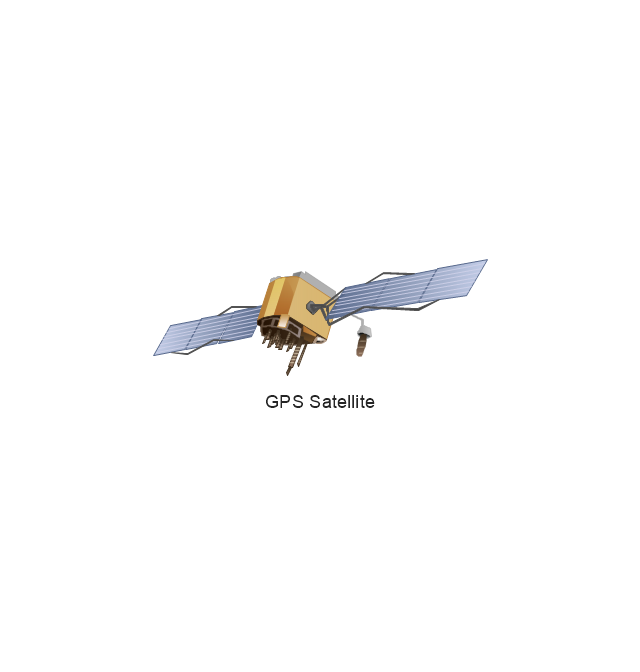
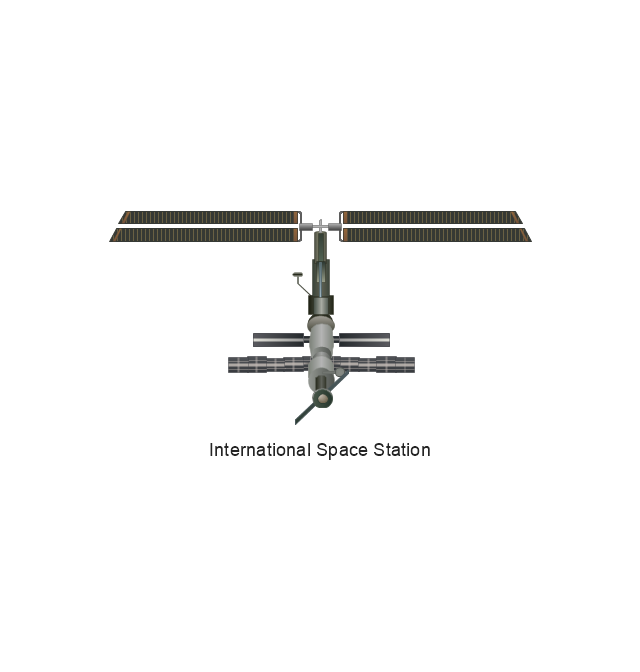
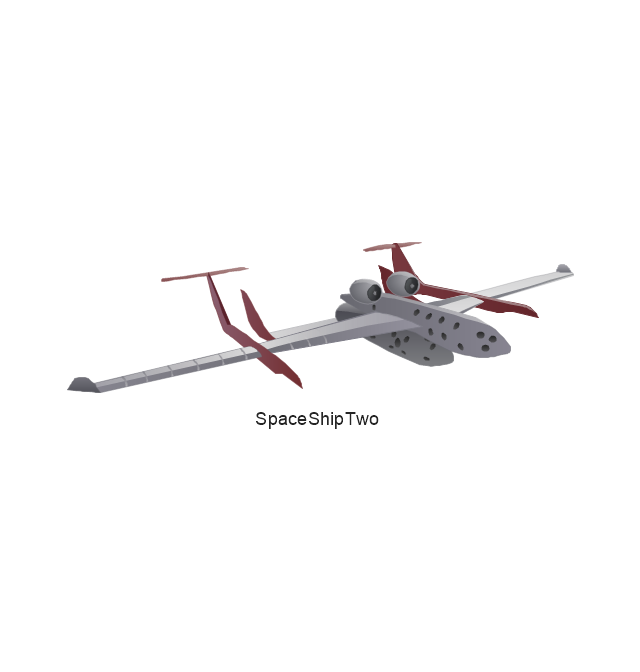
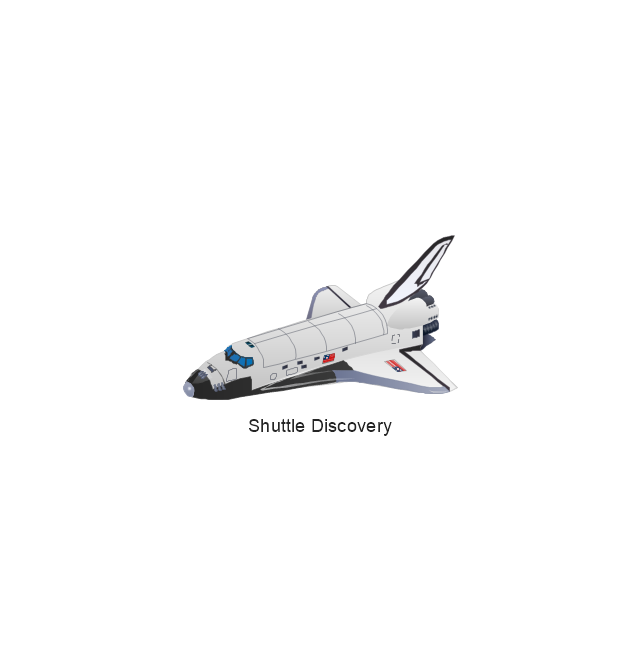
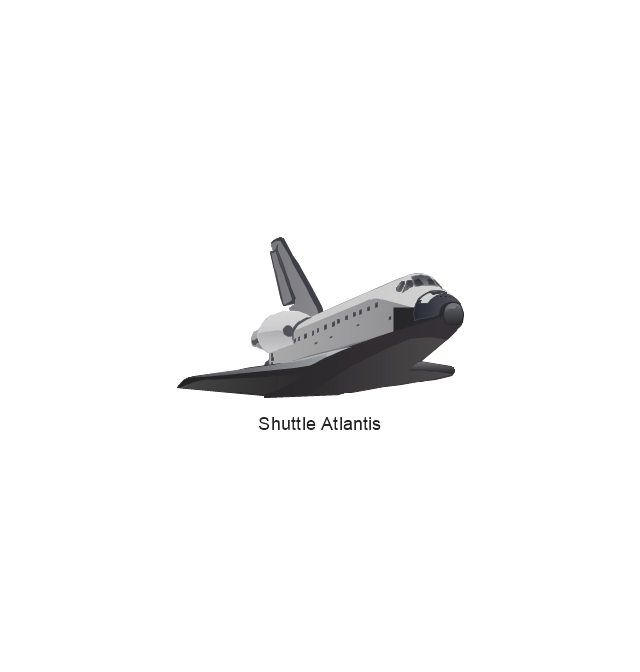
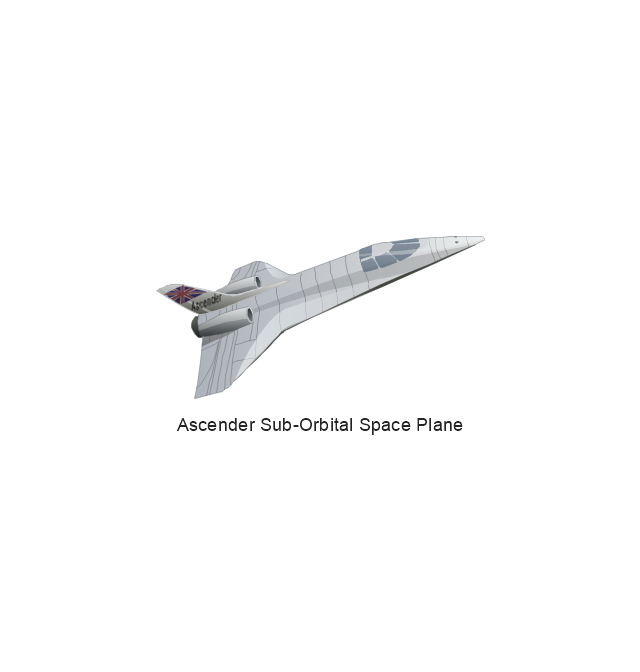
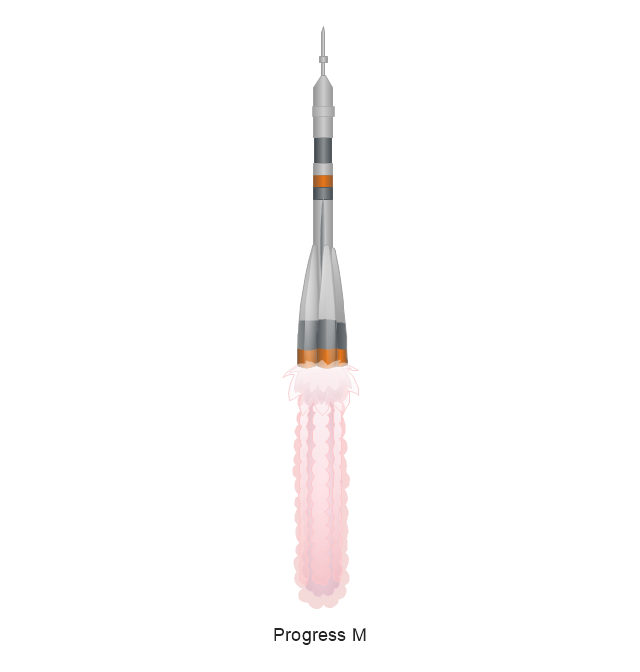
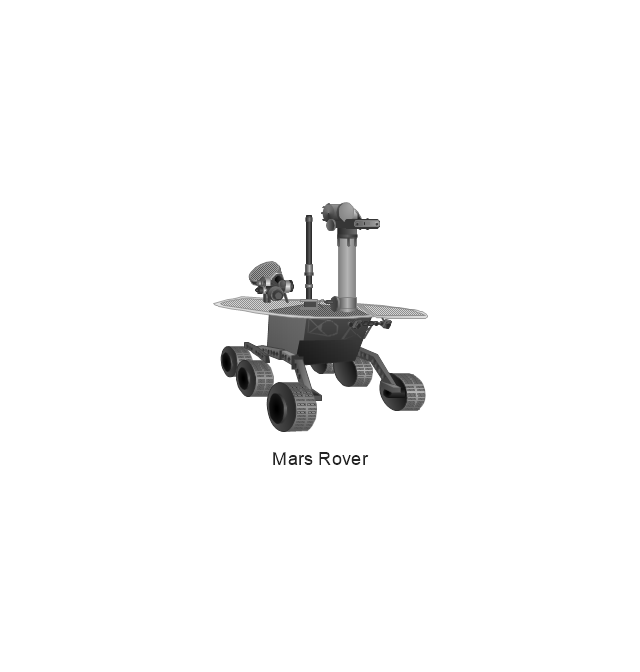
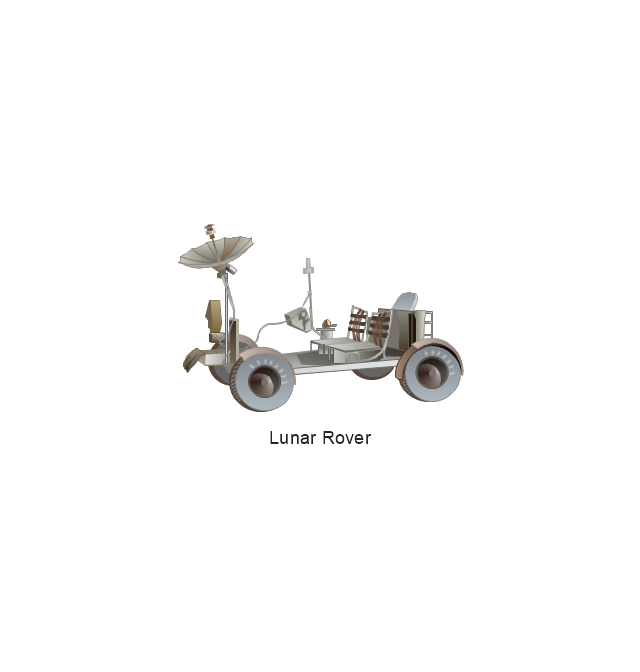
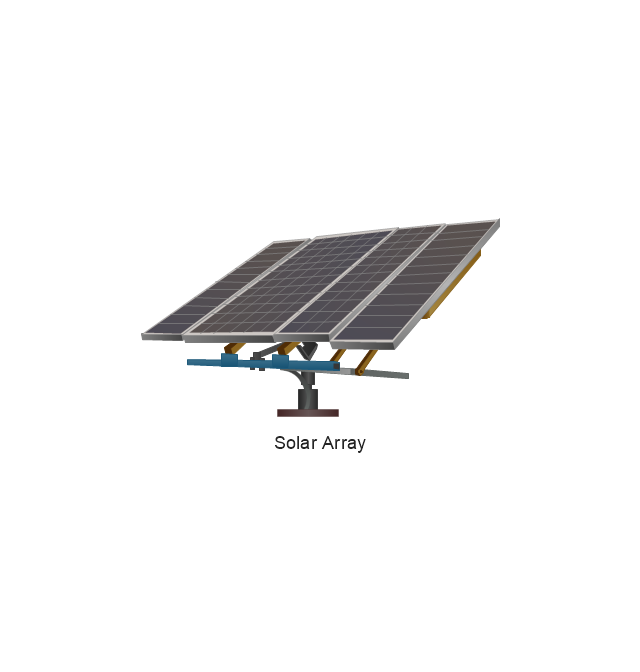
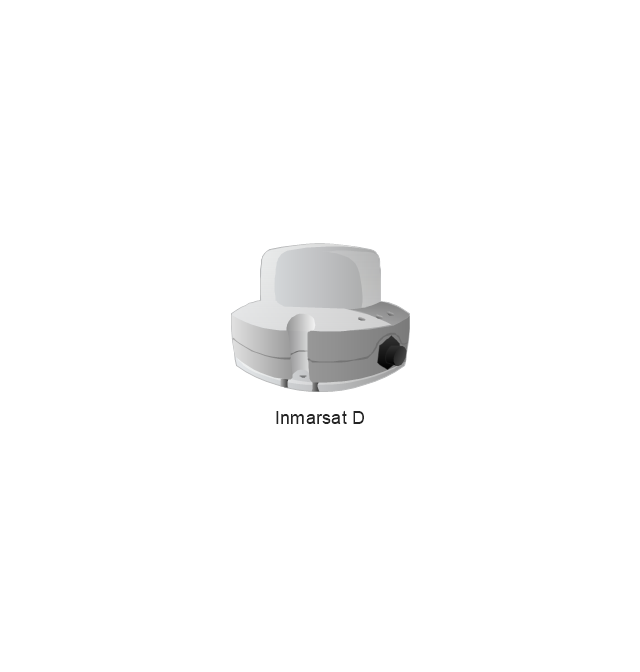
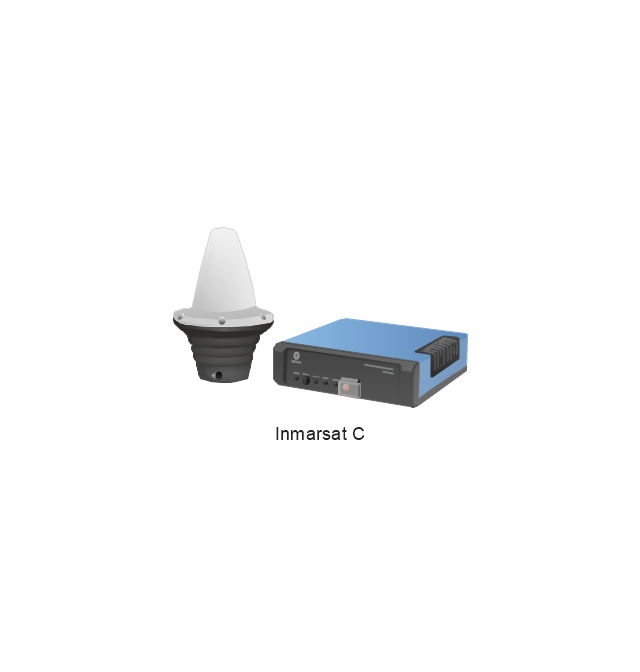
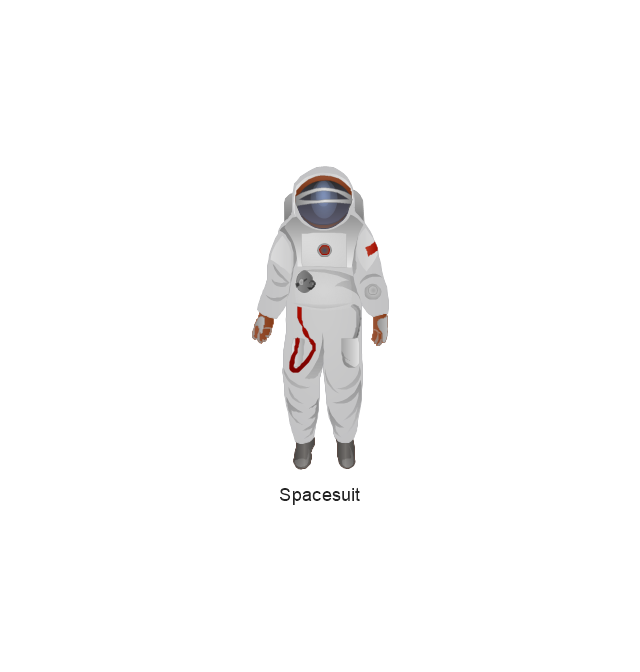
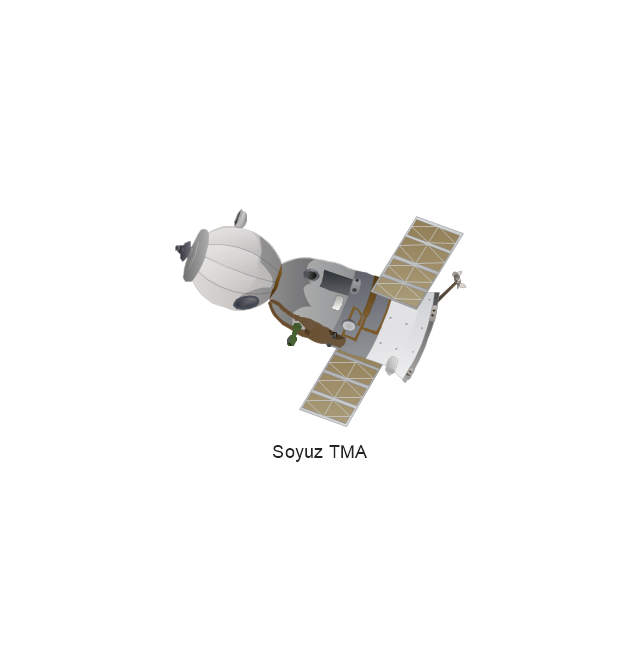
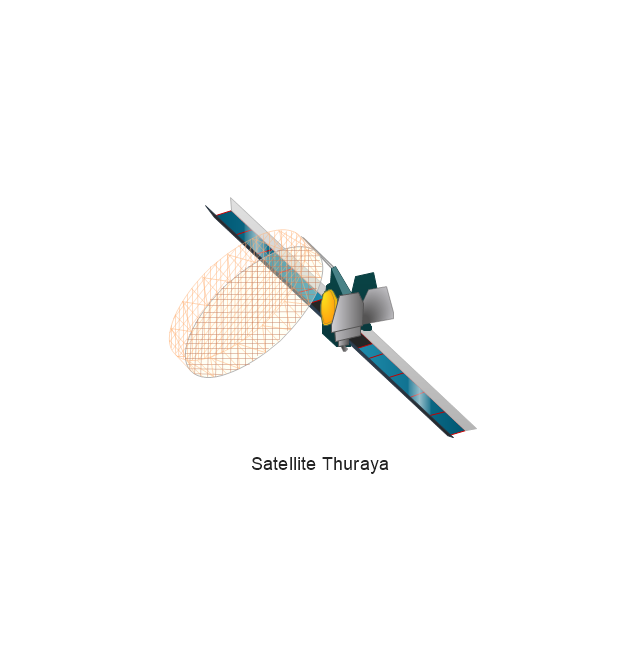
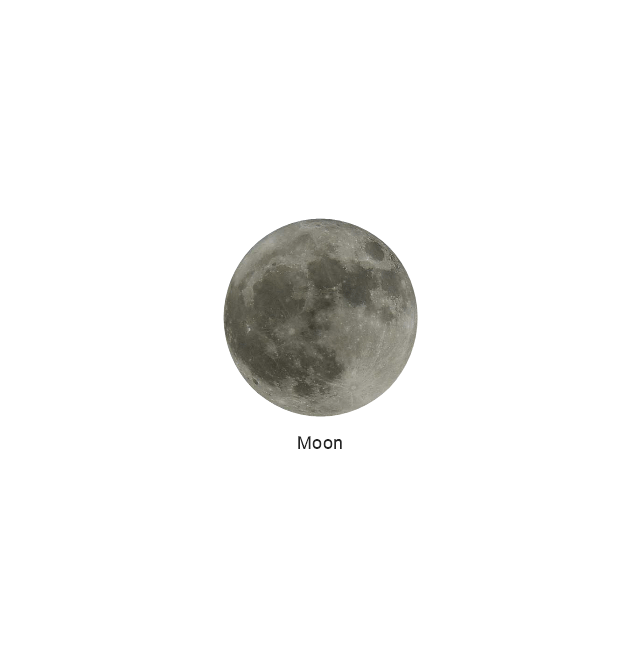
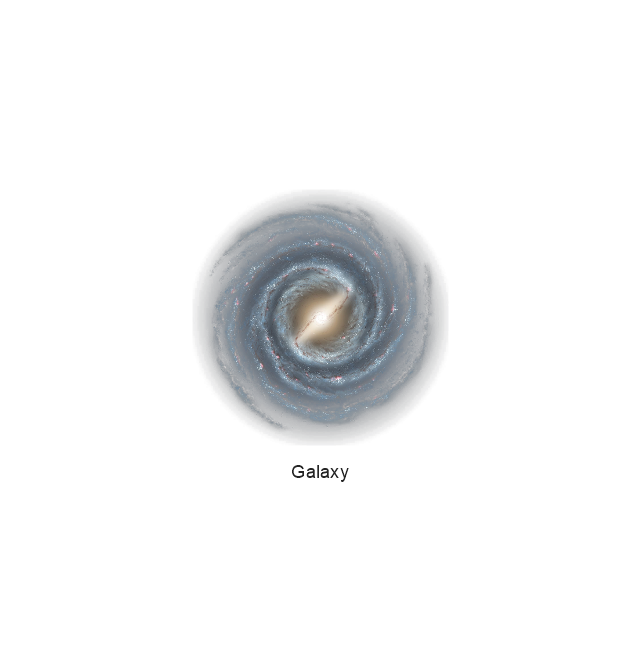
Nature solution expands our software possibilities to create beautiful illustrations and cliparts with the new library which contains 17 vector objects.The vector stencils library "Aerospace" contains 38 clip art images for creating aerospace illustrations, presentation slides, infographics and webpages using the ConceptDraw PRO diagramming and vector drawing software.
"Aerospace describes the human effort in science, engineering and business to fly in the atmosphere of Earth (aeronautics) and surrounding space (astronautics). Aerospace organisations research, design, manufacture, operate, or maintain aircraft and/ or spacecraft. Aerospace activity is very diverse, with a multitude of commercial, industrial and military applications.
Aerospace is not the same as airspace, which is the physical air space directly above a location on the ground." [Aerospace. Wikipedia]
The vector stencils library "Aerospace" is included in the Aerospace and Transport solution from the Illustrations area of ConceptDraw Solution Park.
www.conceptdraw.com/ solution-park/ illustrations-aerospace-transport
- Workflow diagram - Weather forecast | How can you illustrate the ...
- Workflow diagram - Weather forecast | Work Flow Chart | Workflow ...
- Workflow diagram - Weather forecast | Work Flow Chart | Types of ...
- Types of Flowcharts | Workflow diagram - Weather forecast | Work ...
- Workflow diagram - Weather forecast | Providing telecom services ...
- Workflow diagram - Weather forecast | Types of Flowcharts | Line ...
- Process Flowchart | E R Diagram Of Online Weather Report
- Workflow diagram - Weather forecast | Process Flowchart ...
- Workflow diagram - Weather forecast | Process Flowchart | Types of ...
- Workflow diagram - Weather forecast | Workflow Diagram Software ...
- Process Flowchart | Earthquake disaster assessment - Workflow ...
- ER Diagram Online Weather Report
- Process Flow Chart Symbols | How can you illustrate the weather ...
- Process Flowchart | Basic Flowchart Symbols and Meaning ...
- Workflow diagram - Weather forecast | Venn Diagram Examples for ...
- Weather Report As Piechart
- Earthquake disaster assessment - Workflow diagram | Workflow ...
- Process Flowchart | Basic Flowchart Symbols and Meaning | An ...
- Workflow Diagram Symbols | Workflow diagram - Weather forecast ...
- Process Flowchart | Workflow Diagrams | Types of Flowcharts | Data ...


