 Event-driven Process Chain Diagrams
Event-driven Process Chain (EPC) Diagram is a type of flowchart widely used for modeling in business engineering and reengineering, business process improvement, and analysis. EPC method was developed within the Architecture of Integrated Information Systems (ARIS) framework.
 Website Wireframe
The innovative Website Wireframe solution enhances the ConceptDraw PRO v10 functionality with newest wireframe tools, libraries with variety of predesigned icons, symbols, buttons, graphics, forms, boxes, and many other vector elements, templates and professionally designed samples, which make it the best wireframing software. Website Wireframe solution gives you significant advantages when designing and maintaining websites, creating skeletal and content-free depictions of website structure, making website prototypes and planning the content arrangement before committing to design, also speeds up the processes of sketching, producing and sharing wireframe examples of website style and interface design.
This flowchart example was created on the base of land sales process diagram from the Property management webpage of the VicRoads website.
[www.vicroads.vic.gov.au/ planning-and-projects/ property-services/ property-management]
"VicRoads or the Roads Corporation of Victoria is a statutory corporation which is the state road and traffic authority in the state of Victoria, Australia. It is responsible for maintenance and construction of the state arterial road network, as well as driver licensing and vehicle registration. VicRoads has broad responsibility for road safety policy and research. It is also responsible for regulating the accident towing industry in Victoria." [VicRoads. Wikipedia]
"Sales Process.
Once it has been established with the relevant VicRoads Regions/ Projects and other business areas that properties are identified as surplus to VicRoads’ operational needs, they are incorporated in the VicRoads annual sales program.
Following approval: relevant VicRoads Regional Manager and the VicRoads Chief Executive (and in some circumstances Minster for Public Transport and Roads) must approve all land deemed surplus and available for disposal.
The method of sale is then determined and consultant advice is sought:
(1) Planning.
(2) Valuer General Victoria (Valuer General’s office must provide a valuation for all sales).
(3) Government Land Monitor (Land Monitor approval is sought if the value exceeds $750,000).
(4) Environmental.
(5) Local Council." [www.vicroads.vic.gov.au/ planning-and-projects/ property-services/ property-management]
The example "Land sales process flowchart" was created using the ConceptDraw PRO diagramming and vector drawing software extended with the Sales Flowcharts solution from the Marketing area of ConceptDraw Solution Park.
HelpDesk
ConceptDraw Software Full Versions Free Download
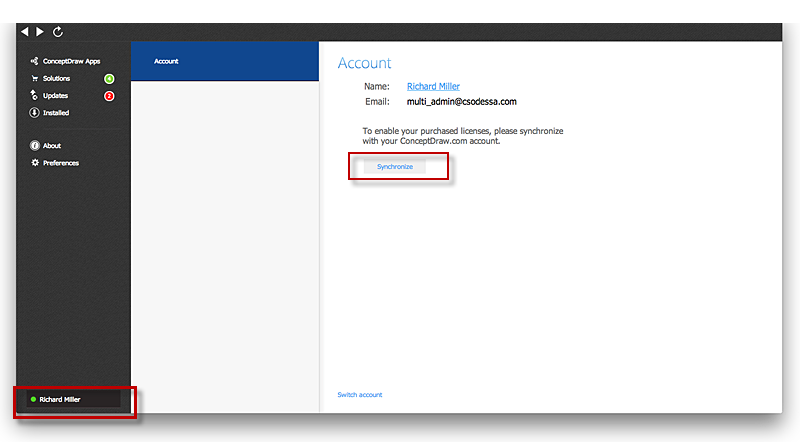
ConceptDraw software provides registered users a 21 day trial period at no charge. It functions exactly as a fully licensed copy of the product does. Once you have activated your account you are then able to download and install ConceptDraw software as well, as solutions from Solution Park. Here is an instructions on how to download and try ConceptDraw products for free. For 21 days the trial functions exactly like the purchased product. There are no limitations to file size, how many times you can print, or any of the products functionality. After the trial period expires, you will be able to open ConceptDraw documents to view.HelpDesk
Flowchart Software Free Download
Making flowchart is an easiest way to depict any typical process. Any complex process, consisting from standard components can be displayed as a Flowchart. ConceptDraw PRO is proved to be a simple and easy tool for creating flowcharts. It does not require the skills of a professional designer. Making flowchart to map any process you will see the ways of its optimization and improvement. Flowchart software is here and you can download it for free.
 Basic EPC Diagrams
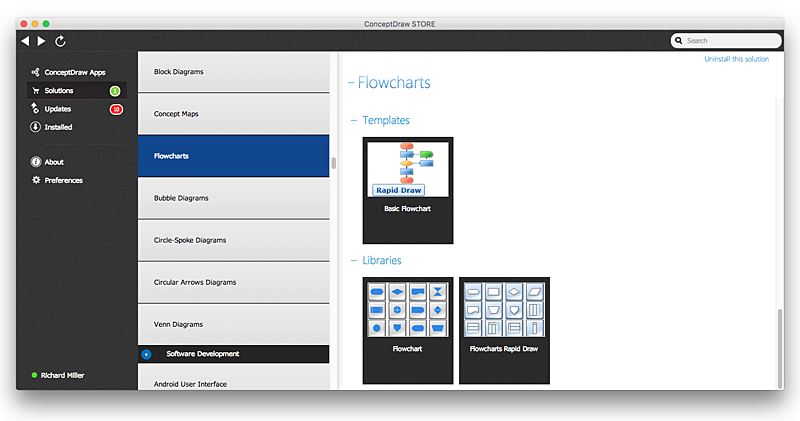
The Event-driven Process Chain Diagrams solution extends ConceptDraw PRO software with EPC templates, samples, and vector shape library for the drawing of EPC diagrams.
- Website Login And Registration Process Flowchart
- Sample Flowchart For Registration Process
- Flowchart | Business process Flow Chart - Event-Driven Process ...
- Flowchart Software . Flow Charts Website Login and Registration ...
- Design Registration Process Simple Flowchart
- Flowchart Of Registration Process
- Flowchart | Business process Flow Chart - Event-Driven Process ...
- Flowchart | Business process Flow Chart - Event-Driven Process ...
- Flowchart | Business process Flow Chart - Event-Driven Process ...
- Event-driven Process Chain (EPC) Diagrams | Rapid UML | Website ...
- Flowchart | Business process Flow Chart - Event-Driven Process ...
- Project Registration Process
- Flowchart | Business process Flow Chart - Event-Driven Process ...
- Flowchart | Data Flow Diagrams | Wireframe Examples | User ...
- Flow Chart Of Registration Process
- Login and registration processing - EPC diagram | Flowchart ...
- UML Use Case Diagram Example Registration System | Wireframe ...
- Sequence Diagram For Website Registration And Login
- Flowchart | Business process Flow Chart - Event-Driven Process ...
- Cross-Functional Flowchart - to draw cross functional process maps ...


