Cloud Computing Architecture
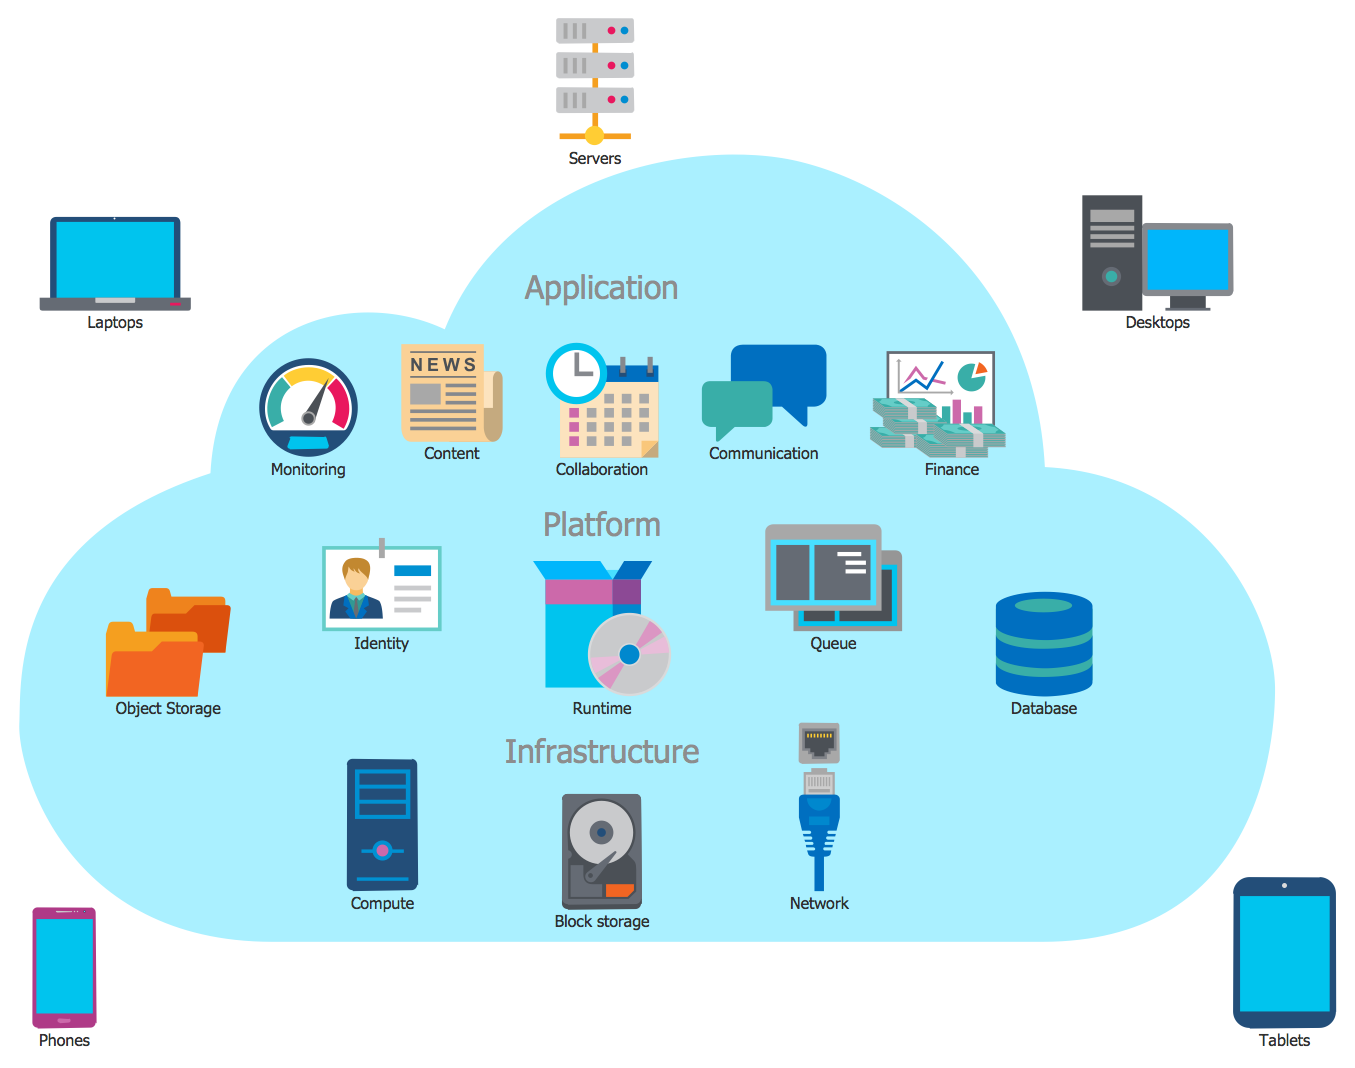
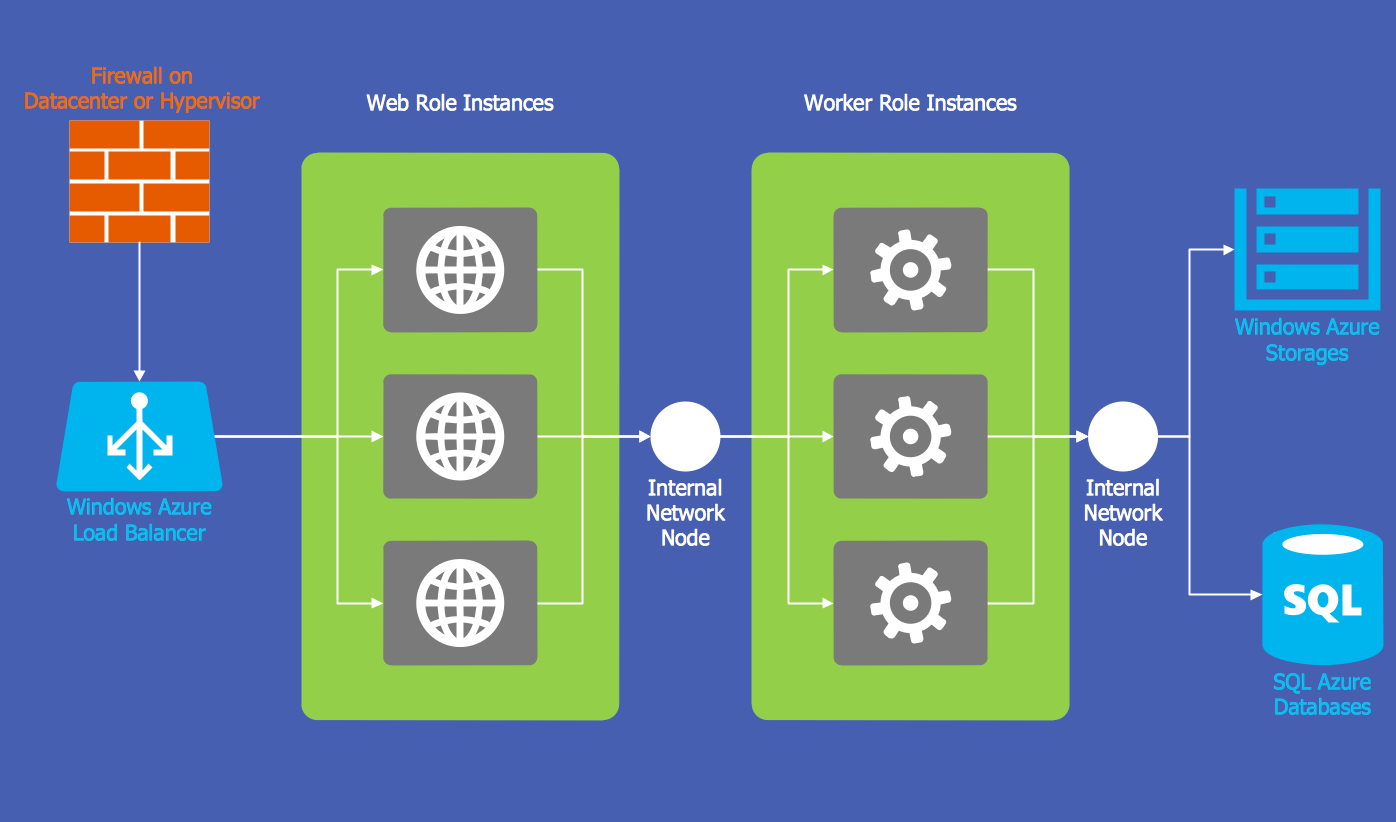
The Cloud Computing Architecture is the structure of the system, which is based on the needs of end-user and includes the set of components and subcomponents required for cloud computing, among them cloud resources, services, middleware, software components, front-end platforms (cloud clients), cloud-based back end platforms (servers, storage), and a network (Internet, Intranet, Intercloud). When designing the Cloud Computing Architecture diagrams, the ConceptDraw PRO diagramming and vector drawing software advises to turn attention for the powerful Cloud Computing Diagrams solution from the extensive Computers and Network area of ConceptDraw Solution Park.This Azure cloud architecture pattern diagram template was created on the base of figure in the article "External Configuration Store Pattern" from the Microsoft Developer Network (MSDN) website.
"External Configuration Store Pattern.
Move configuration information out of the application deployment package to a centralized location. This pattern can provide opportunities for easier management and control of configuration data, and for sharing configuration data across applications and application instances. ...
The majority of application runtime environments include configuration information that is held in files deployed with the application, located within the application folders. In some cases it is possible to edit these files to change the behavior of the application after it has been deployed. However, in many cases, changes to the configuration require the application to be redeployed, resulting in unacceptable downtime and additional administrative overhead. ...
Store the configuration information in external storage, and provide an interface that can be used to quickly and efficiently read and update configuration settings. The type of external store depends on the hosting and runtime environment of the application. In a cloud-hosted scenario it is typically a cloud-based storage service, but could be a hosted database or other system.
The backing store chosen for configuration information should be fronted by a suitable interface that provides consistent and easy to use access in a controlled way that enables reuse. Ideally, it should expose the information in a correctly typed and structured format. The implementation may also need to authorize users’ access in order to protect configuration data, and be flexible enough to allow multiple versions of the configuration (such as development, staging, or production, and multiple release versions of each one) to be stored." [msdn.microsoft.com/ ru-RU/ library/ dn589803.aspx]
The Azure cloud system architecture diagram template "External Configuration Store Pattern" for the ConceptDraw PRO diagramming and vector drawing software is included in the Azure Architecture solutin from the Computer and Networks area of ConceptDraw Solution Park.
HelpDesk
How to Install ConceptDraw on a Second Computer
ConceptDraw products use a cloud-based license model. This means that your license will be automatically added to your ConceptDraw.com account and saved there permanently. Concepdraw licensing agreement allows you to install ConceptDraw software on a second computer. It doesn’t matter if you have two PCs, two Macs; or a Mac and a PC, as long as you are the only user of the ConceptDraw product you can install it wherever it’s needed. Thus you don’t have to worry about losing your license if your computer crashes or you want to install on a second system. When running offline, the ConceptDraw applications will run in the mode featured for the license type, assigned to your ConceptDraw.com account.Windows Azure
The Microsoft Windows Azure platform is a highly flexible cloud-based solution with variety of services which supports not only the execution of .NET applications, but also allows developers to use programming languages like Java, PHP, Node.js, or Python.ConceptDraw PRO diagramming and vector drawing software provides the Azure Architecture Solution from the Computer and Networks area of ConceptDraw Solution Park with a lot of useful tools which make easier: illustration of Windows Azure possibilities and features, describing Windows Azure Architecture, drawing Azure Architecture Diagrams, depicting Azure Cloud System Architecture, describing Azure management, Azure storage, documenting Azure services.
Cloud Computing Architecture Diagrams
For documenting the Cloud Computing Architecture with a goal to facilitate the communication between stakeholders are successfully used the Cloud Computing Architecture diagrams. It is convenient and easy to draw various Cloud Computing Architecture diagrams in ConceptDraw PRO software with help of tools of the Cloud Computing Diagrams Solution from the Computer and Networks Area of ConceptDraw Solution Park.Cloud Computing
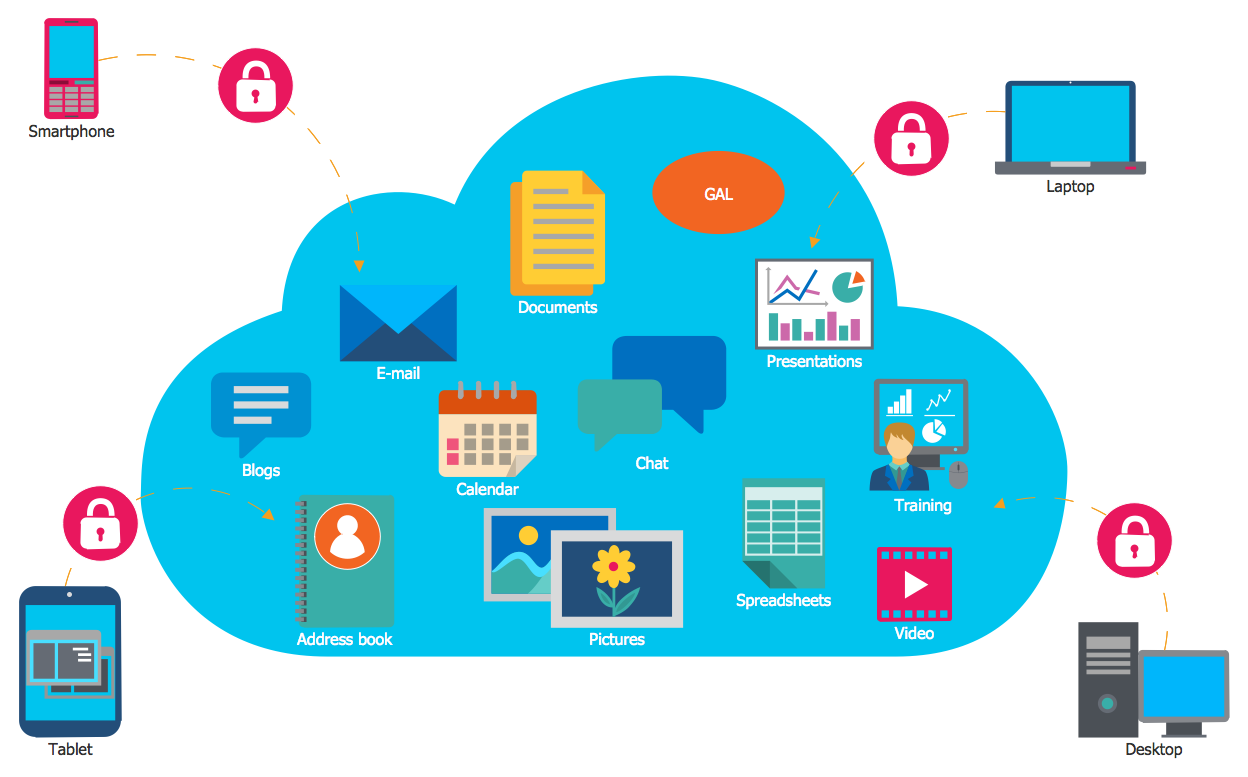
The Cloud Computing is the use of the software and hardware that includes the great number of computers connected over the communication network such as the Internet. The Cloud name comes from the usage the cloud symbol on the system diagrams as the abstraction for the complex network infrastructure. This term is used as a marketing metaphor for the Internet.This example was created in ConceptDraw PRO using the Computer and Networks Area of ConceptDraw Solution Park and shows the Cloud Computing.
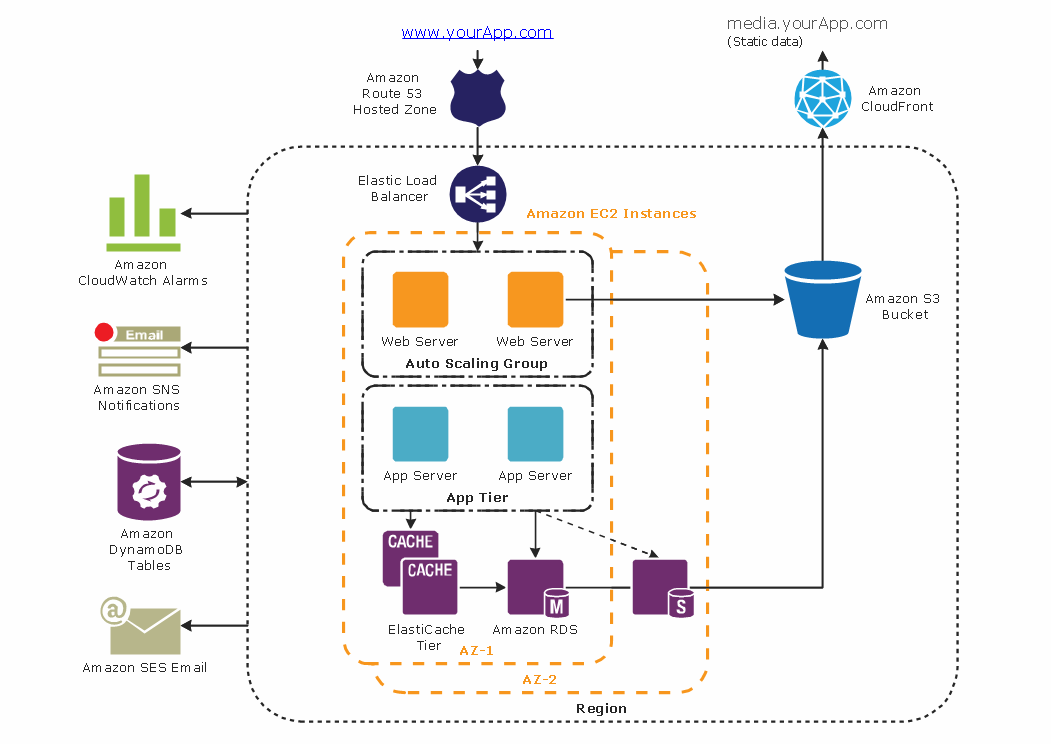
Diagramming tool - Amazon Web Services and Cloud Computing Diagrams
The AWS Architecture Diagrams solution includes icons, sample and templates for several Amazon Web Services products and resources, to be used when creating architecture diagrams. The icons are designed to be simple so that you can easily incorporate them in your diagrams and put them in your whitepapers, presentations, datasheets, posters or any technical material you like.HelpDesk
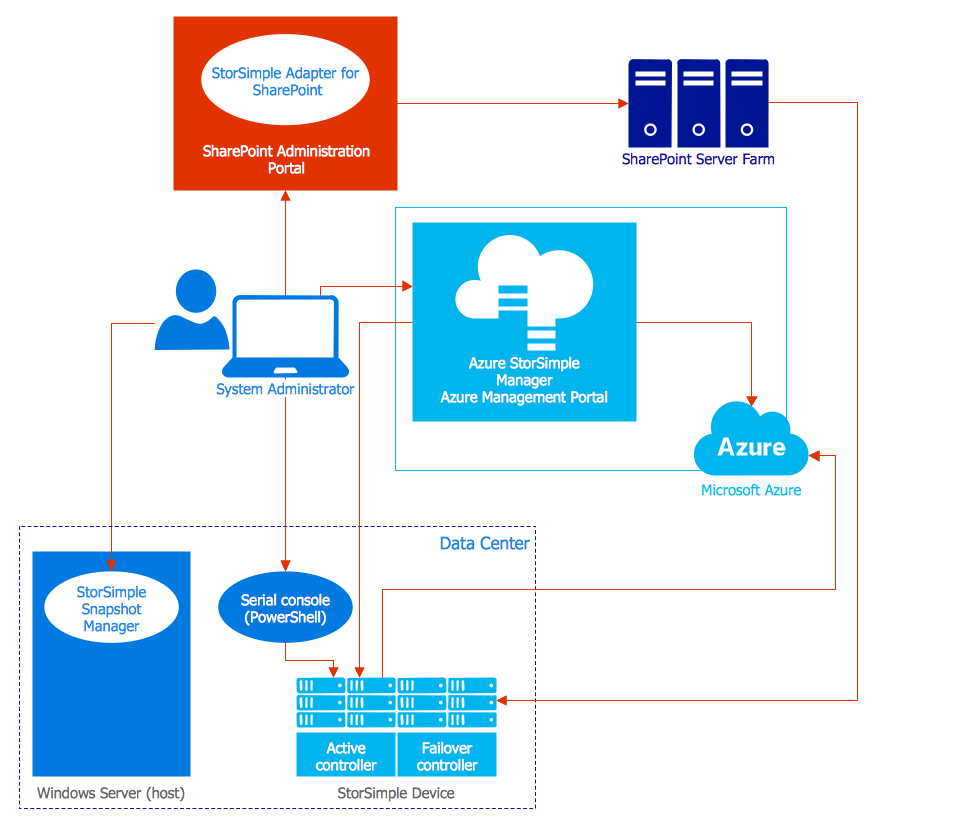
How to Create an Azure Architecture Diagram Using ConceptDraw PRO
Microsoft Azure is an open cloud computing platform, designed by Microsoft. It provides the ability to develop and launch applications and to store data on servers in distributed data centers. Microsoft Azure cloud offers two models - platform as a service (PaaS) and infrastructure as a service (IaaS). The efficiency of the Windows Azure platform is supported by a global network of Microsoft data centers. Developers use Azure Architecture diagrams to visualize and document the architecture of applications bases on Microsoft Azure services. Using the ConceptDraw Azure Architecture solution makes much easier the work on documenting the Microsoft Azure architecture.This work flow chart sample was redesigned from the picture "Weather Forecast" from the article "Simulation Workflows".
[iaas.uni-stuttgart.de/ forschung/ projects/ simtech/ sim-workflows.php]
"(1) The weather is predicted for a particular geological area. Hence, the workflow is fed with a model of the geophysical environment of ground, air and water for a requested area.
(2) Over a specified period of time (e.g. 6 hours) several different variables are measured and observed. Ground stations, ships, airplanes, weather balloons, satellites and buoys measure the air pressure, air/ water temperature, wind velocity, air humidity, vertical temperature profiles, cloud velocity, rain fall, and more.
(3) This data needs to be collected from the different sources and stored for later access.
(4) The collected data is analyzed and transformed into a common format (e.g. Fahrenheit to Celsius scale). The normalized values are used to create the current state of the atmosphere.
(5) Then, a numerical weather forecast is made based on mathematical-physical models (e.g. GFS - Global Forecast System, UKMO - United Kingdom MOdel, GME - global model of Deutscher Wetterdienst). The environmental area needs to be discretized beforehand using grid cells. The physical parameters measured in Step 2 are exposed in 3D space as timely function. This leads to a system of partial differential equations reflecting the physical relations that is solved numerically.
(6) The results of the numerical models are complemented with a statistical interpretation (e.g. with MOS - Model-Output-Statistics). That means the forecast result of the numerical models is compared to statistical weather data. Known forecast failures are corrected.
(7) The numerical post-processing is done with DMO (Direct Model Output): the numerical results are interpolated for specific geological locations.
(8) Additionally, a statistical post-processing step removes failures of measuring devices (e.g. using KALMAN filters).
(9) The statistical interpretation and the numerical results are then observed and interpreted by meteorologists based on their subjective experiences.
(10) Finally, the weather forecast is visualized and presented to interested people." [iaas.uni-stuttgart.de/ forschung/ projects/ simtech/ sim-workflows.php]
The example "Workflow diagram - Weather forecast" was drawn using the ConceptDraw PRO diagramming and vector drawing software extended with the Workflow Diagrams solution from the Business Processes area of ConceptDraw Solution Park.
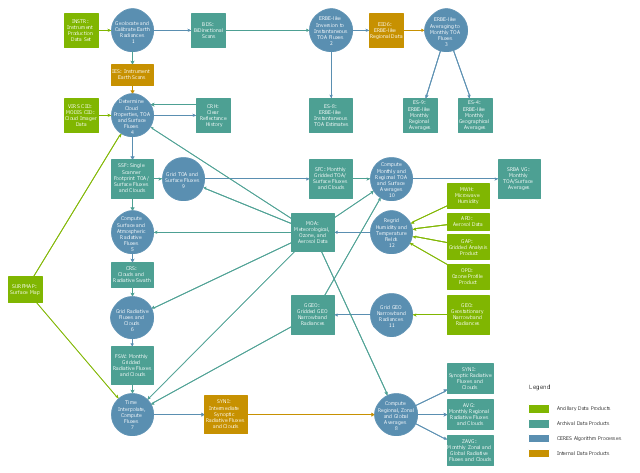
This DFD sample was created on the base of the figure from the NASA website. [asd-www.larc.nasa.gov/ ATBD/ DFD.html]
"Clouds and the Earth's Radiant Energy System (CERES).
EOS-Terra: Understanding Earth's Clouds and Climate.
The Clouds and the Earth's Radiant Energy System (CERES) instrument is one of several that will be flown aboard the Earth Observing System's Terra spacecraft, scheduled for launch in late1999. The data from the CERES instrument will be used to study the energy exchanged between the Sun; the Earth's atmosphere, surface and clouds; and outer space.
The CERES EOS-Terra instrument will be the second CERES instrument in Earth orbit. The first CERES instrument is currently orbiting the Earth aboard the Tropical Rainfall Measuring Mission observatory, which was launched in November 1997. Early results of the TRMM mission show that the first CERES has provided better measurement capabilities than any previous satellite instrument of its kind.
What CERES Will Measure.
CERES will measure the energy at the top of the atmosphere, as well as estimate energy levels in the atmosphere and at the Earth's surface. Using information from very high resolution cloud imaging instruments on the same spacecraft, CERES also will determine cloud properties, including cloud amount, altitude, thickness, and the size of the cloud particles. All of these measurements are critical for advancing our understanding of the Earth's total climate system and further improving climate prediction models.
The CERES instrument is based on NASA Langley's highly successful Earth Radiation Budget Experiment (ERBE) which used three satellites to provide global energy budget measurements from 1984 to 1990." [nasa.gov/ centers/ langley/ news/ factsheets/ CERES.html]
The DFD example "CERES data flow diagram" was created using the ConceptDraw PRO diagramming and vector drawing software extended with the Data Flow Diagrams solution from the Software Development area of ConceptDraw Solution Park.
 ConceptDraw Solution Park
ConceptDraw Solution Park collects graphic extensions, examples and learning materials
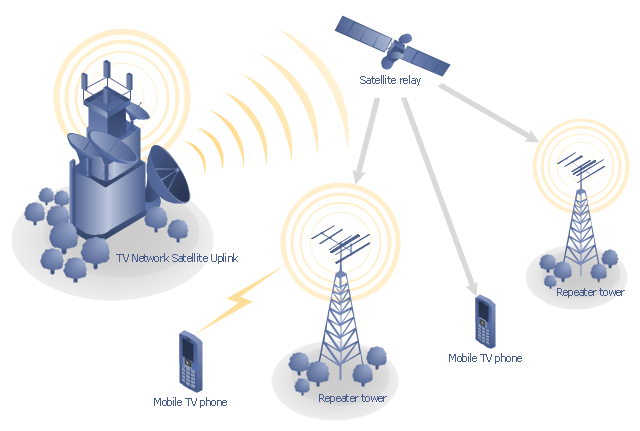
"Satellite television is television programming delivered by the means of communications satellite and received by an outdoor antenna, usually a parabolic reflector generally referred to as a satellite dish, and as far as household usage is concerned, a satellite receiver either in the form of an external set-top box or a satellite tuner module built into a TV set. Satellite TV tuners are also available as a card or a USB peripheral to be attached to a personal computer. In many areas of the world satellite television provides a wide range of channels and services, often to areas that are not serviced by terrestrial or cable providers.
Direct-broadcast satellite television comes to the general public in two distinct flavors - analog and digital. This necessitates either having an analog satellite receiver or a digital satellite receiver. Analog satellite television is being replaced by digital satellite television and the latter is becoming available in a better quality known as high-definition television." [Satellite television. Wikipedia]
"Mobile television is television watched on a small handheld or mobile device. It includes pay TV service delivered via mobile phone networks or received free-to-air via terrestrial television stations. Regular broadcast standards or special mobile TV transmission formats can be used. Additional features include downloading TV programs and podcasts from the internet and the ability to store programming for later viewing. ...
Mobile TV is among the features provided by many 3G phones." [Mobile television. Wikipedia]
"MobiTV, Inc. ... is a provider of end-to-end mobile media solutions. In 2011, the cloud-based MobiTV converged media platform delivered 1.6 billion minutes of live TV, video-on-demand and downloaded content for offline viewing to all tier-one wireless carriers and major mobile operating systems in the United States. ...
MobiTV furnishes programming from more than 40 television channels, offering live news and sports and a variety of full-episode on-demand shows for streaming or download on mobile devices, tablets, personal computers and other Internet-enabled consumer electronics.
MobiTV-powered TV services, which carry the operator’s brand, are accessible on hundreds of devices across multiple wireless carrier partners. ...
MobiTV’s converged media platform is an end-to-end managed service comprising components that work together to securely manage, deliver and play back video across devices both inside and outside the home." [MobiTV. Wikipedia]
This mobile satellite TV network diagram example was created using the ConceptDraw PRO diagramming and vector drawing software extended with the Telecommunication Network Diagrams solution from the Computer and Networks area of ConceptDraw Solution Park.
- Sequence Diagram for Cloud Computing | Cloud Computing | ER ...
- ER Diagram for Cloud Computing | Sequence Diagram for Cloud ...
- Computer network system design diagram | Network Diagramming ...
- Block diagram - Document management system architecture ...
- Store Cloud
- Conceptdraw.com: Mind Map Software, Drawing Tools | Project ...
- Azure Cloud Application
- Mobile satellite communication network diagram | Hybrid satellite ...
- Microsoft Azure | Azure Architecture | Microsoft Azure reference ...
- Data Flow Diagram
- Microsoft Azure | Azure Storage | Azure Architecture | Cloud Platform
- Azure Architecture | Windows Azure | Microsoft Azure | Azure Platform
- Azure Services | Azure Architecture | External configuration store ...
- Block diagram - Document management system architecture | Block ...
- Azure Architecture | How to Create an Azure Architecture Diagram ...
- How to Create an Azure Architecture Diagram Using ConceptDraw ...
- Network hardware - Vector stencils library | Software Defined ...
- Azure Storage | Workitems workflow diagram | Microsoft Azure ...
- How to Create an Azure Architecture Diagram Using ConceptDraw
- Mobile cloud architecture diagram | Diagramming tool - Amazon ...
